| Param | Original file | Final file |
|---|---|---|
| Filename | modeM0/AS1P01_010T01_9000000388cztM0_level2.fits | modeM0/AS1P01_010T01_9000000388cztM0_level2_quad_clean.evt |
| Size (bytes) | 26,426,880 | 34,225,920 |
| Size | 25.2 MB | 32.6 MB |
| Events in quadrant A | 157,882 | 221,354 |
| Events in quadrant B | 157,092 | 225,825 |
| Events in quadrant C | 157,636 | 205,450 |
| Events in quadrant D | 135,158 | 190,380 |
| Mode M9 | |||
|---|---|---|---|
| Quadrant | BADHDUFLAG | Total packets | Discarded packets |
| A | 0 | 4 | 0 |
| B | 0 | 4 | 0 |
| C | 0 | 4 | 0 |
| D | 0 | 5 | 0 |
| Mode SS | |||
|---|---|---|---|
| Quadrant | BADHDUFLAG | Total packets | Discarded packets |
| A | 0 | 54 | 0 |
| B | 0 | 54 | 0 |
| C | 0 | 54 | 0 |
| D | 0 | 54 | 0 |
| Mode M0 | |||
|---|---|---|---|
| Quadrant | BADHDUFLAG | Total packets | Discarded packets |
| A | 0 | 5541 | 0 |
| B | 0 | 5517 | 0 |
| C | 0 | 5843 | 0 |
| D | 0 | 5496 | 0 |
| Quadrant | Total seconds | Saturated seconds | Saturation percentage |
|---|---|---|---|
| A | 2690 | 6 | 0.223048% |
| B | 2690 | 6 | 0.223048% |
| C | 2690 | 7 | 0.260223% |
| D | 2690 | 3 | 0.111524% |
Noise dominated data is calculated using 1-second bins in cleaned event files. If a bin has >2000 counts, and if more than 50% of those come from <1% of pixels, then it is considered to be noise-dominated and hence unusable.
| Quadrant | # 1 sec bins | Bins with >0 counts | Bins with >2000 counts | High rate bins dominated by noise | Noise dominated (total time) | Noise dominated (detector-on time) | Marked lightcurve |
|---|---|---|---|---|---|---|---|
| A | 2689 | 2689 | 0 | 0 | 0.00% | 0.00% |  |
| B | 2689 | 2689 | 0 | 0 | 0.00% | 0.00% |  |
| C | 2689 | 2689 | 0 | 0 | 0.00% | 0.00% |  |
| D | 2689 | 2689 | 0 | 0 | 0.00% | 0.00% |  |
Top three noisy pixels from each quadrant. If the there are fewer than three noisy pixels in the level2.evt file, extra rows are filled as -1
| Pixel properties | Quadrant properties | ||||||
|---|---|---|---|---|---|---|---|
| Quadrant | DetID | PixID | Counts | Sigma | Mean | Median | Sigma |
| A | 14 | 188 | 169 | 10.75 | 41 | 39 | 12.1 |
| A | 7 | 110 | 150 | 9.18 | 41 | 39 | 12.1 |
| A | 0 | 29 | 142 | 8.52 | 41 | 39 | 12.1 |
| B | 2 | 9 | 134 | 9.31 | 41 | 40 | 10.1 |
| B | 14 | 254 | 128 | 8.71 | 41 | 40 | 10.1 |
| B | 12 | 226 | 126 | 8.52 | 41 | 40 | 10.1 |
| C | 9 | 188 | 128 | 6.92 | 41 | 39 | 12.9 |
| C | 1 | 65 | 121 | 6.38 | 41 | 39 | 12.9 |
| C | 9 | 242 | 114 | 5.83 | 41 | 39 | 12.9 |
| D | 1 | 19 | 119 | 6.97 | 38 | 35 | 12.1 |
| D | 3 | 14 | 103 | 5.64 | 38 | 35 | 12.1 |
| D | 7 | 3 | 102 | 5.56 | 38 | 35 | 12.1 |
Histogram calculated using DETX and DETY for each event in the final _common_clean file
| Quadrant A |  |
 |
Quadrant B |
|---|---|---|---|
| Quadrant D |  |
 |
Quadrant C |
| Plot type | Count rate plots | Images |
|---|---|---|
| Comparison with Poisson distribution Blue bars denote a histogram of data divided into 1 sec bins. Red curve is a Poisson curve with rate = median count rate of data. |
 |
 |
| Quadrant-wise count rates Data is divided into 100 sec bins |
 |
|
| Module-wise count rates for Quadrant A Data is divided into 100 sec bins |
 |
 |
| Module-wise count rates for Quadrant B Data is divided into 100 sec bins |
 |
 |
| Module-wise count rates for Quadrant C Data is divided into 100 sec bins |
 |
 |
| Module-wise count rates for Quadrant D Data is divided into 100 sec bins |
 |
 |
| Parameter | Plot |
|---|---|
| CZT HV Monitor |  |
| D_VDD | 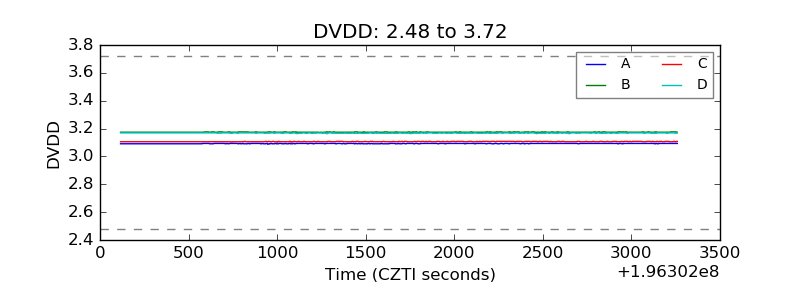 |
| Temperature 1 |  |
| Veto HV Monitor |  |
| Veto LLD |  |
| Alpha Counter |  |
| _CPM_Rate |  |
| CZT Counter |  |
| +2.5 Volts monitor |  |
| +5 Volts monitor |  |
| _ROLL_ROT |  |
| _Roll_DEC |  |
| _Roll_RA |  |
| Veto Counter |  |