| Param | Original file | Final file |
|---|---|---|
| Filename | modeM0/AS1P01_010T01_9000000388_02605cztM0_level2.evt | modeM0/AS1P01_010T01_9000000388_02605cztM0_level2_quad_clean.evt |
| Size (bytes) | 169,286,400 | 46,702,080 |
| Size | 161.4 MB | 44.5 MB |
| Events in quadrant A | 1,231,605 | 310,338 |
| Events in quadrant B | 1,241,999 | 317,778 |
| Events in quadrant C | 1,311,544 | 300,795 |
| Events in quadrant D | 1,156,120 | 292,383 |
| Mode M9 | |||
|---|---|---|---|
| Quadrant | BADHDUFLAG | Total packets | Discarded packets |
| A | 0 | 4 | 0 |
| B | 0 | 4 | 0 |
| C | 0 | 4 | 0 |
| D | 0 | 5 | 0 |
| Mode SS | |||
|---|---|---|---|
| Quadrant | BADHDUFLAG | Total packets | Discarded packets |
| A | 0 | 54 | 0 |
| B | 0 | 54 | 0 |
| C | 0 | 54 | 0 |
| D | 0 | 54 | 0 |
| Mode M0 | |||
|---|---|---|---|
| Quadrant | BADHDUFLAG | Total packets | Discarded packets |
| A | 0 | 5541 | 0 |
| B | 0 | 5517 | 0 |
| C | 0 | 5843 | 0 |
| D | 0 | 5496 | 0 |
| Quadrant | Total seconds | Saturated seconds | Saturation percentage |
|---|---|---|---|
| A | 2690 | 6 | 0.223048% |
| B | 2690 | 6 | 0.223048% |
| C | 2690 | 7 | 0.260223% |
| D | 2690 | 3 | 0.111524% |
Noise dominated data is calculated using 1-second bins in cleaned event files. If a bin has >2000 counts, and if more than 50% of those come from <1% of pixels, then it is considered to be noise-dominated and hence unusable.
| Quadrant | # 1 sec bins | Bins with >0 counts | Bins with >2000 counts | High rate bins dominated by noise | Noise dominated (total time) | Noise dominated (detector-on time) | Marked lightcurve |
|---|---|---|---|---|---|---|---|
| A | 2690 | 2690 | 0 | 0 | 0.00% | 0.00% | 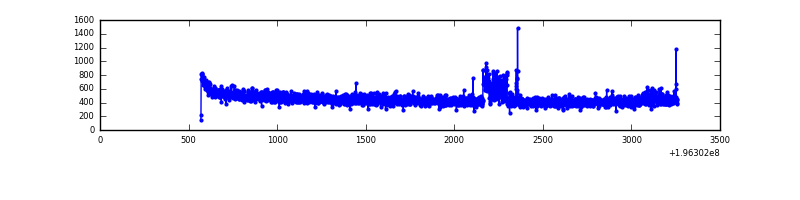 |
| B | 2690 | 2690 | 3 | 3 | 0.11% | 0.11% | 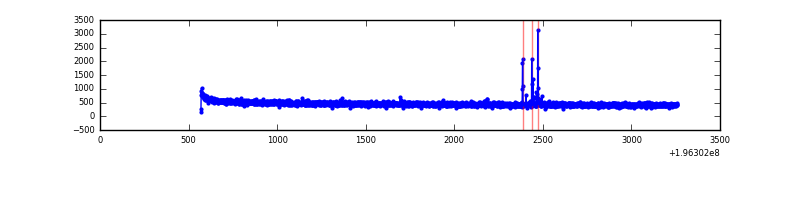 |
| C | 2690 | 2690 | 2 | 2 | 0.07% | 0.07% | 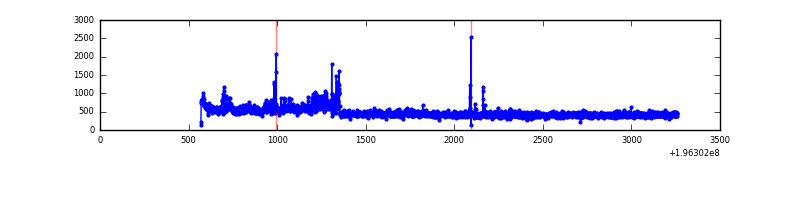 |
| D | 2690 | 2690 | 0 | 0 | 0.00% | 0.00% | 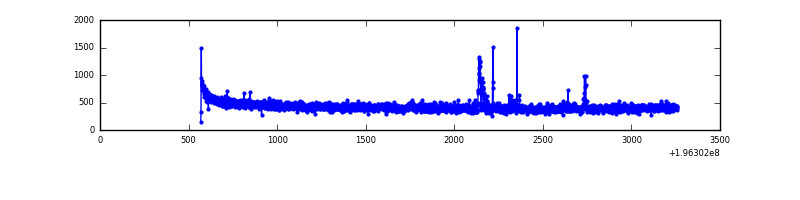 |
Top three noisy pixels from each quadrant. If the there are fewer than three noisy pixels in the level2.evt file, extra rows are filled as -1
| Pixel properties | Quadrant properties | ||||||
|---|---|---|---|---|---|---|---|
| Quadrant | DetID | PixID | Counts | Sigma | Mean | Median | Sigma |
| A | 3 | 1 | 43176 | 675.98 | 308 | 301 | 63.4 |
| A | 0 | 226 | 3241 | 46.35 | 308 | 301 | 63.4 |
| A | 12 | 194 | 3196 | 45.64 | 308 | 301 | 63.4 |
| B | 10 | 244 | 20148 | 334.19 | 315 | 307 | 59.4 |
| B | 0 | 189 | 8477 | 137.61 | 315 | 307 | 59.4 |
| B | 12 | 111 | 4265 | 66.67 | 315 | 307 | 59.4 |
| C | 2 | 53 | 90113 | 1261.01 | 304 | 305 | 71.2 |
| C | 10 | 82 | 21785 | 301.6 | 304 | 305 | 71.2 |
| C | 10 | 34 | 8150 | 110.15 | 304 | 305 | 71.2 |
| D | 2 | 14 | 15442 | 215.92 | 294 | 287 | 70.2 |
| D | 7 | 67 | 11575 | 160.83 | 294 | 287 | 70.2 |
| D | 15 | 194 | 5406 | 72.93 | 294 | 287 | 70.2 |
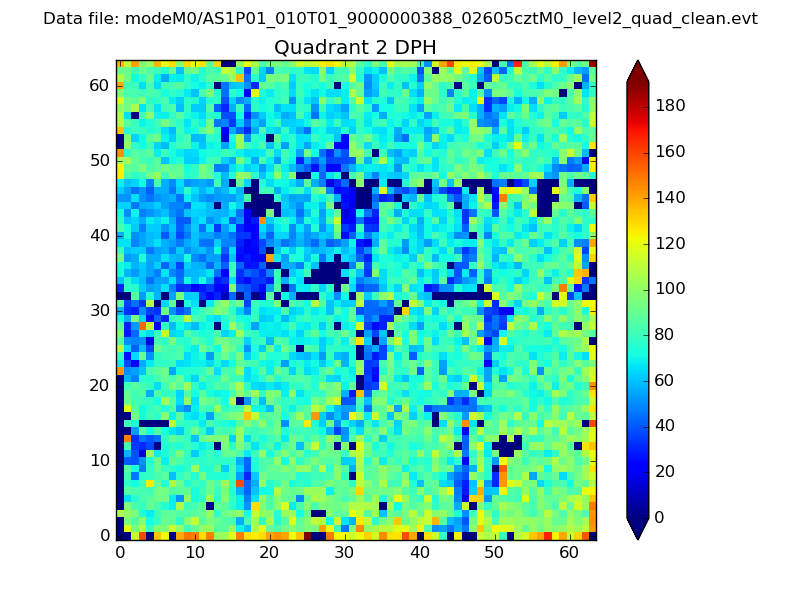
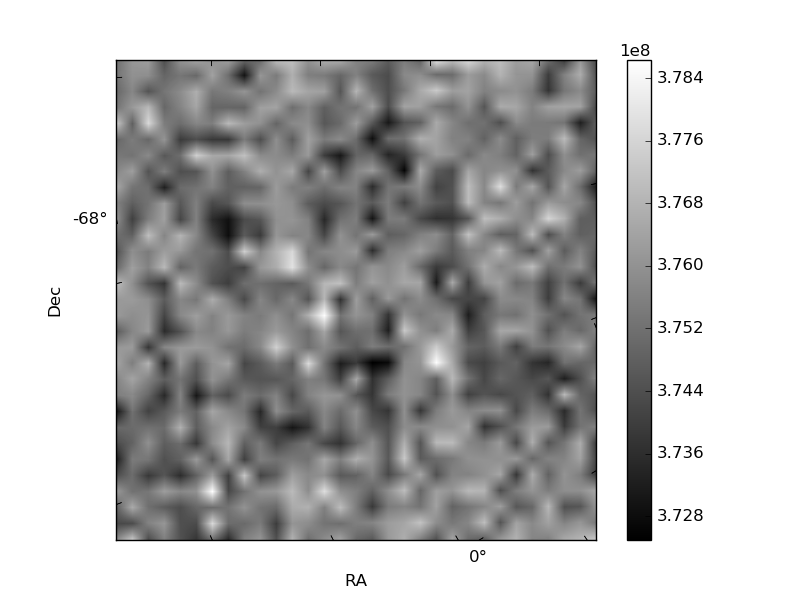
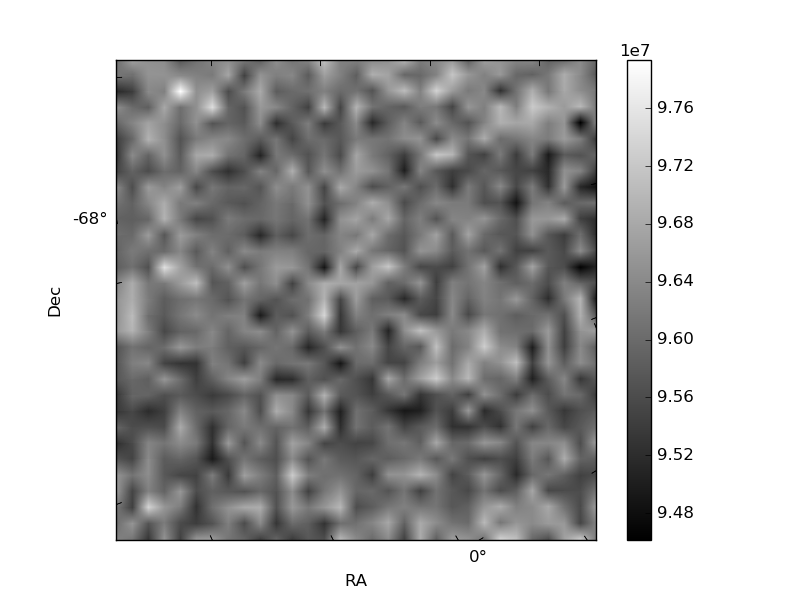
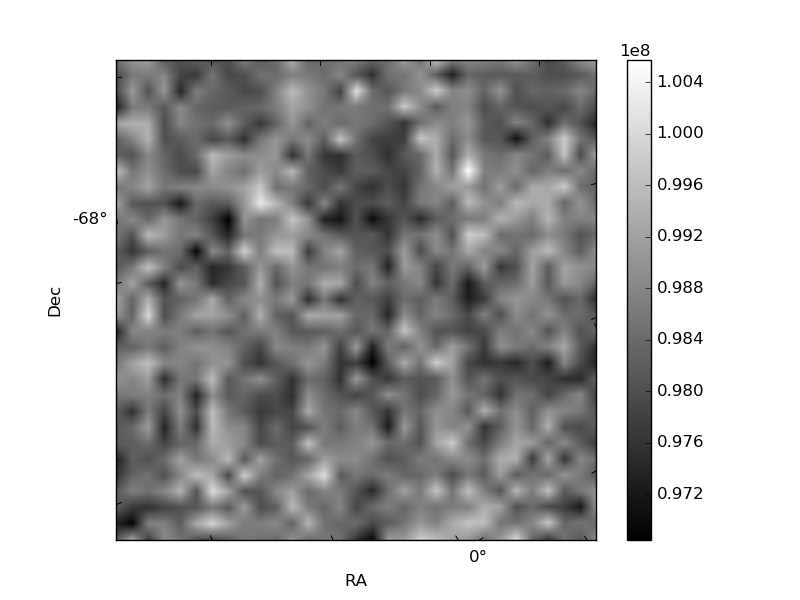
Histogram calculated using DETX and DETY for each event in the final _common_clean file
| Quadrant A | 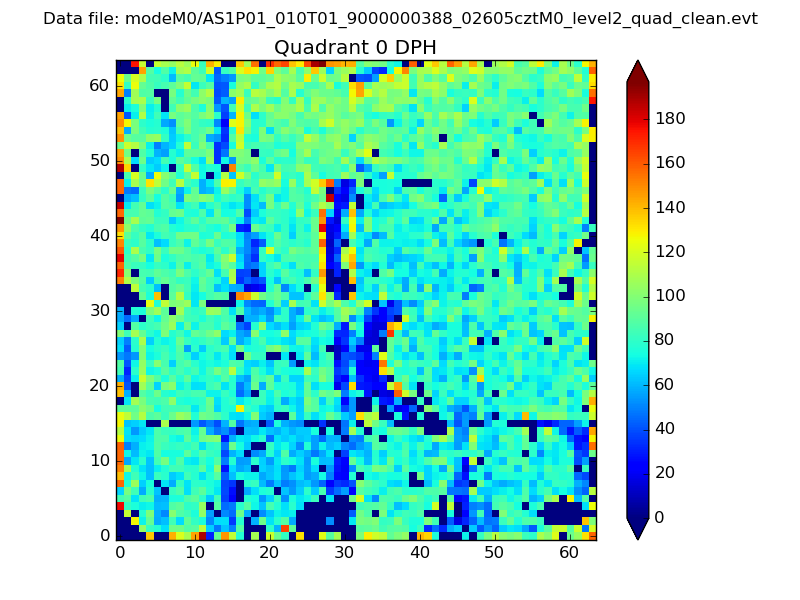 |
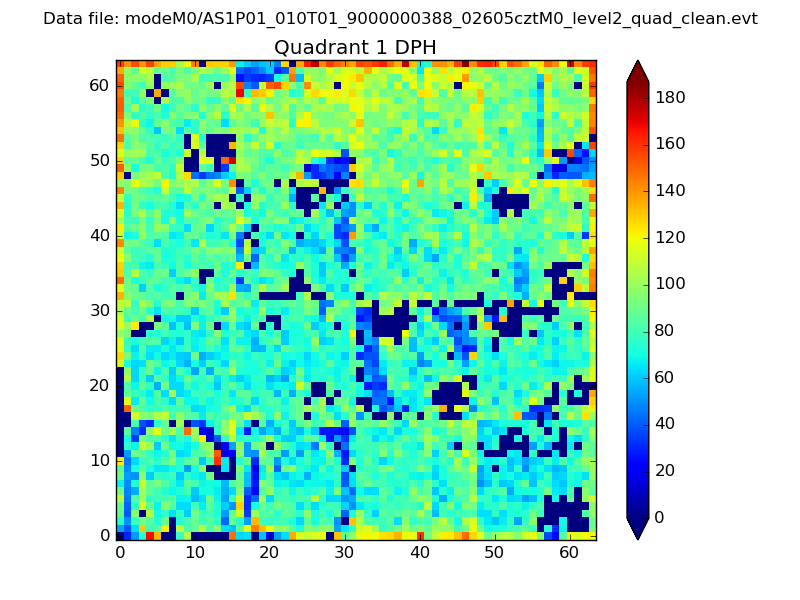 |
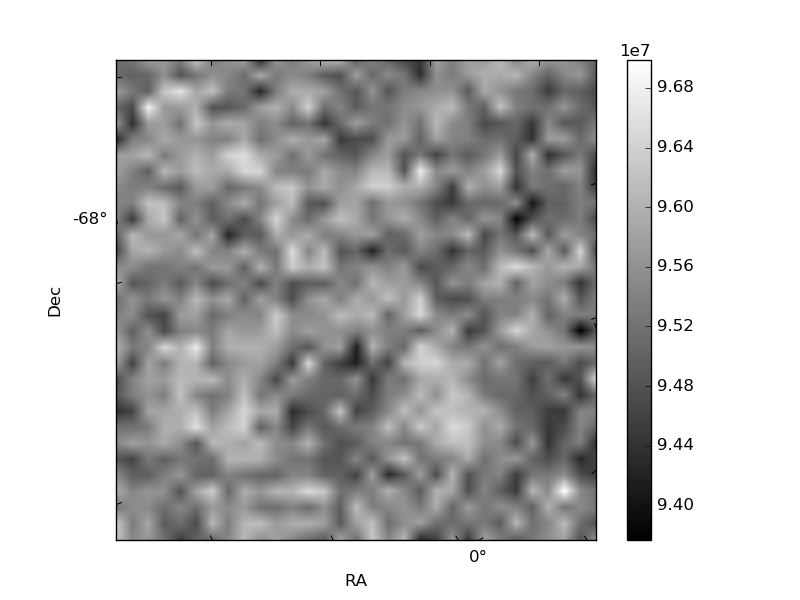
Quadrant B |
|---|---|---|---|
| Quadrant D | 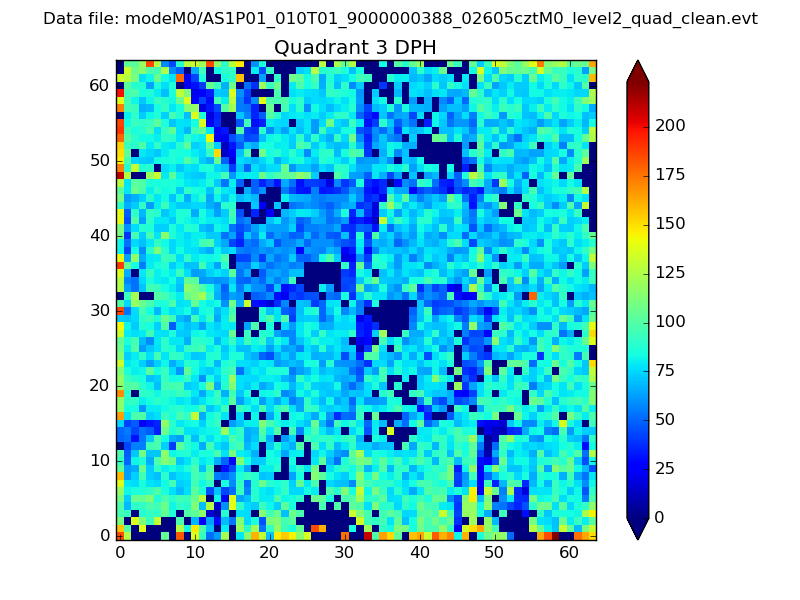 |
 |
Quadrant C |
| Plot type | Count rate plots | Images |
|---|---|---|
| Comparison with Poisson distribution Blue bars denote a histogram of data divided into 1 sec bins. Red curve is a Poisson curve with rate = median count rate of data. |
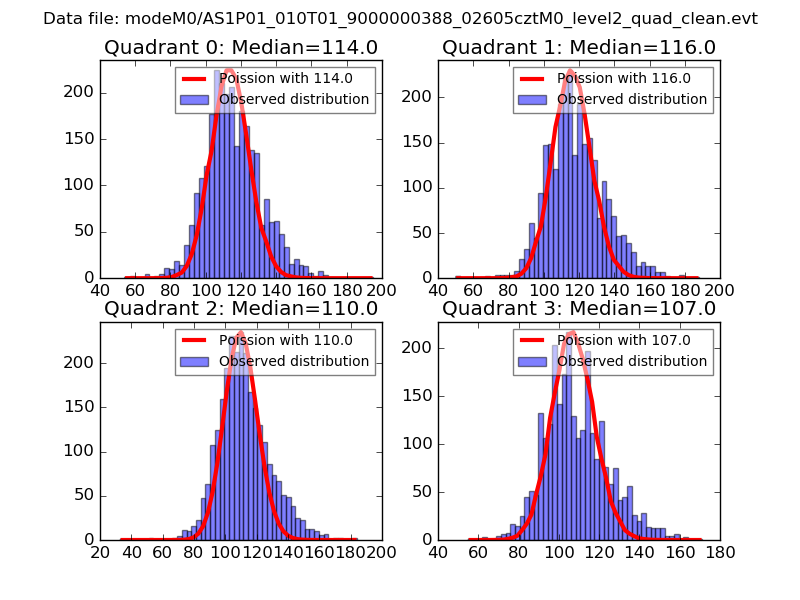 |
 |
| Quadrant-wise count rates Data is divided into 100 sec bins |
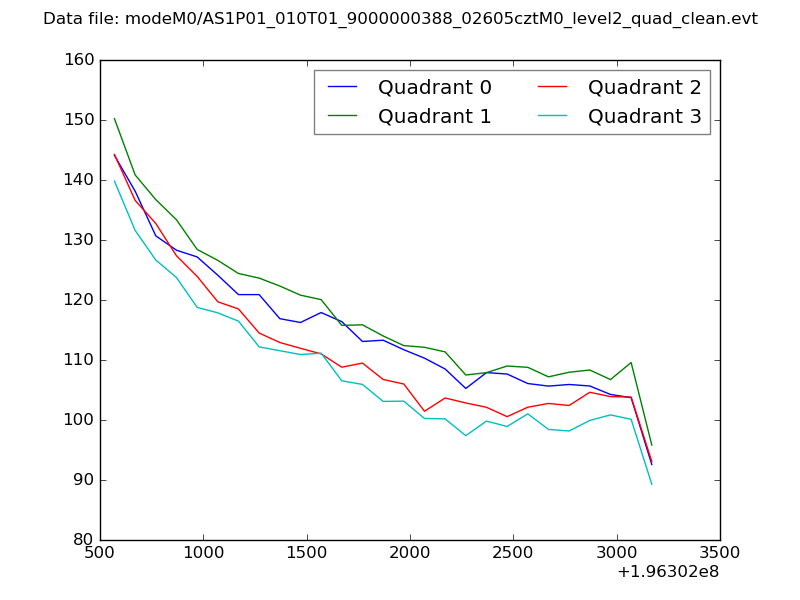 |
|
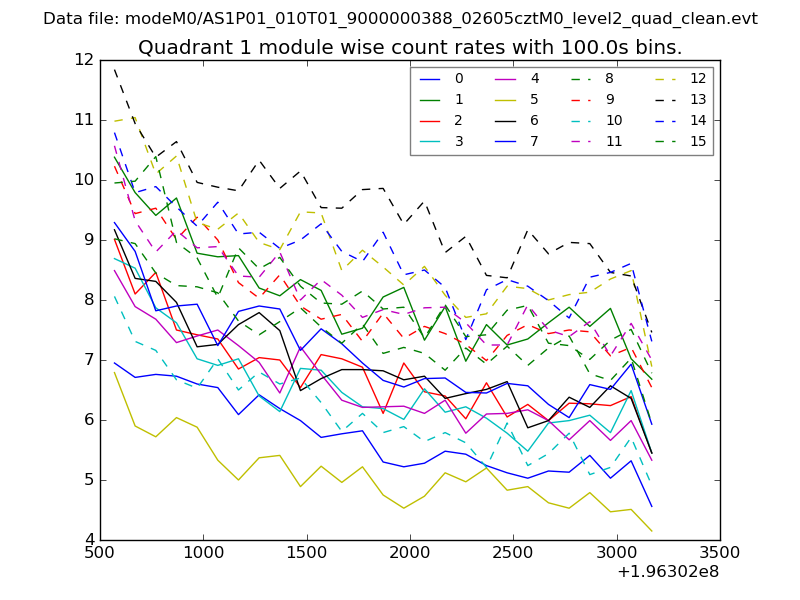
| Module-wise count rates for Quadrant A Data is divided into 100 sec bins |
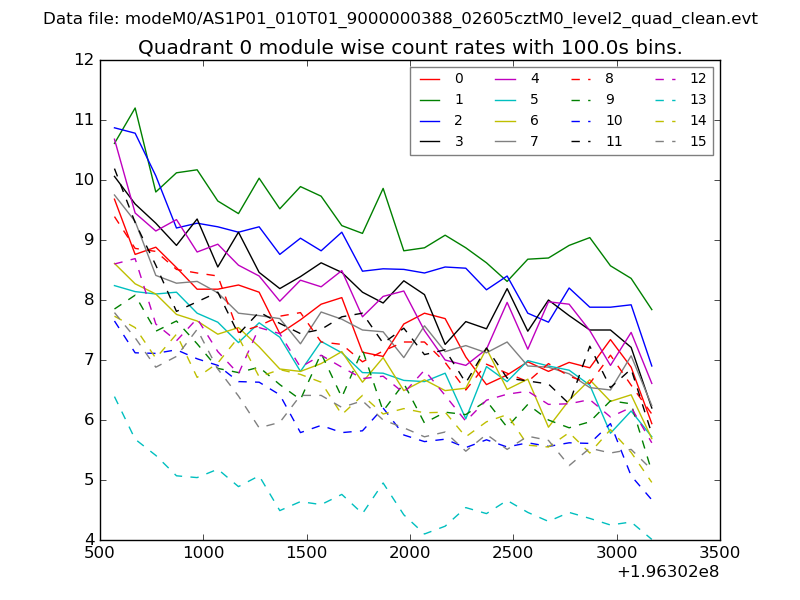 |
 |
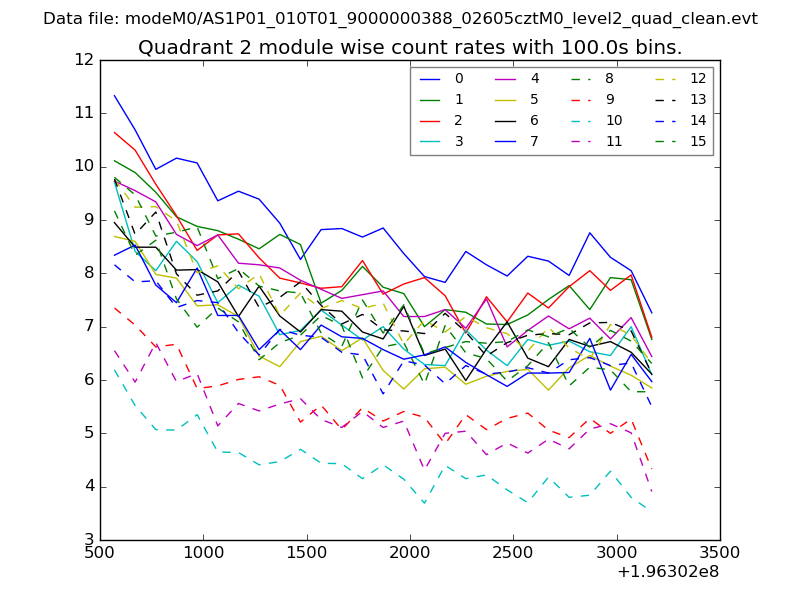
| Module-wise count rates for Quadrant B Data is divided into 100 sec bins |
 |
 |
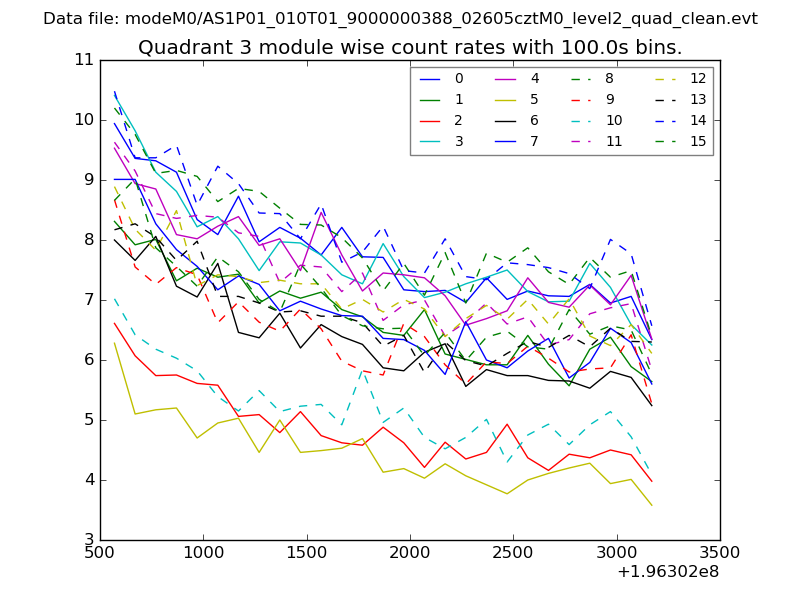
| Module-wise count rates for Quadrant C Data is divided into 100 sec bins |
 |
 |
| Module-wise count rates for Quadrant D Data is divided into 100 sec bins |
 |
 |
| Parameter | Plot |
|---|---|
| CZT HV Monitor | 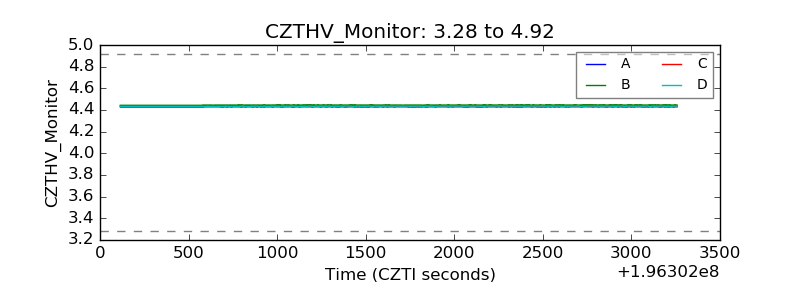 |
| D_VDD |  |
| Temperature 1 | 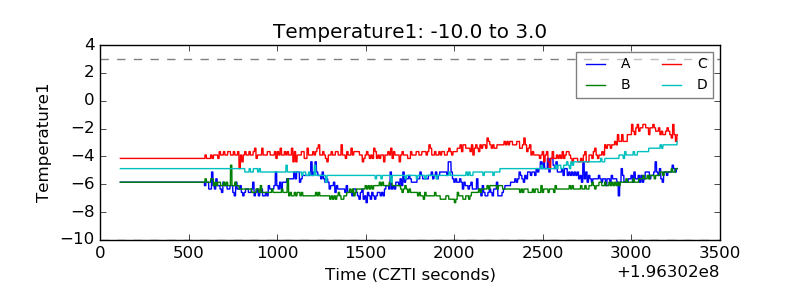 |
| Veto HV Monitor | 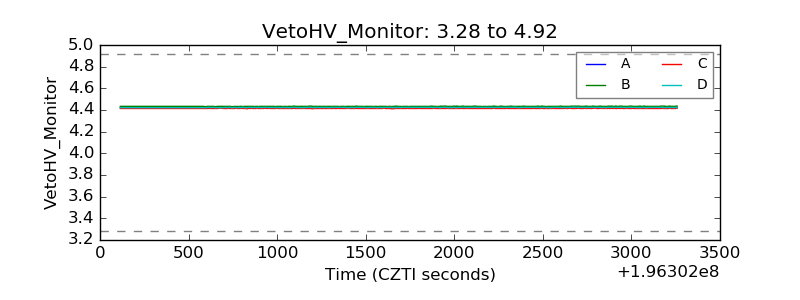 |
| Veto LLD | 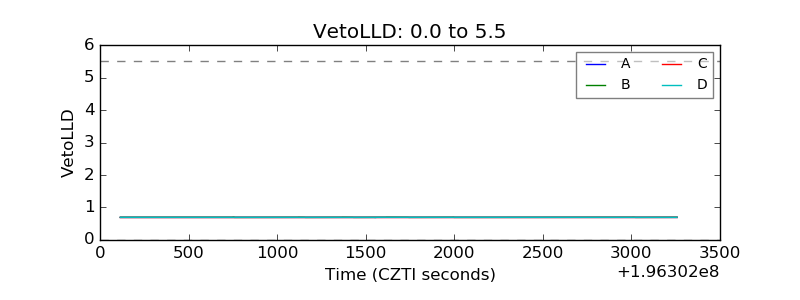 |
| Alpha Counter | 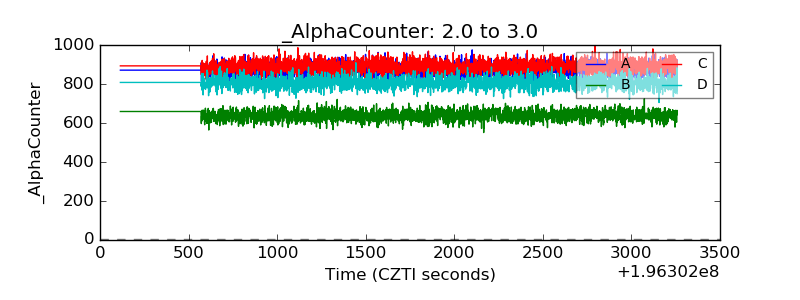 |
| _CPM_Rate | 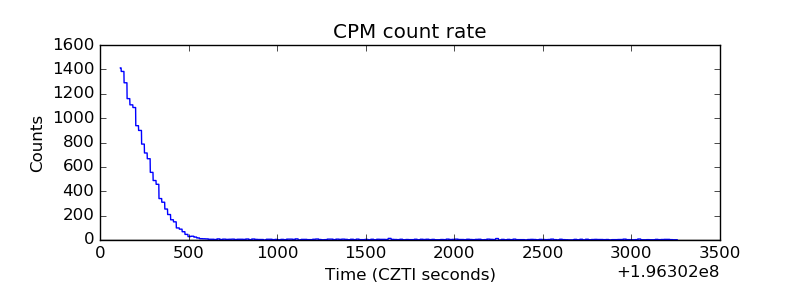 |
| CZT Counter | 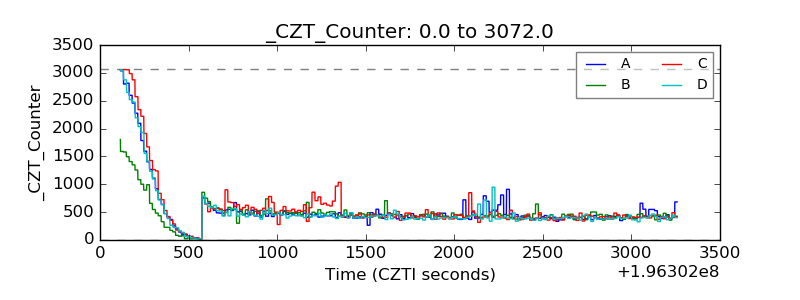 |
| +2.5 Volts monitor | 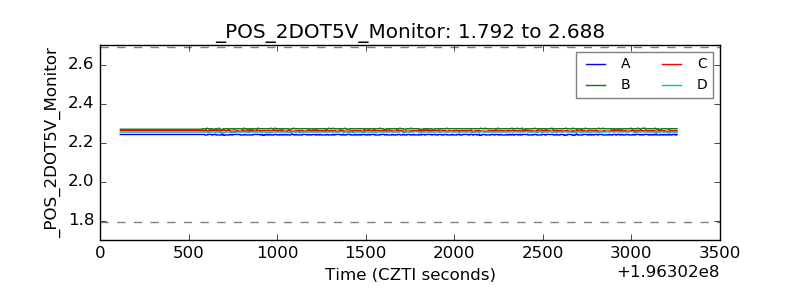 |
| +5 Volts monitor |  |
| Veto Counter | 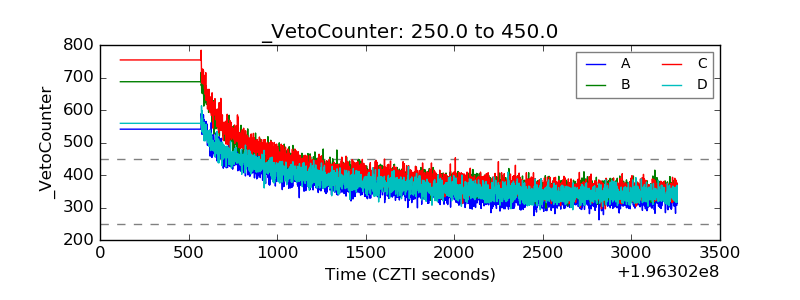 |