| Param | Original file | Final file |
|---|---|---|
| Filename | modeM0/AS1SLEW_01234_9000000385_02600cztM0_level2.evt | modeM0/AS1SLEW_01234_9000000385_02600cztM0_level2_quad_clean.evt |
| Size (bytes) | 48,188,160 | 11,882,880 |
| Size | 46.0 MB | 11.3 MB |
| Events in quadrant A | 336,104 | 75,273 |
| Events in quadrant B | 382,615 | 76,700 |
| Events in quadrant C | 342,067 | 75,788 |
| Events in quadrant D | 345,016 | 72,530 |
| Mode M0 | |||
|---|---|---|---|
| Quadrant | BADHDUFLAG | Total packets | Discarded packets |
| A | 0 | 1464 | 0 |
| B | 0 | 1582 | 0 |
| C | 0 | 1464 | 0 |
| D | 0 | 1506 | 0 |
| Mode SS | |||
|---|---|---|---|
| Quadrant | BADHDUFLAG | Total packets | Discarded packets |
| A | 0 | 16 | 0 |
| B | 0 | 16 | 0 |
| C | 0 | 16 | 0 |
| D | 0 | 16 | 0 |
| Quadrant | Total seconds | Saturated seconds | Saturation percentage |
|---|---|---|---|
| A | 731 | 2 | 0.273598% |
| B | 731 | 16 | 2.188782% |
| C | 731 | 1 | 0.136799% |
| D | 731 | 3 | 0.410397% |
Noise dominated data is calculated using 1-second bins in cleaned event files. If a bin has >2000 counts, and if more than 50% of those come from <1% of pixels, then it is considered to be noise-dominated and hence unusable.
| Quadrant | # 1 sec bins | Bins with >0 counts | Bins with >2000 counts | High rate bins dominated by noise | Noise dominated (total time) | Noise dominated (detector-on time) | Marked lightcurve |
|---|---|---|---|---|---|---|---|
| A | 731 | 731 | 0 | 0 | 0.00% | 0.00% | 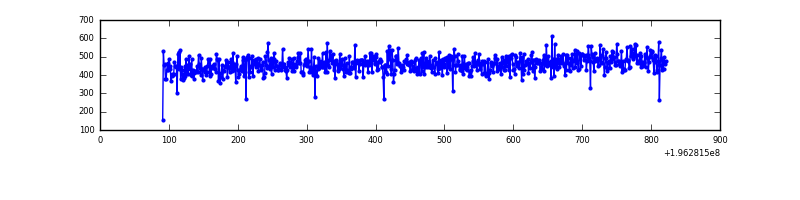 |
| B | 731 | 731 | 8 | 8 | 1.09% | 1.09% | 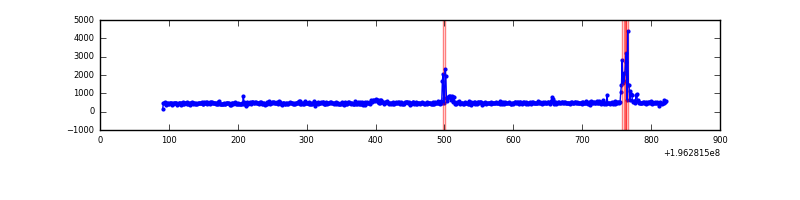 |
| C | 731 | 731 | 0 | 0 | 0.00% | 0.00% | 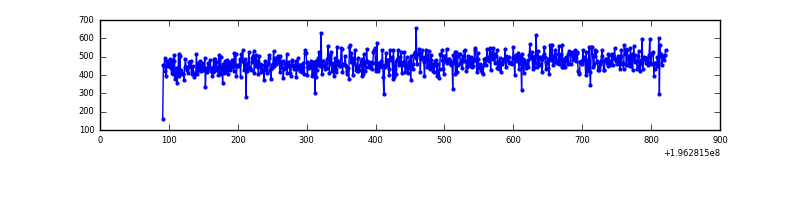 |
| D | 731 | 731 | 3 | 3 | 0.41% | 0.41% | 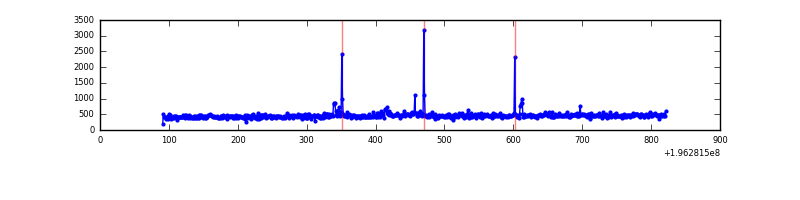 |
Top three noisy pixels from each quadrant. If the there are fewer than three noisy pixels in the level2.evt file, extra rows are filled as -1
| Pixel properties | Quadrant properties | ||||||
|---|---|---|---|---|---|---|---|
| Quadrant | DetID | PixID | Counts | Sigma | Mean | Median | Sigma |
| A | 12 | 194 | 885 | 40.45 | 87 | 85 | 19.8 |
| A | 0 | 226 | 884 | 40.4 | 87 | 85 | 19.8 |
| A | 3 | 1 | 685 | 30.34 | 87 | 85 | 19.8 |
| B | 10 | 244 | 42442 | 2162.6 | 88 | 85 | 19.6 |
| B | 12 | 111 | 1304 | 62.24 | 88 | 85 | 19.6 |
| B | 11 | 111 | 1115 | 52.59 | 88 | 85 | 19.6 |
| C | 13 | 61 | 772 | 30.51 | 87 | 87 | 22.5 |
| C | 3 | 202 | 209 | 5.43 | 87 | 87 | 22.5 |
| C | -1 | -1 | -1 | -1.0 | 87 | 87 | 22.5 |
| D | 9 | 64 | 9613 | 429.95 | 85 | 83 | 22.2 |
| D | 2 | 136 | 4389 | 194.27 | 85 | 83 | 22.2 |
| D | 2 | 63 | 3135 | 137.69 | 85 | 83 | 22.2 |
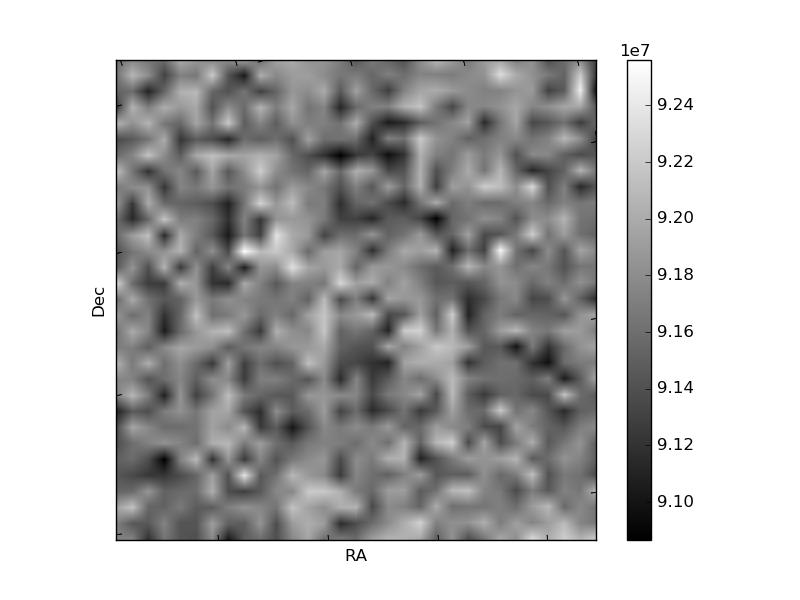
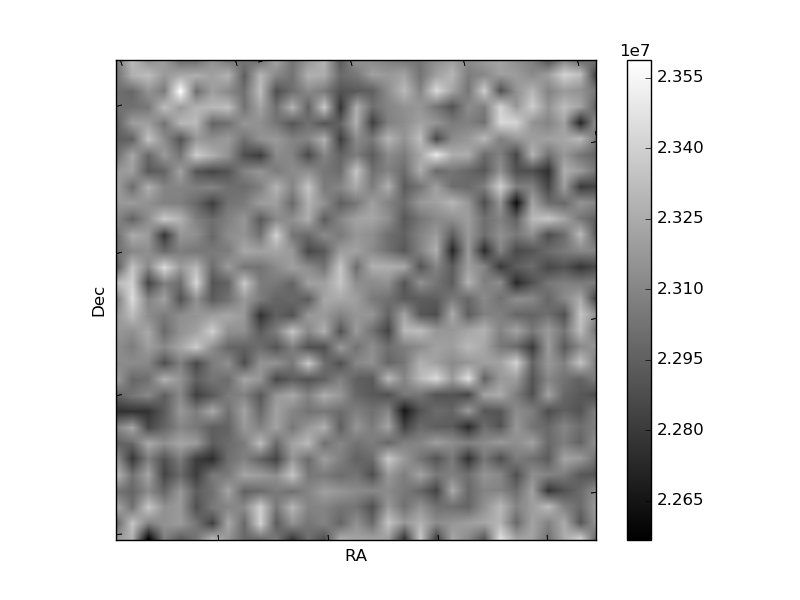
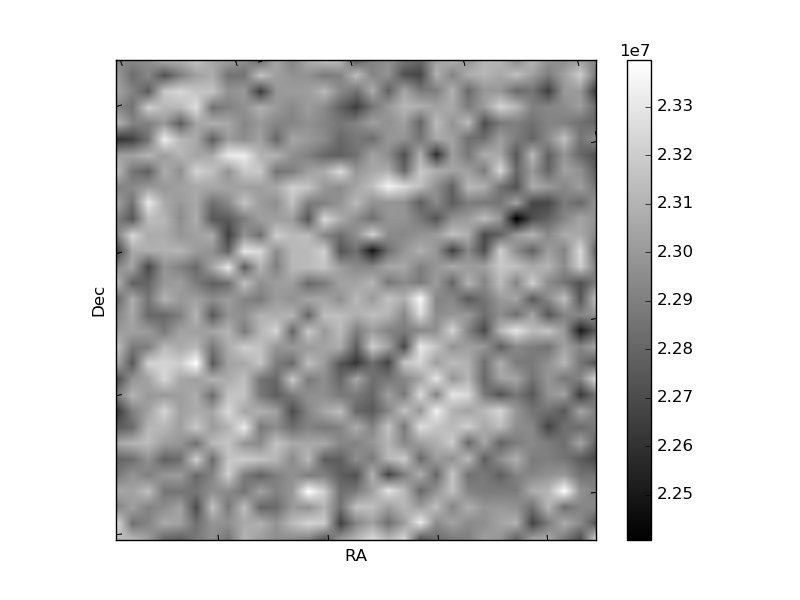
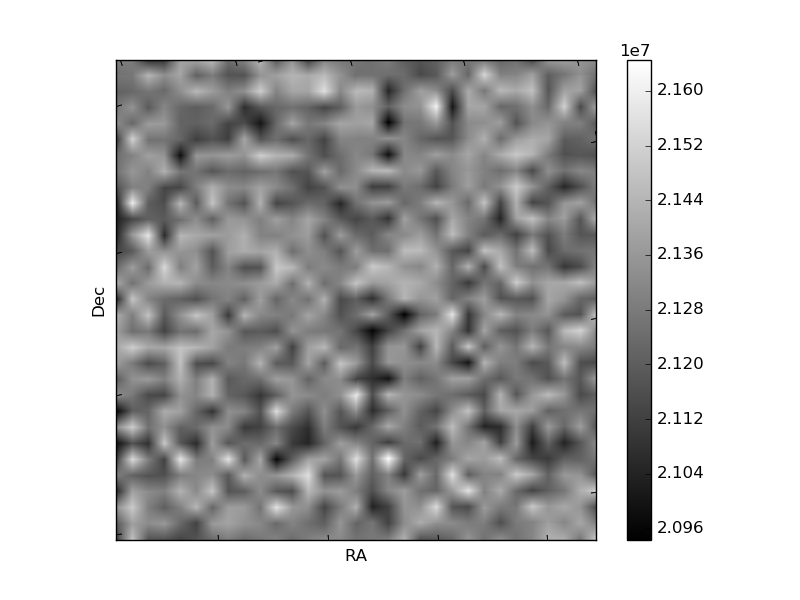
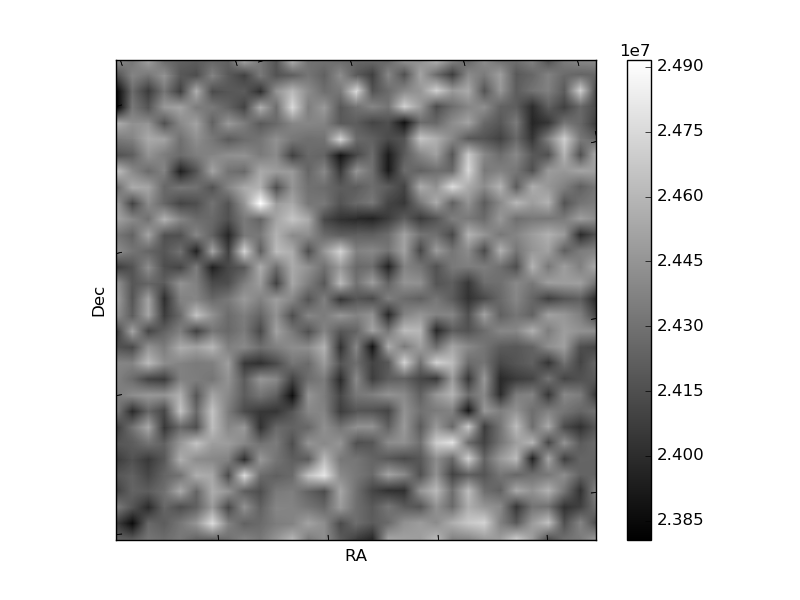
Histogram calculated using DETX and DETY for each event in the final _common_clean file
| Quadrant A | 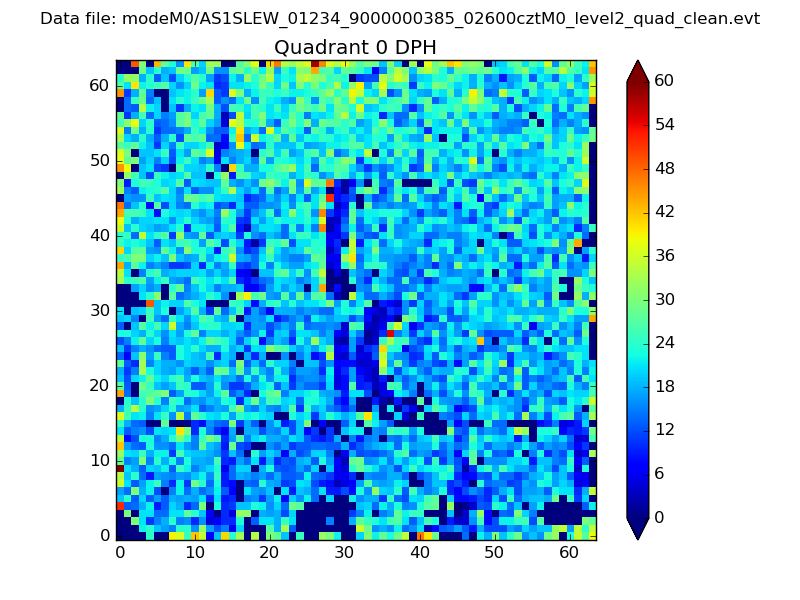 |
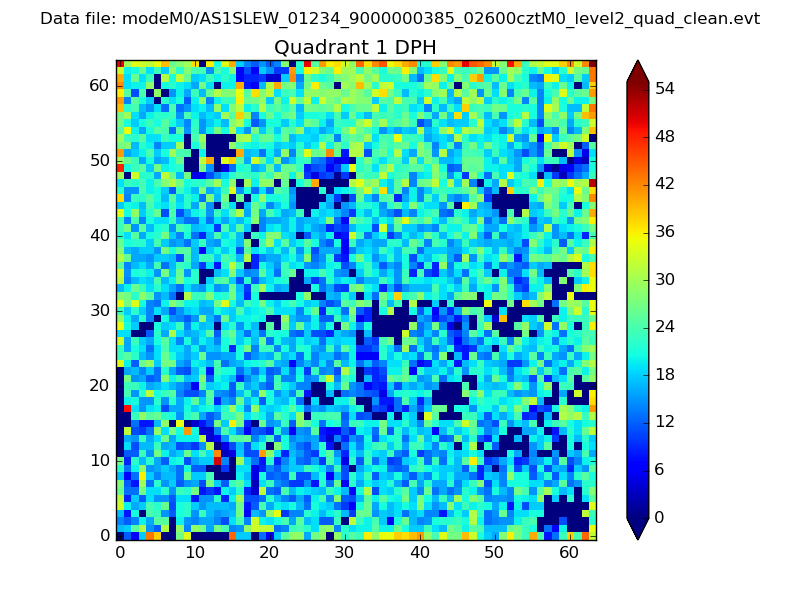 |
Quadrant B |
|---|---|---|---|
| Quadrant D | 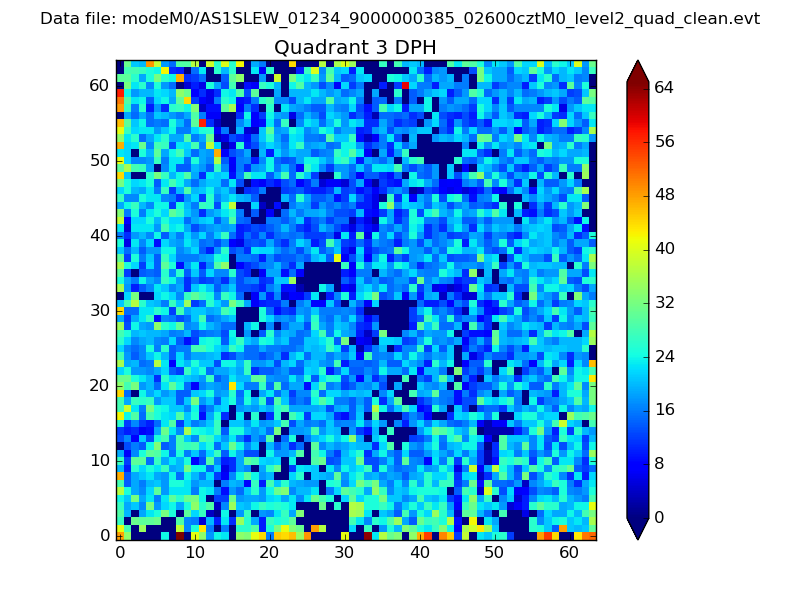 |
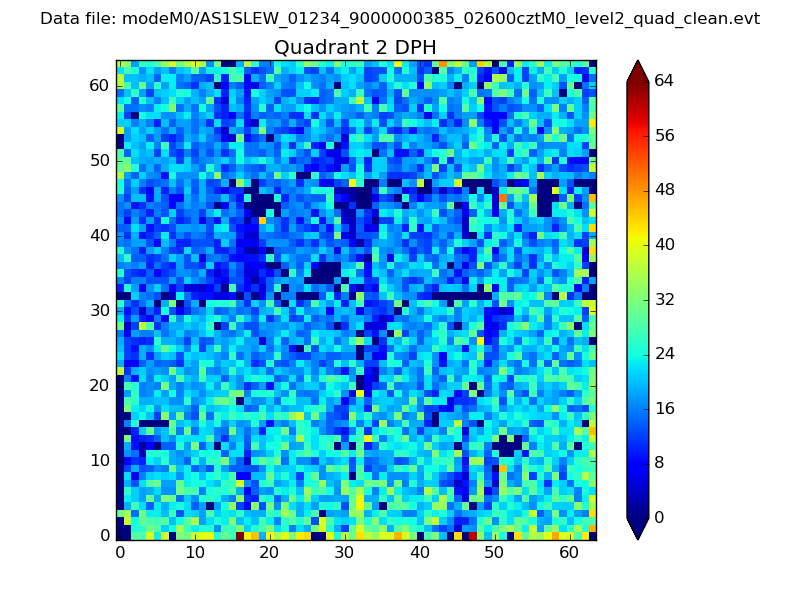 |
Quadrant C |
| Plot type | Count rate plots | Images |
|---|---|---|
| Comparison with Poisson distribution Blue bars denote a histogram of data divided into 1 sec bins. Red curve is a Poisson curve with rate = median count rate of data. |
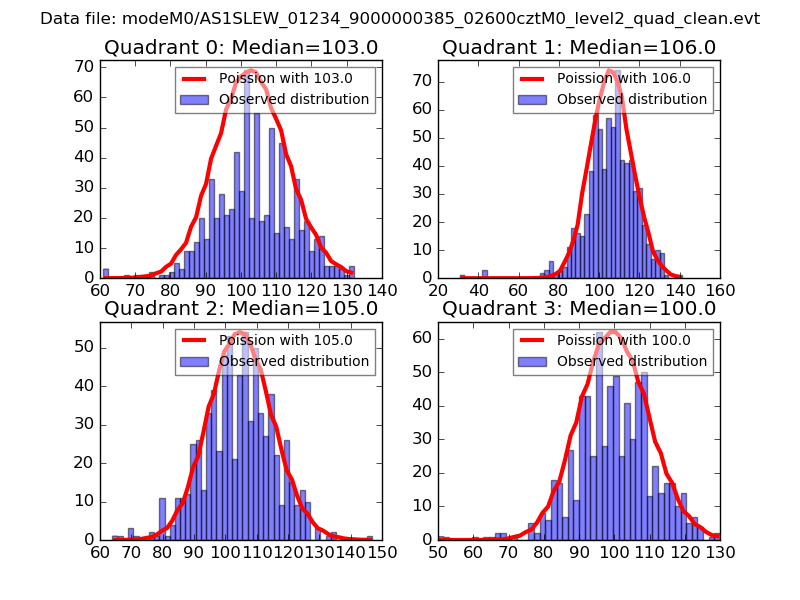 |
 |
| Quadrant-wise count rates Data is divided into 100 sec bins |
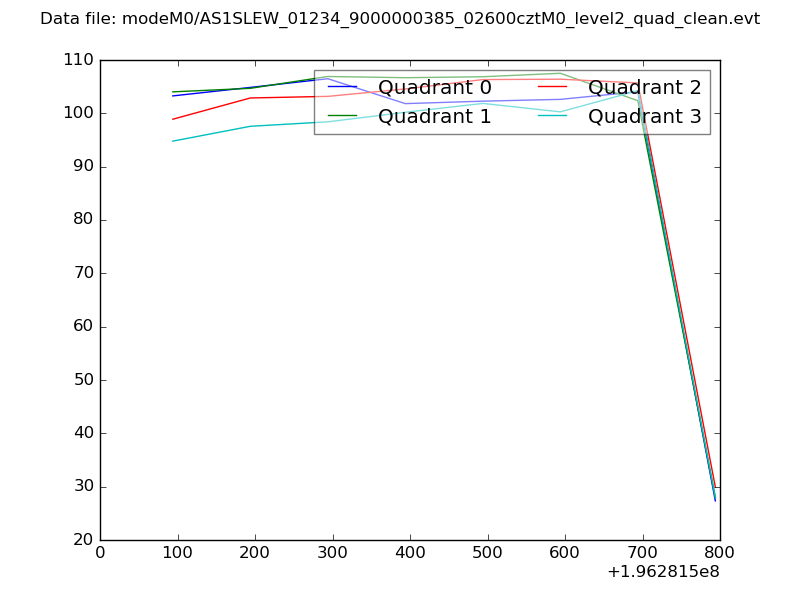 |
|
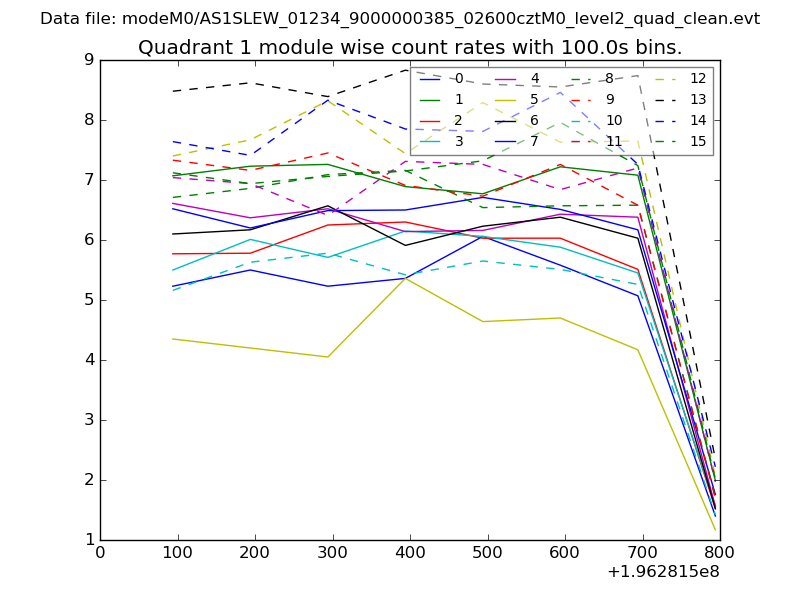
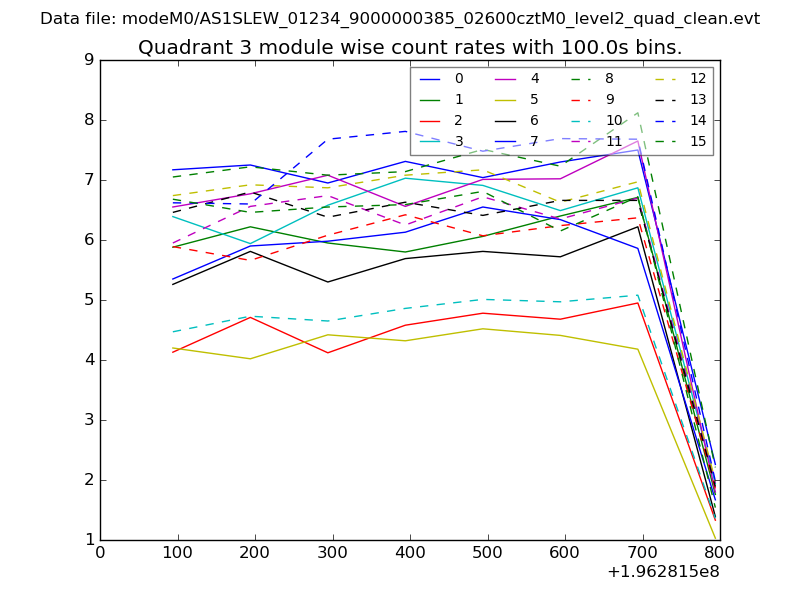
| Module-wise count rates for Quadrant A Data is divided into 100 sec bins |
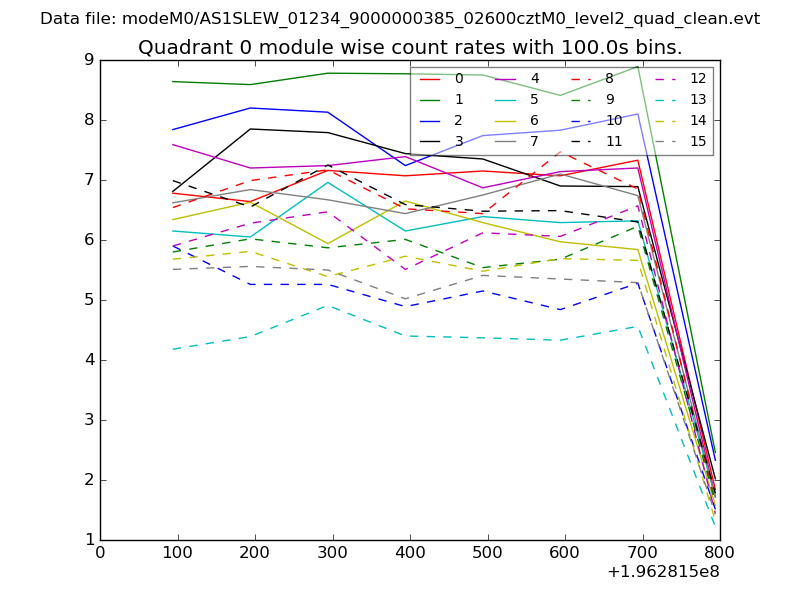 |
 |
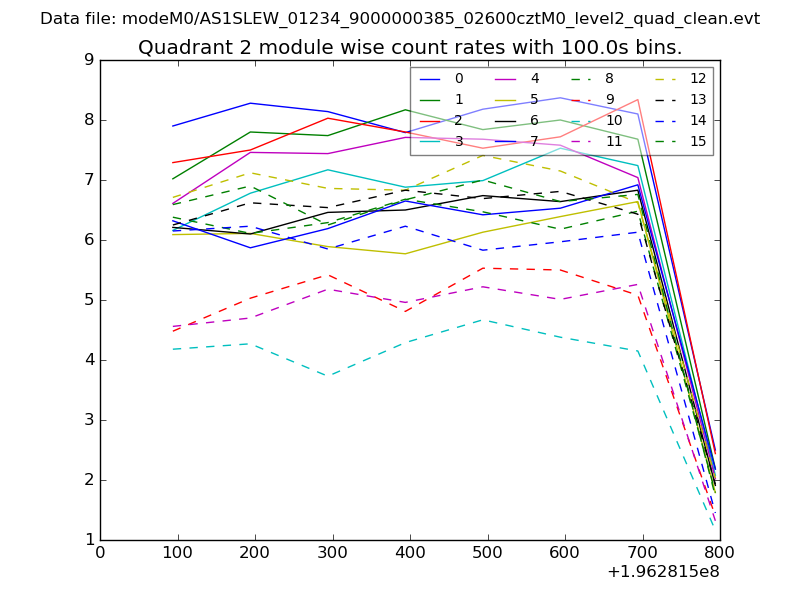
| Module-wise count rates for Quadrant B Data is divided into 100 sec bins |
 |
 |
| Module-wise count rates for Quadrant C Data is divided into 100 sec bins |
 |
 |
| Module-wise count rates for Quadrant D Data is divided into 100 sec bins |
 |
 |
| Parameter | Plot |
|---|---|
| CZT HV Monitor | 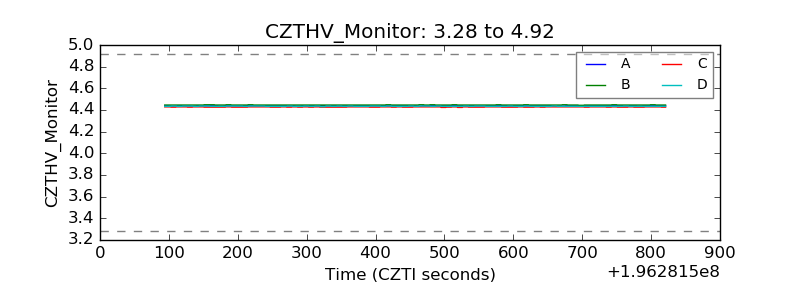 |
| D_VDD | 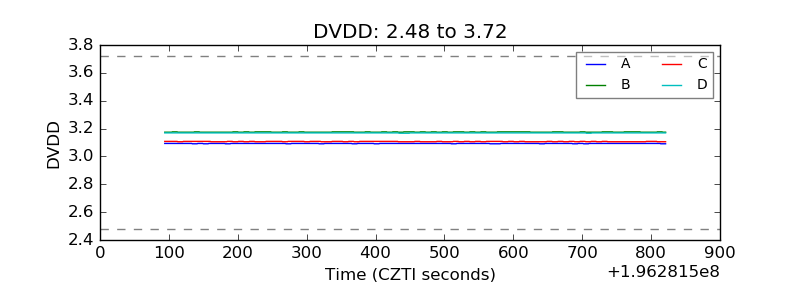 |
| Temperature 1 |  |
| Veto HV Monitor | 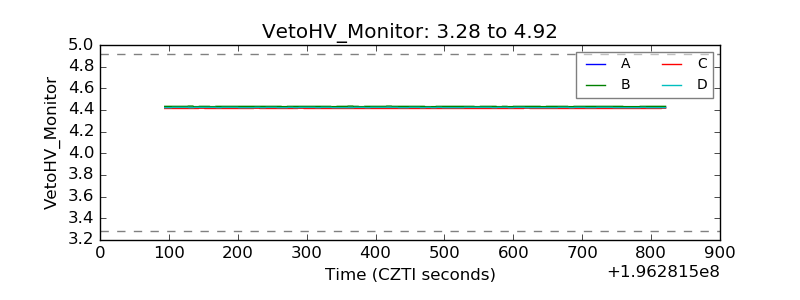 |
| Veto LLD |  |
| Alpha Counter | 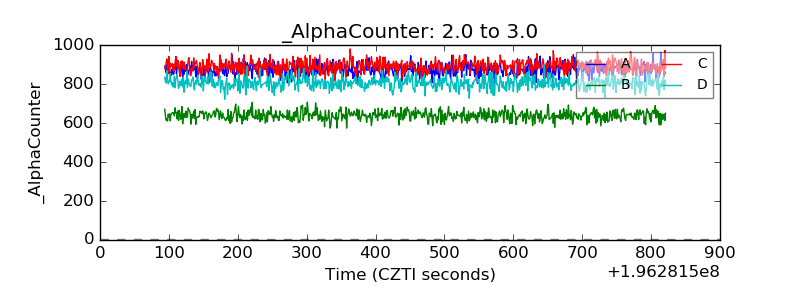 |
| _CPM_Rate | 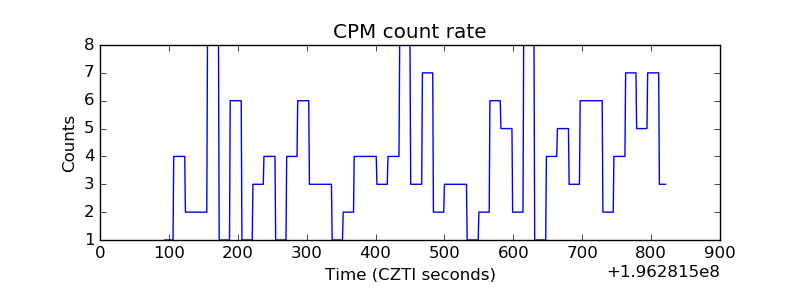 |
| CZT Counter | 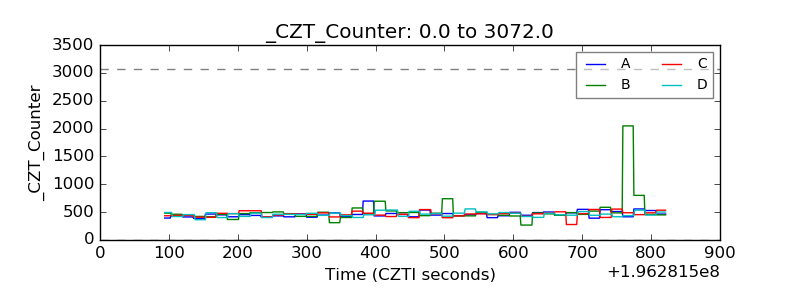 |
| +2.5 Volts monitor |  |
| +5 Volts monitor |  |
| Veto Counter | 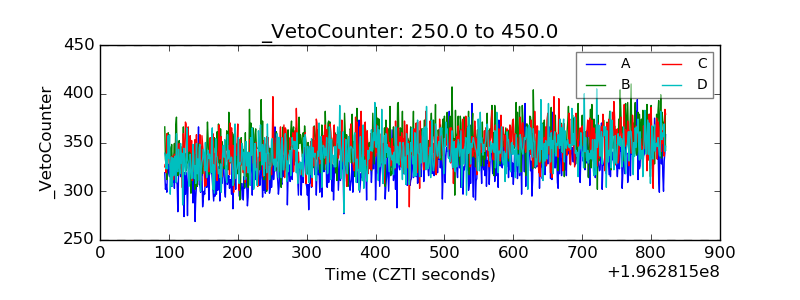 |