| Param | Original file | Final file |
|---|---|---|
| Filename | modeM0/AS1T01_107T01_9000000386cztM0_level2.fits | modeM0/AS1T01_107T01_9000000386cztM0_level2_quad_clean.evt |
| Size (bytes) | 117,763,200 | 127,837,440 |
| Size | 112.3 MB | 121.9 MB |
| Events in quadrant A | 701,980 | 769,403 |
| Events in quadrant B | 683,166 | 782,282 |
| Events in quadrant C | 684,254 | 732,707 |
| Events in quadrant D | 583,942 | 673,158 |
| Mode M9 | |||
|---|---|---|---|
| Quadrant | BADHDUFLAG | Total packets | Discarded packets |
| A | 0 | 30 | 0 |
| B | 0 | 30 | 0 |
| C | 0 | 30 | 0 |
| D | 0 | 31 | 0 |
| Mode M0 | |||
|---|---|---|---|
| Quadrant | BADHDUFLAG | Total packets | Discarded packets |
| A | 0 | 26793 | 0 |
| B | 0 | 26950 | 0 |
| C | 0 | 28922 | 0 |
| D | 0 | 27528 | 0 |
| Mode SS | |||
|---|---|---|---|
| Quadrant | BADHDUFLAG | Total packets | Discarded packets |
| A | 0 | 268 | 0 |
| B | 0 | 268 | 0 |
| C | 0 | 268 | 0 |
| D | 0 | 268 | 0 |
| Quadrant | Total seconds | Saturated seconds | Saturation percentage |
|---|---|---|---|
| A | 13224 | 36 | 0.272232% |
| B | 13224 | 40 | 0.302480% |
| C | 13224 | 189 | 1.429220% |
| D | 13224 | 38 | 0.287356% |
Noise dominated data is calculated using 1-second bins in cleaned event files. If a bin has >2000 counts, and if more than 50% of those come from <1% of pixels, then it is considered to be noise-dominated and hence unusable.
| Quadrant | # 1 sec bins | Bins with >0 counts | Bins with >2000 counts | High rate bins dominated by noise | Noise dominated (total time) | Noise dominated (detector-on time) | Marked lightcurve |
|---|---|---|---|---|---|---|---|
| A | 15448 | 13223 | 0 | 0 | 0.00% | 0.00% |  |
| B | 15448 | 13223 | 0 | 0 | 0.00% | 0.00% | 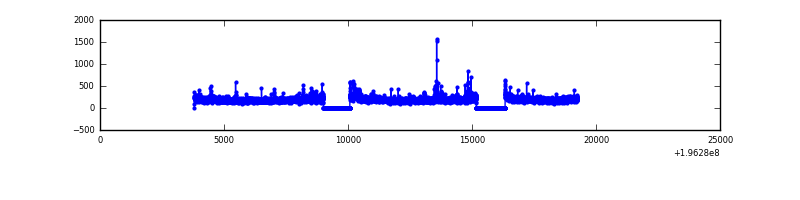 |
| C | 15448 | 13224 | 0 | 0 | 0.00% | 0.00% |  |
| D | 15448 | 13223 | 0 | 0 | 0.00% | 0.00% | 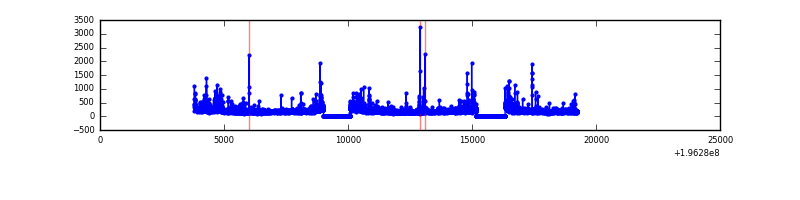 |
Top three noisy pixels from each quadrant. If the there are fewer than three noisy pixels in the level2.evt file, extra rows are filled as -1
| Pixel properties | Quadrant properties | ||||||
|---|---|---|---|---|---|---|---|
| Quadrant | DetID | PixID | Counts | Sigma | Mean | Median | Sigma |
| A | 14 | 188 | 691 | 10.48 | 181 | 170 | 49.7 |
| A | 0 | 29 | 686 | 10.38 | 181 | 170 | 49.7 |
| A | 7 | 110 | 593 | 8.51 | 181 | 170 | 49.7 |
| B | 2 | 9 | 615 | 12.0 | 180 | 172 | 36.9 |
| B | 12 | 226 | 544 | 10.08 | 180 | 172 | 36.9 |
| B | 2 | 8 | 464 | 7.91 | 180 | 172 | 36.9 |
| C | 12 | 241 | 504 | 6.73 | 180 | 167 | 50.1 |
| C | 9 | 188 | 500 | 6.65 | 180 | 167 | 50.1 |
| C | 7 | 111 | 497 | 6.59 | 180 | 167 | 50.1 |
| D | 11 | 82 | 446 | 6.13 | 166 | 150 | 48.3 |
| D | 1 | 3 | 439 | 5.98 | 166 | 150 | 48.3 |
| D | 3 | 14 | 438 | 5.96 | 166 | 150 | 48.3 |
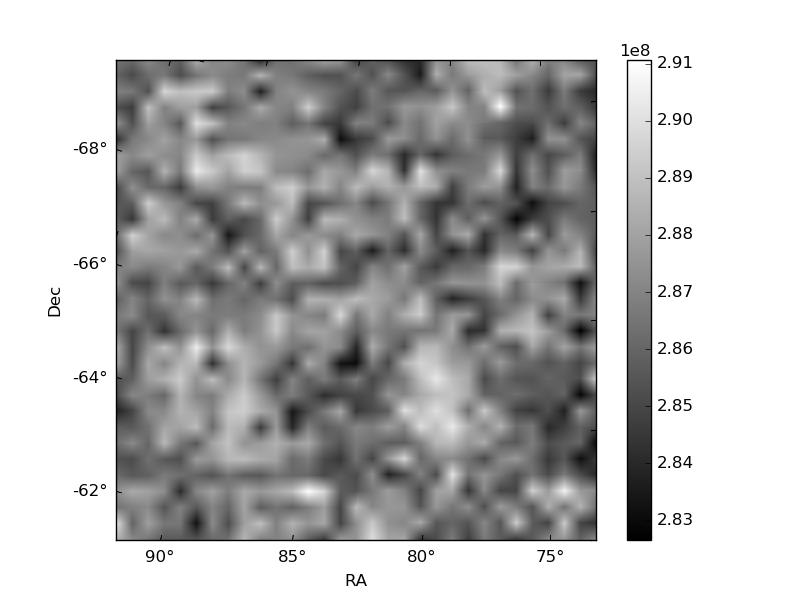
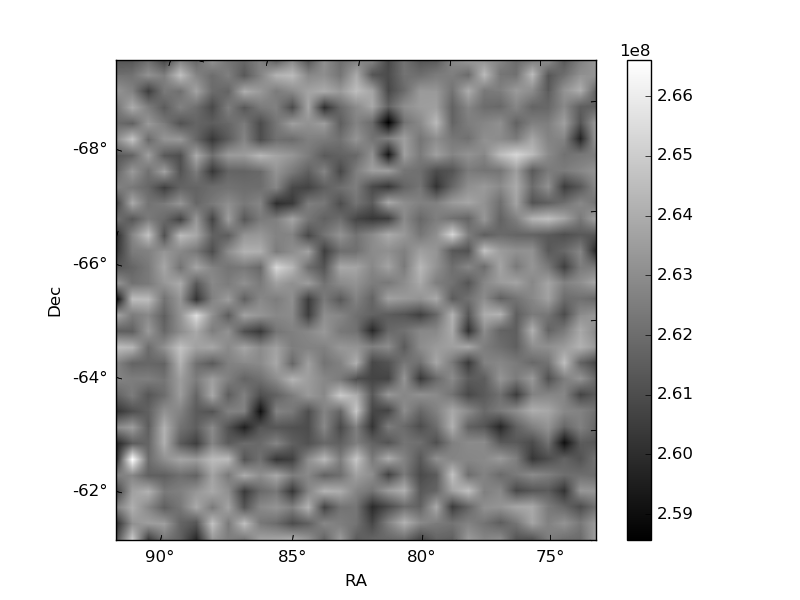
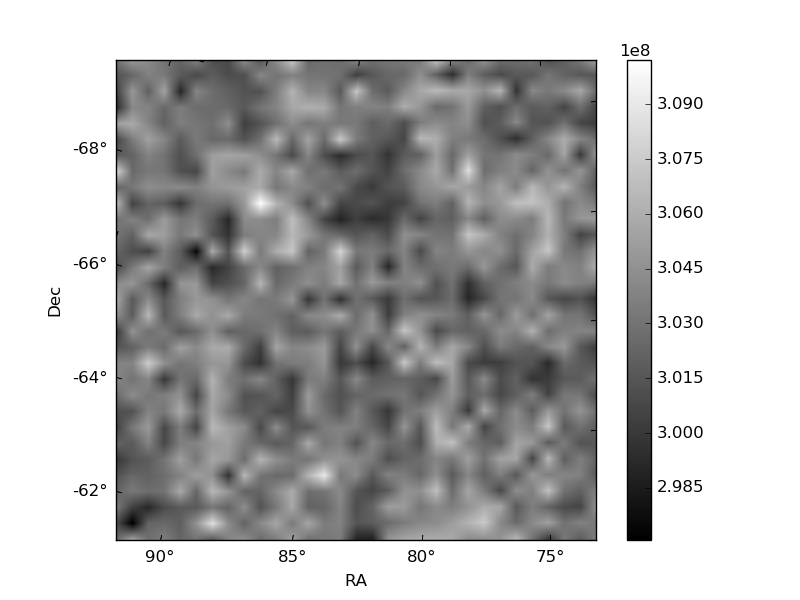
Histogram calculated using DETX and DETY for each event in the final _common_clean file
| Quadrant A | 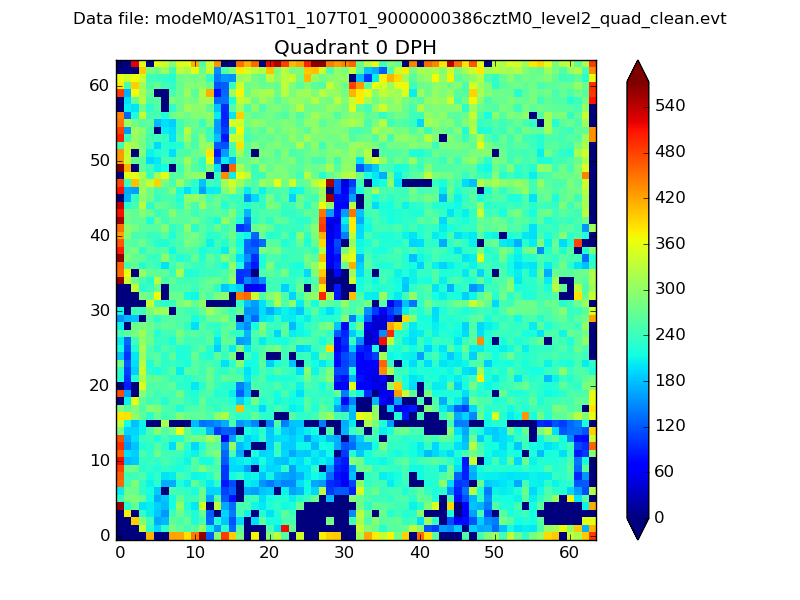 |
 |
Quadrant B |
|---|---|---|---|
| Quadrant D | 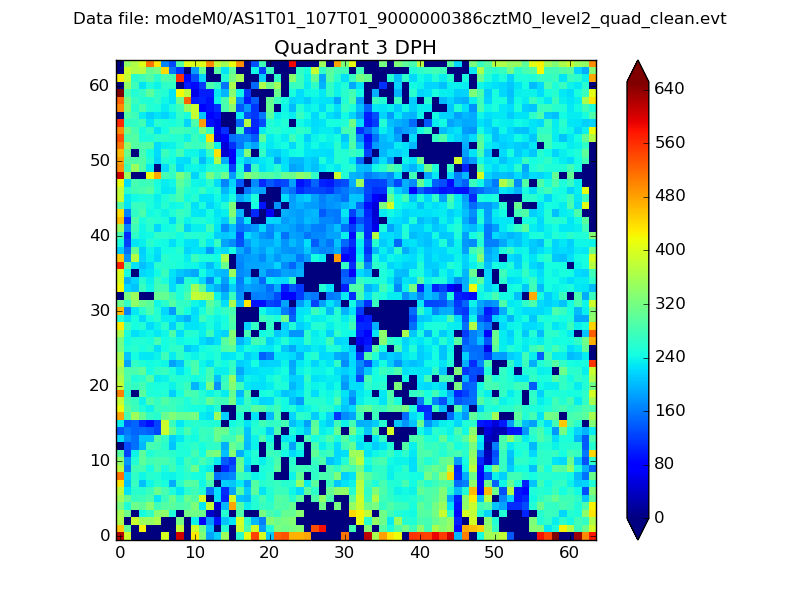 |
 |
Quadrant C |
| Plot type | Count rate plots | Images |
|---|---|---|
| Comparison with Poisson distribution Blue bars denote a histogram of data divided into 1 sec bins. Red curve is a Poisson curve with rate = median count rate of data. |
 |
 |
| Quadrant-wise count rates Data is divided into 100 sec bins |
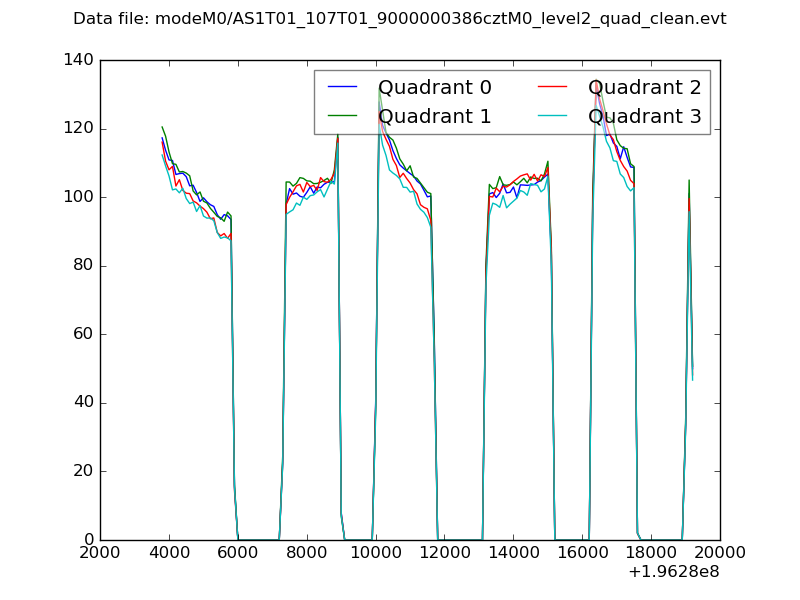 |
|
| Module-wise count rates for Quadrant A Data is divided into 100 sec bins |
 |
 |
| Module-wise count rates for Quadrant B Data is divided into 100 sec bins |
 |
 |
| Module-wise count rates for Quadrant C Data is divided into 100 sec bins |
 |
 |
| Module-wise count rates for Quadrant D Data is divided into 100 sec bins |
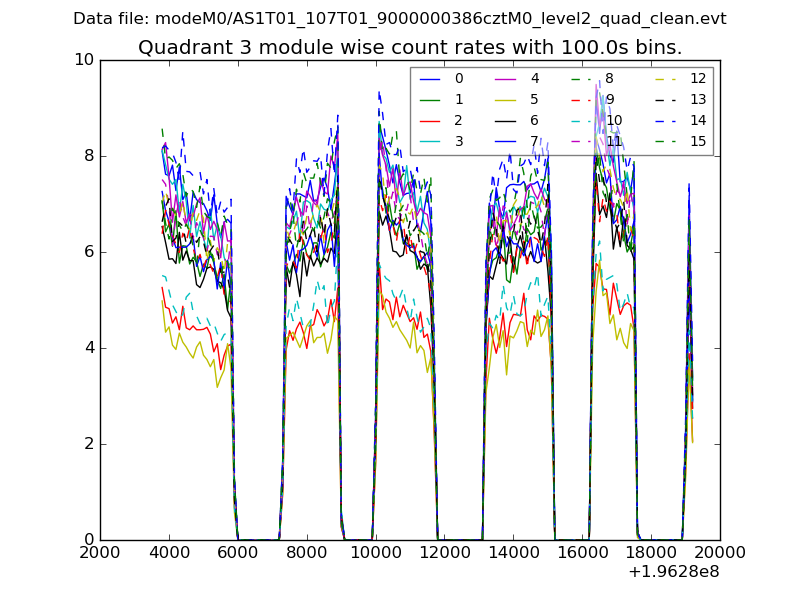 |
 |
| Parameter | Plot |
|---|---|
| CZT HV Monitor |  |
| D_VDD | 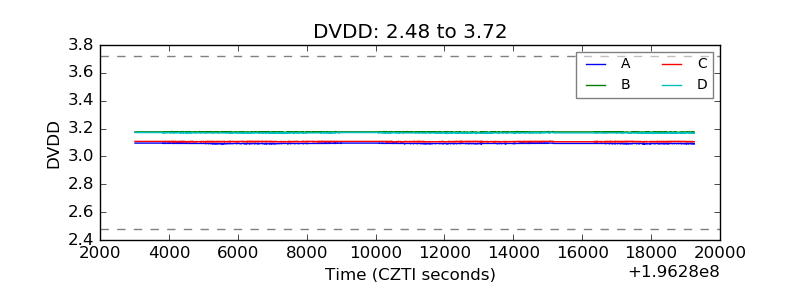 |
| Temperature 1 | 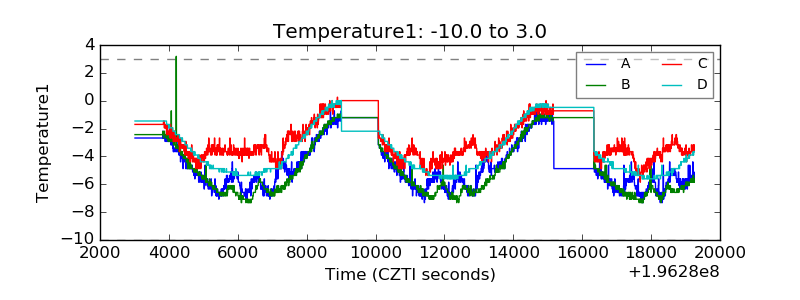 |
| Veto HV Monitor |  |
| Veto LLD | 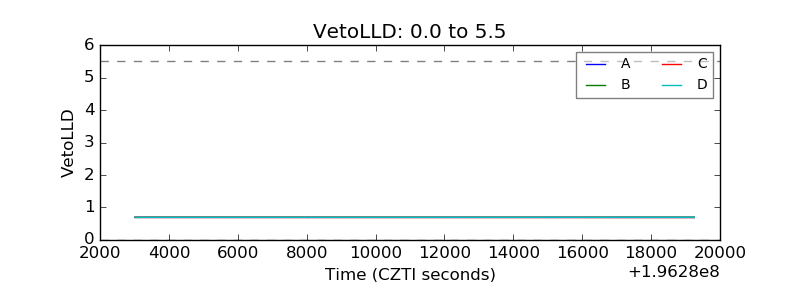 |
| Alpha Counter |  |
| _CPM_Rate |  |
| CZT Counter |  |
| +2.5 Volts monitor | 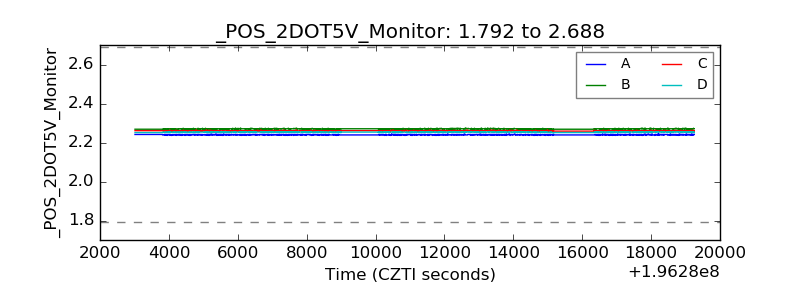 |
| +5 Volts monitor |  |
| _ROLL_ROT | 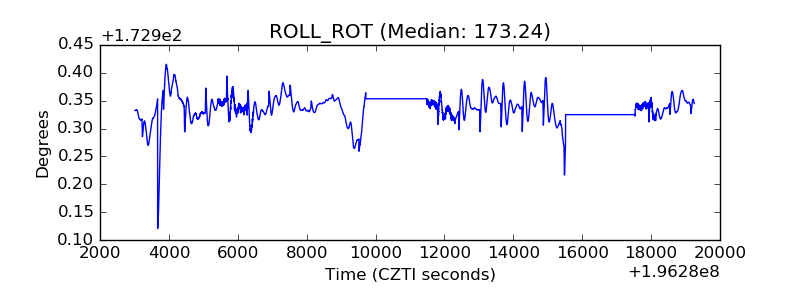 |
| _Roll_DEC |  |
| _Roll_RA |  |
| Veto Counter |  |