| Param | Original file | Final file |
|---|---|---|
| Filename | modeM0/AS1T01_107T01_9000000386_02603cztM0_level2.evt | modeM0/AS1T01_107T01_9000000386_02603cztM0_level2_quad_clean.evt |
| Size (bytes) | 384,750,720 | 83,825,280 |
| Size | 366.9 MB | 79.9 MB |
| Events in quadrant A | 2,775,989 | 528,869 |
| Events in quadrant B | 2,891,285 | 538,035 |
| Events in quadrant C | 2,722,092 | 525,340 |
| Events in quadrant D | 2,834,217 | 507,085 |
| Mode M9 | |||
|---|---|---|---|
| Quadrant | BADHDUFLAG | Total packets | Discarded packets |
| A | 0 | 15 | 0 |
| B | 0 | 15 | 0 |
| C | 0 | 15 | 0 |
| D | 0 | 16 | 0 |
| Mode M0 | |||
|---|---|---|---|
| Quadrant | BADHDUFLAG | Total packets | Discarded packets |
| A | 0 | 12834 | 3 |
| B | 0 | 12990 | 2 |
| C | 0 | 12745 | 2 |
| D | 0 | 13221 | 2 |
| Mode SS | |||
|---|---|---|---|
| Quadrant | BADHDUFLAG | Total packets | Discarded packets |
| A | 0 | 128 | 0 |
| B | 0 | 128 | 0 |
| C | 0 | 128 | 0 |
| D | 0 | 128 | 0 |
| Quadrant | Total seconds | Saturated seconds | Saturation percentage |
|---|---|---|---|
| A | 6292 | 23 | 0.365544% |
| B | 6292 | 29 | 0.460903% |
| C | 6292 | 14 | 0.222505% |
| D | 6292 | 23 | 0.365544% |
Noise dominated data is calculated using 1-second bins in cleaned event files. If a bin has >2000 counts, and if more than 50% of those come from <1% of pixels, then it is considered to be noise-dominated and hence unusable.
| Quadrant | # 1 sec bins | Bins with >0 counts | Bins with >2000 counts | High rate bins dominated by noise | Noise dominated (total time) | Noise dominated (detector-on time) | Marked lightcurve |
|---|---|---|---|---|---|---|---|
| A | 7452 | 6293 | 5 | 5 | 0.07% | 0.08% | 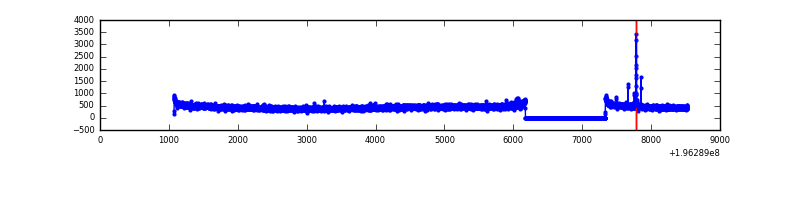 |
| B | 7452 | 6293 | 2 | 2 | 0.03% | 0.03% | 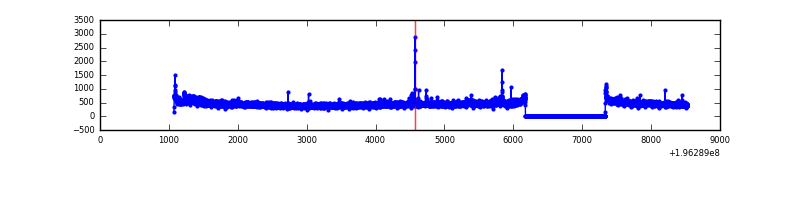 |
| C | 7452 | 6293 | 2 | 2 | 0.03% | 0.03% |  |
| D | 7452 | 6293 | 8 | 8 | 0.11% | 0.13% |  |
Top three noisy pixels from each quadrant. If the there are fewer than three noisy pixels in the level2.evt file, extra rows are filled as -1
| Pixel properties | Quadrant properties | ||||||
|---|---|---|---|---|---|---|---|
| Quadrant | DetID | PixID | Counts | Sigma | Mean | Median | Sigma |
| A | 0 | 149 | 23433 | 154.55 | 713 | 697 | 147.1 |
| A | 0 | 226 | 9860 | 62.29 | 713 | 697 | 147.1 |
| A | 12 | 194 | 7918 | 49.08 | 713 | 697 | 147.1 |
| B | 6 | 36 | 32517 | 228.85 | 729 | 711 | 139.0 |
| B | 0 | 189 | 16164 | 111.19 | 729 | 711 | 139.0 |
| B | 10 | 244 | 13835 | 94.43 | 729 | 711 | 139.0 |
| C | 12 | 4 | 8451 | 48.28 | 691 | 695 | 160.6 |
| C | 13 | 61 | 6318 | 35.0 | 691 | 695 | 160.6 |
| C | 10 | 34 | 3291 | 16.16 | 691 | 695 | 160.6 |
| D | 5 | 233 | 50993 | 310.78 | 678 | 662 | 161.9 |
| D | 2 | 136 | 44247 | 269.13 | 678 | 662 | 161.9 |
| D | 2 | 54 | 41835 | 254.23 | 678 | 662 | 161.9 |
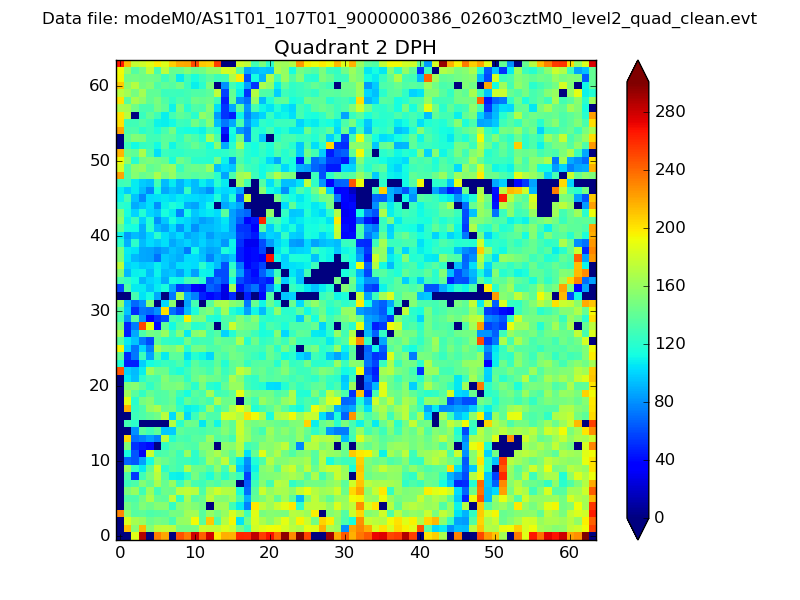
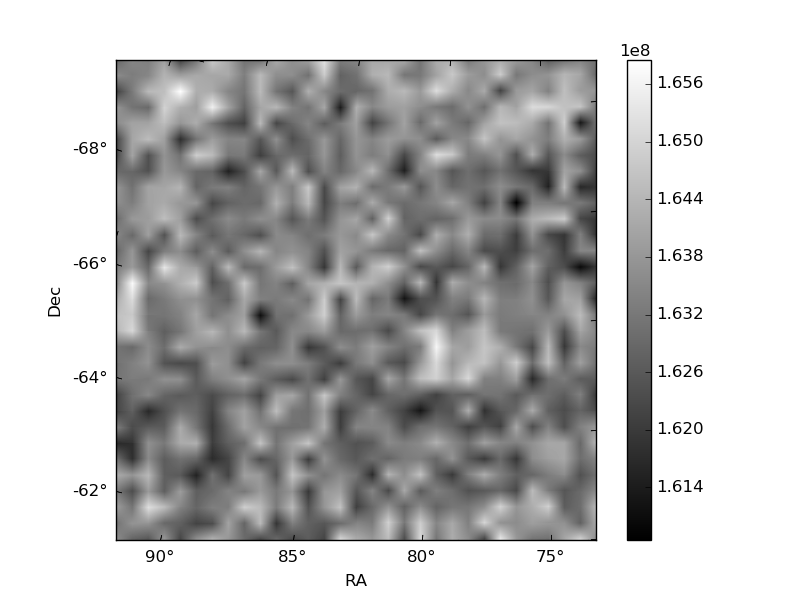
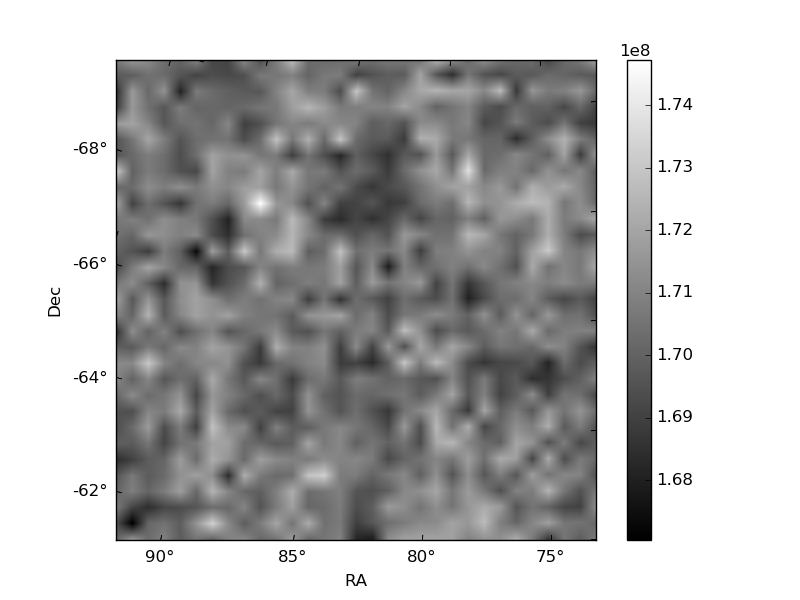
Histogram calculated using DETX and DETY for each event in the final _common_clean file
| Quadrant A | 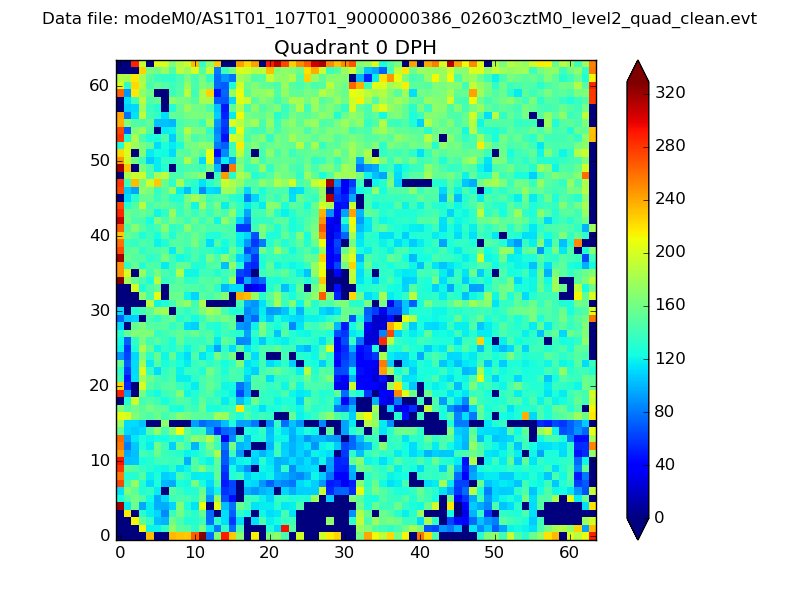 |
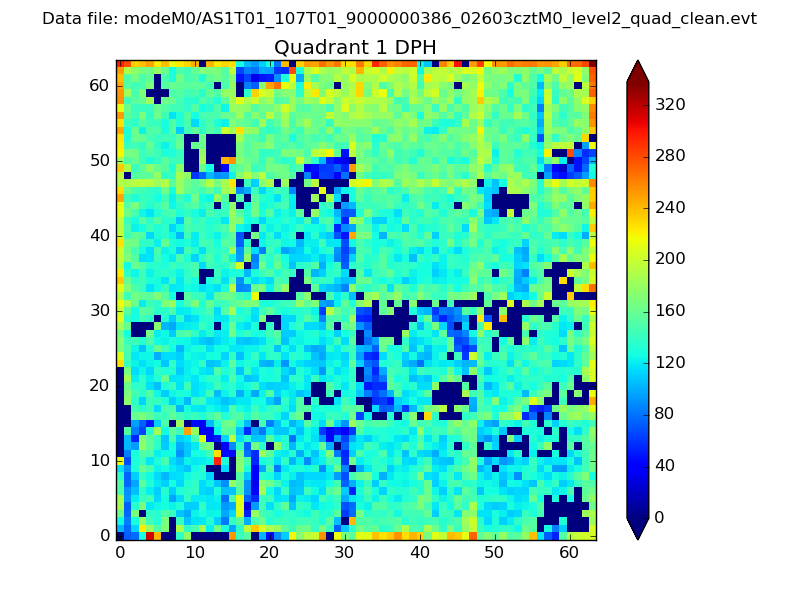 |
Quadrant B |
|---|---|---|---|
| Quadrant D | 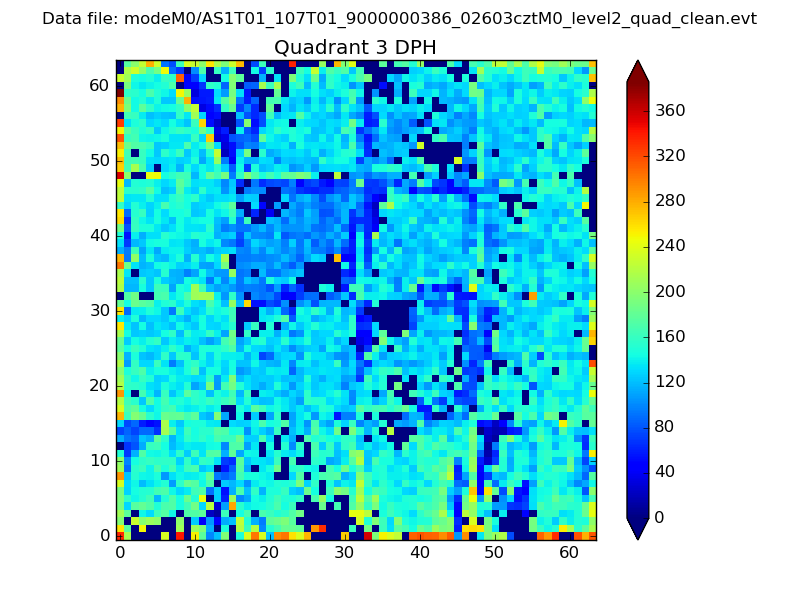 |
 |
Quadrant C |
| Plot type | Count rate plots | Images |
|---|---|---|
| Comparison with Poisson distribution Blue bars denote a histogram of data divided into 1 sec bins. Red curve is a Poisson curve with rate = median count rate of data. |
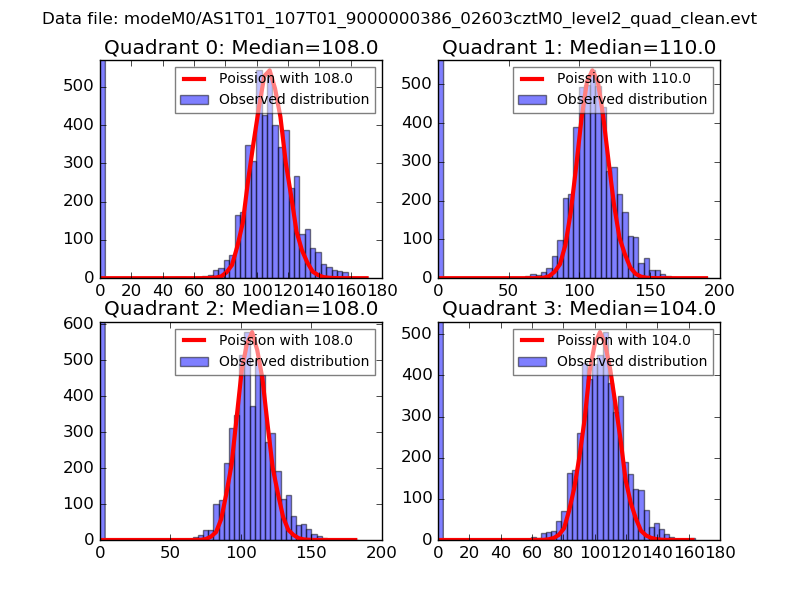 |
 |
| Quadrant-wise count rates Data is divided into 100 sec bins |
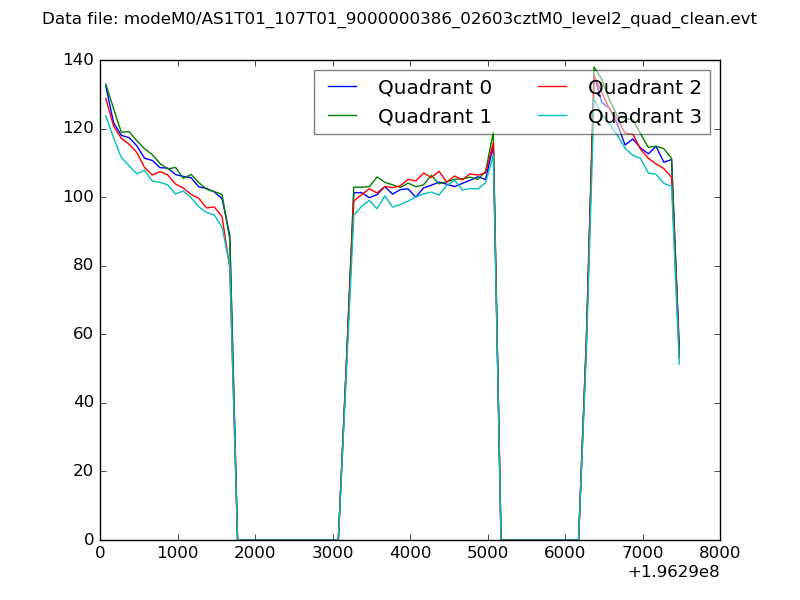 |
|
| Module-wise count rates for Quadrant A Data is divided into 100 sec bins |
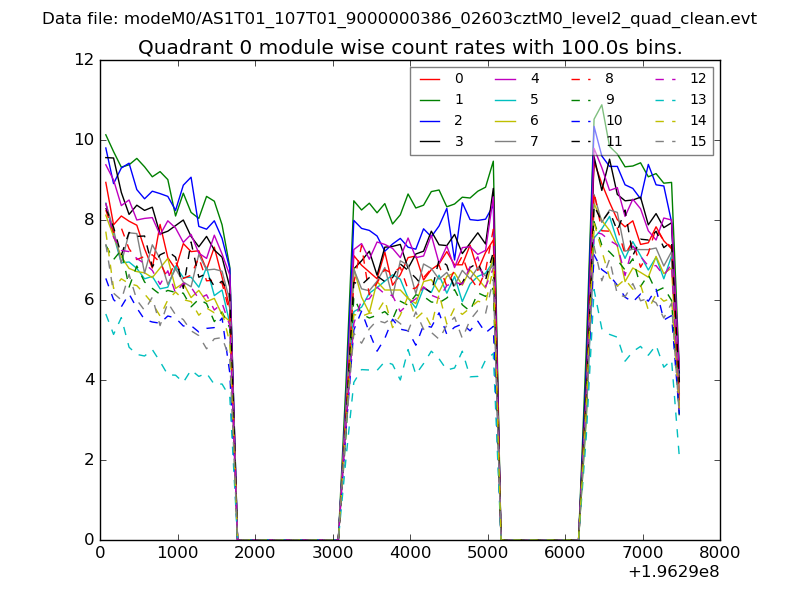 |
 |
| Module-wise count rates for Quadrant B Data is divided into 100 sec bins |
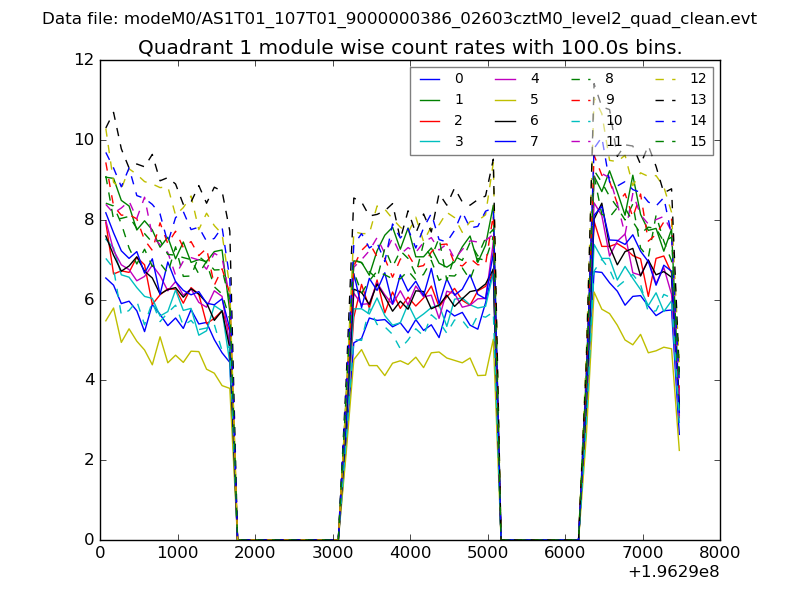 |
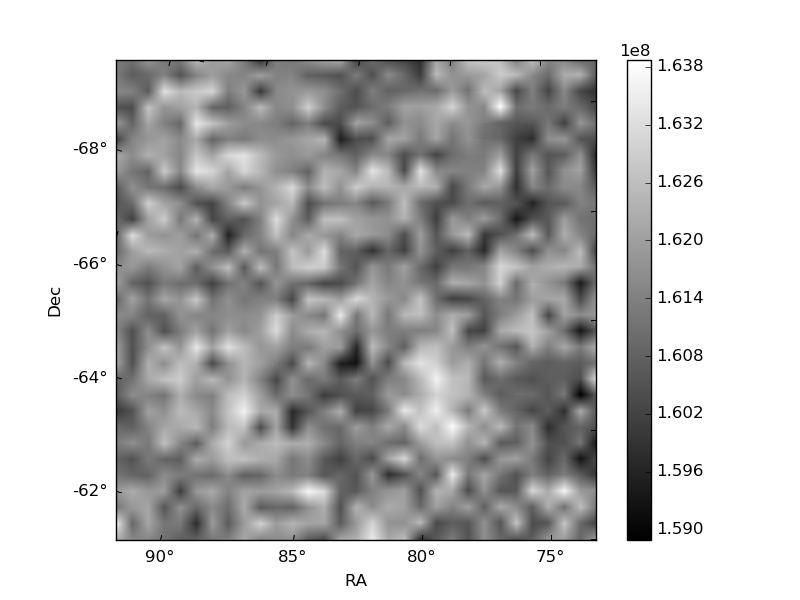 |
| Module-wise count rates for Quadrant C Data is divided into 100 sec bins |
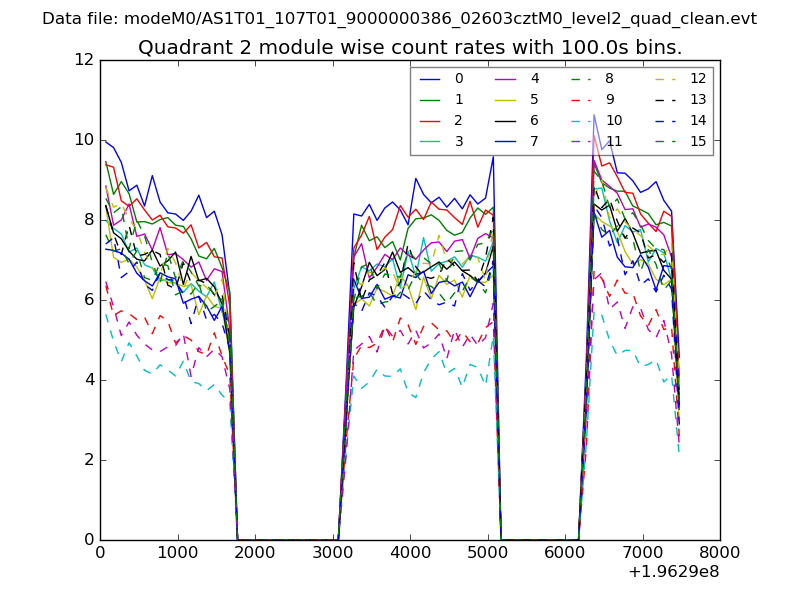 |
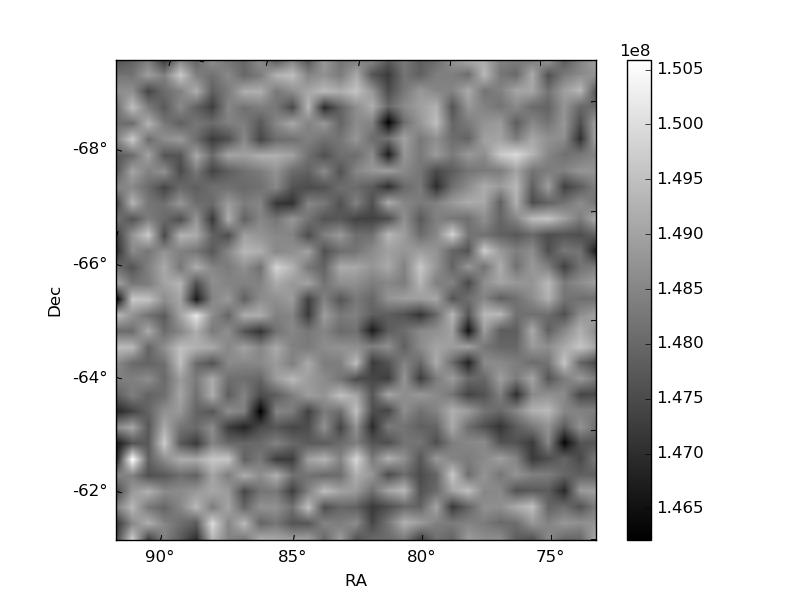 |
| Module-wise count rates for Quadrant D Data is divided into 100 sec bins |
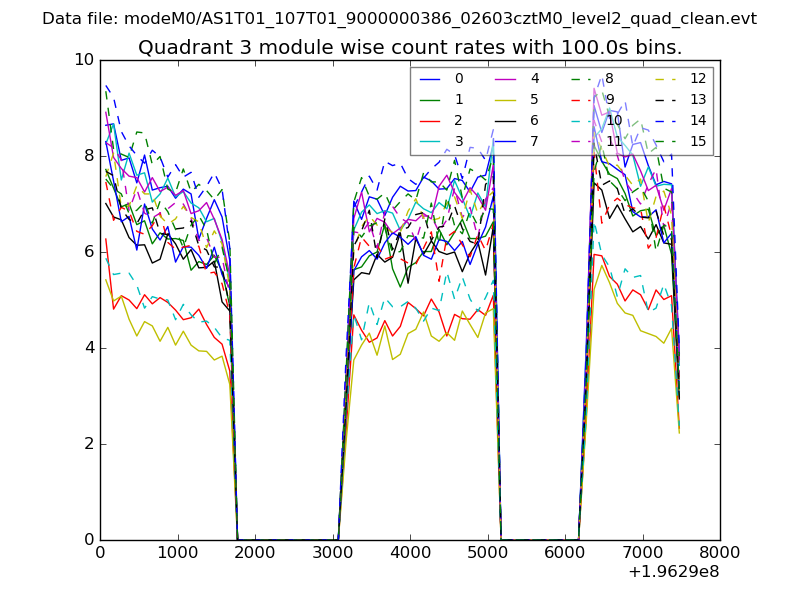 |
 |
| Parameter | Plot |
|---|---|
| CZT HV Monitor | 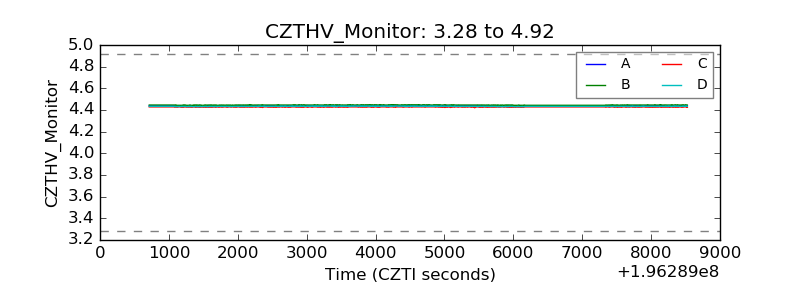 |
| D_VDD | 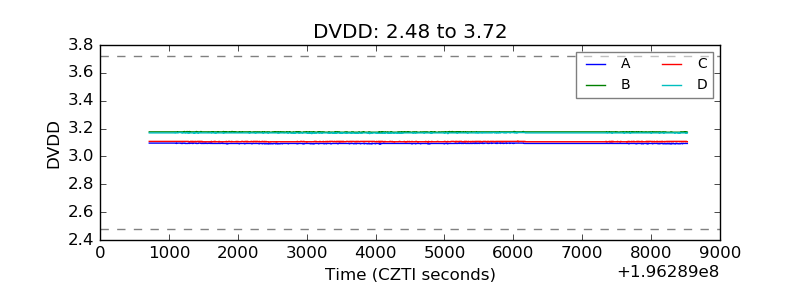 |
| Temperature 1 | 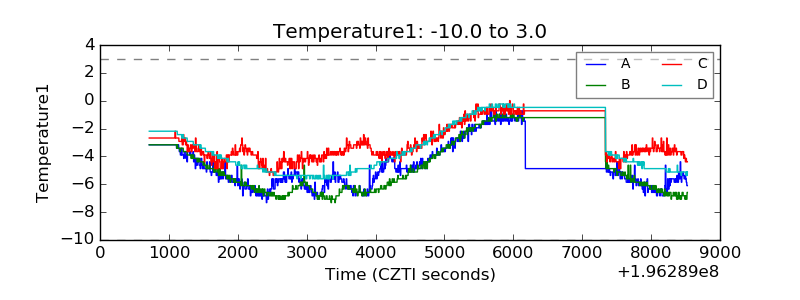 |
| Veto HV Monitor | 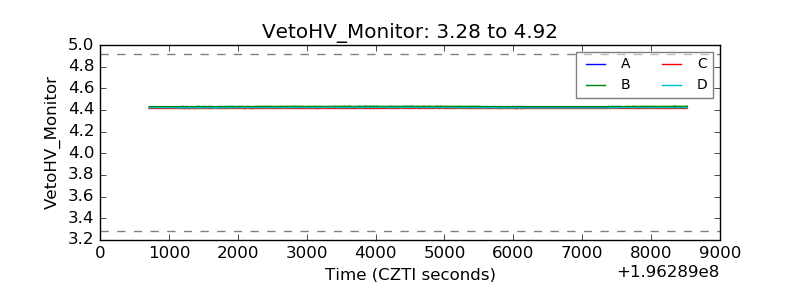 |
| Veto LLD |  |
| Alpha Counter | 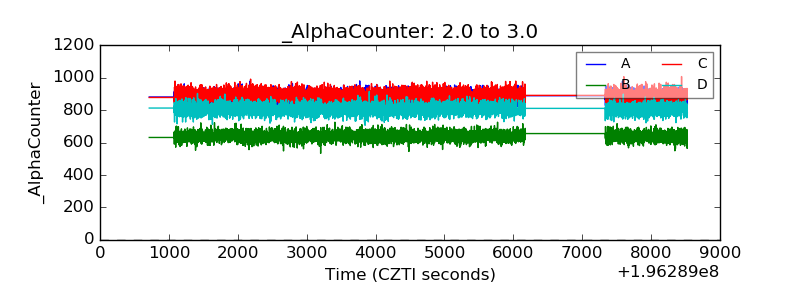 |
| _CPM_Rate | 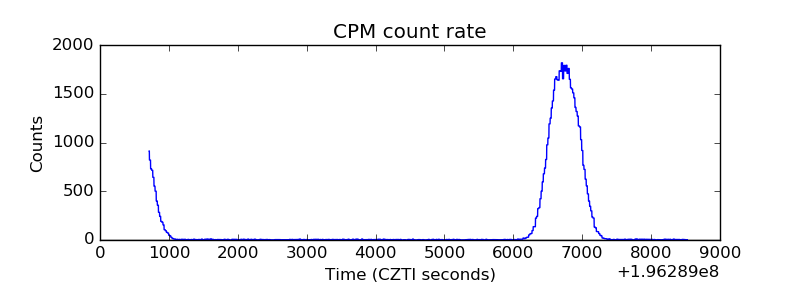 |
| CZT Counter | 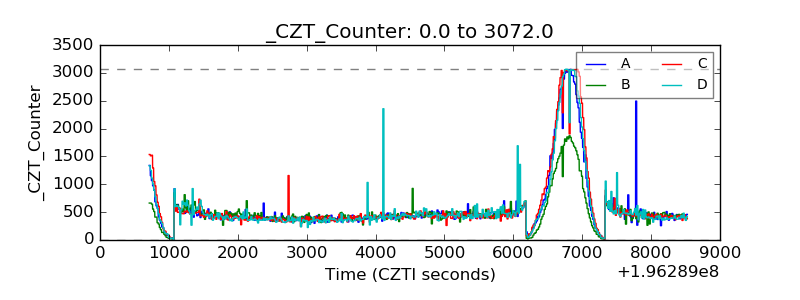 |
| +2.5 Volts monitor |  |
| +5 Volts monitor |  |
| Veto Counter | 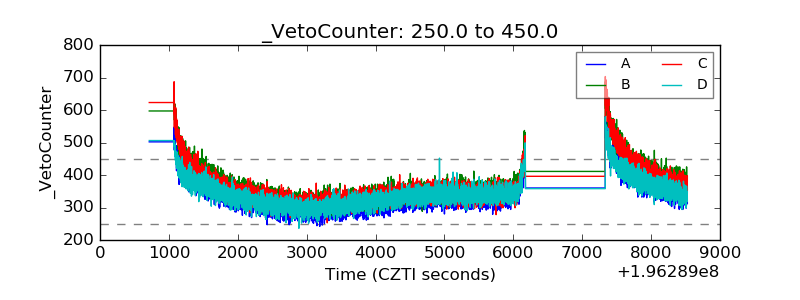 |