| Param | Original file | Final file |
|---|---|---|
| Filename | modeM0/AS1T01_107T01_9000000386_02604cztM0_level2.evt | modeM0/AS1T01_107T01_9000000386_02604cztM0_level2_quad_clean.evt |
| Size (bytes) | 195,255,360 | 29,079,360 |
| Size | 186.2 MB | 27.7 MB |
| Events in quadrant A | 1,267,478 | 168,870 |
| Events in quadrant B | 1,302,418 | 174,104 |
| Events in quadrant C | 1,896,929 | 167,387 |
| Events in quadrant D | 1,245,776 | 161,489 |
| Mode M9 | |||
|---|---|---|---|
| Quadrant | BADHDUFLAG | Total packets | Discarded packets |
| A | 0 | 8 | 0 |
| B | 0 | 8 | 0 |
| C | 0 | 8 | 0 |
| D | 0 | 9 | 0 |
| Mode M0 | |||
|---|---|---|---|
| Quadrant | BADHDUFLAG | Total packets | Discarded packets |
| A | 0 | 5965 | 1 |
| B | 0 | 5932 | 1 |
| C | 0 | 7690 | 1 |
| D | 0 | 6029 | 1 |
| Mode SS | |||
|---|---|---|---|
| Quadrant | BADHDUFLAG | Total packets | Discarded packets |
| A | 0 | 58 | 0 |
| B | 0 | 58 | 0 |
| C | 0 | 58 | 0 |
| D | 0 | 58 | 0 |
| Quadrant | Total seconds | Saturated seconds | Saturation percentage |
|---|---|---|---|
| A | 2919 | 12 | 0.411100% |
| B | 2919 | 4 | 0.137033% |
| C | 2919 | 163 | 5.584104% |
| D | 2919 | 8 | 0.274066% |
Noise dominated data is calculated using 1-second bins in cleaned event files. If a bin has >2000 counts, and if more than 50% of those come from <1% of pixels, then it is considered to be noise-dominated and hence unusable.
| Quadrant | # 1 sec bins | Bins with >0 counts | Bins with >2000 counts | High rate bins dominated by noise | Noise dominated (total time) | Noise dominated (detector-on time) | Marked lightcurve |
|---|---|---|---|---|---|---|---|
| A | 2919 | 2919 | 5 | 5 | 0.17% | 0.17% | 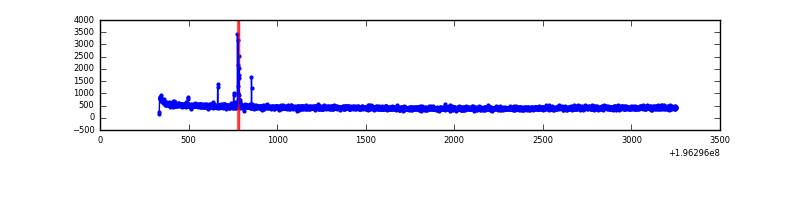 |
| B | 2919 | 2919 | 0 | 0 | 0.00% | 0.00% | 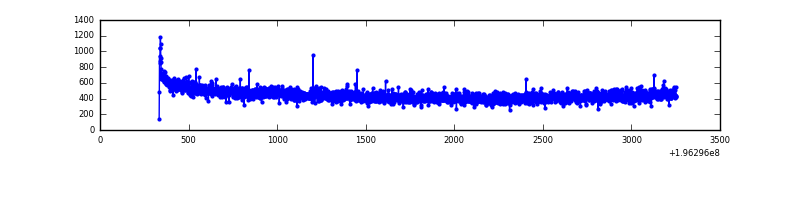 |
| C | 2919 | 2919 | 146 | 146 | 5.00% | 5.00% | 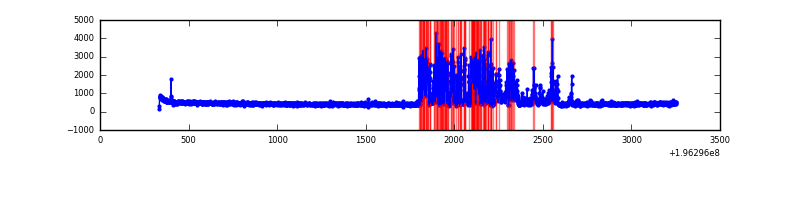 |
| D | 2919 | 2919 | 1 | 1 | 0.03% | 0.03% | 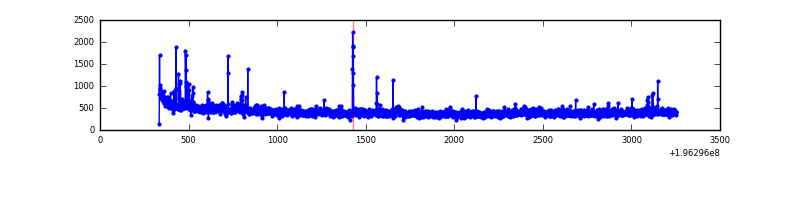 |
Top three noisy pixels from each quadrant. If the there are fewer than three noisy pixels in the level2.evt file, extra rows are filled as -1
| Pixel properties | Quadrant properties | ||||||
|---|---|---|---|---|---|---|---|
| Quadrant | DetID | PixID | Counts | Sigma | Mean | Median | Sigma |
| A | 0 | 149 | 23137 | 341.04 | 321 | 314 | 66.9 |
| A | 0 | 226 | 5647 | 79.69 | 321 | 314 | 66.9 |
| A | 12 | 194 | 3559 | 48.49 | 321 | 314 | 66.9 |
| B | 0 | 189 | 17982 | 279.26 | 332 | 325 | 63.2 |
| B | 12 | 111 | 4462 | 65.42 | 332 | 325 | 63.2 |
| B | 11 | 111 | 3796 | 54.89 | 332 | 325 | 63.2 |
| C | 2 | 53 | 674284 | 9227.72 | 311 | 312 | 73.0 |
| C | 13 | 61 | 2877 | 35.12 | 311 | 312 | 73.0 |
| C | 12 | 144 | 2127 | 24.85 | 311 | 312 | 73.0 |
| D | 5 | 233 | 18214 | 243.89 | 306 | 299 | 73.5 |
| D | 2 | 136 | 14155 | 188.63 | 306 | 299 | 73.5 |
| D | 2 | 14 | 11952 | 158.64 | 306 | 299 | 73.5 |
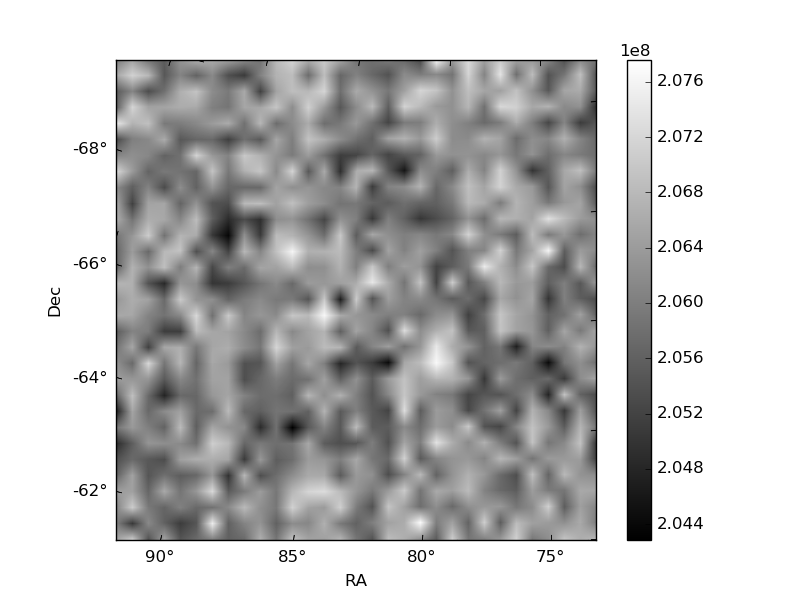
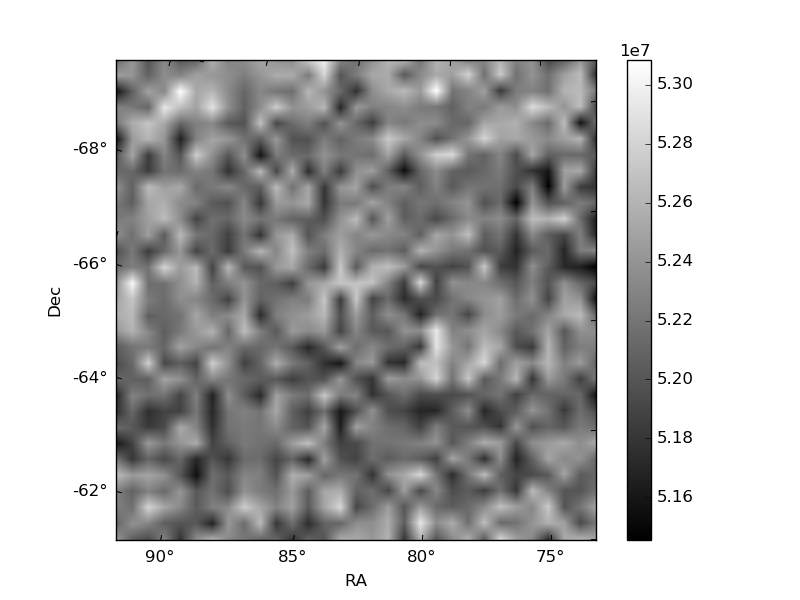
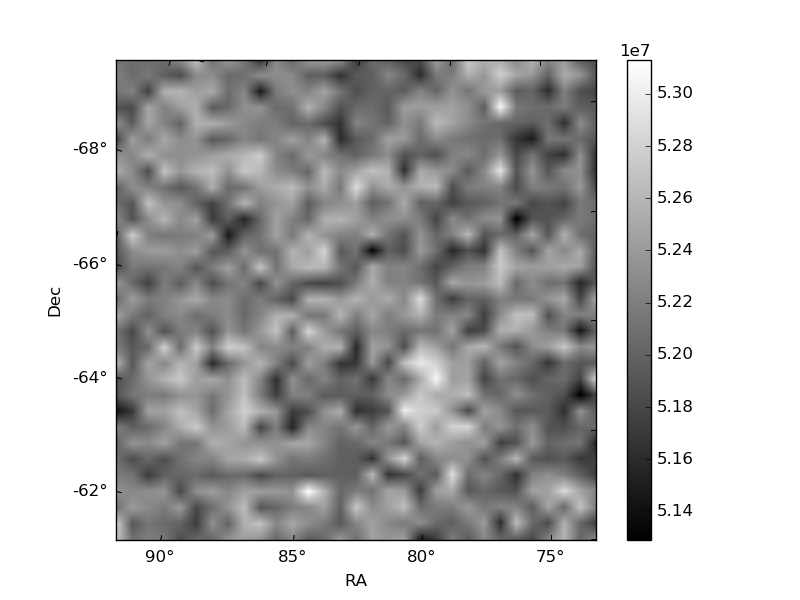
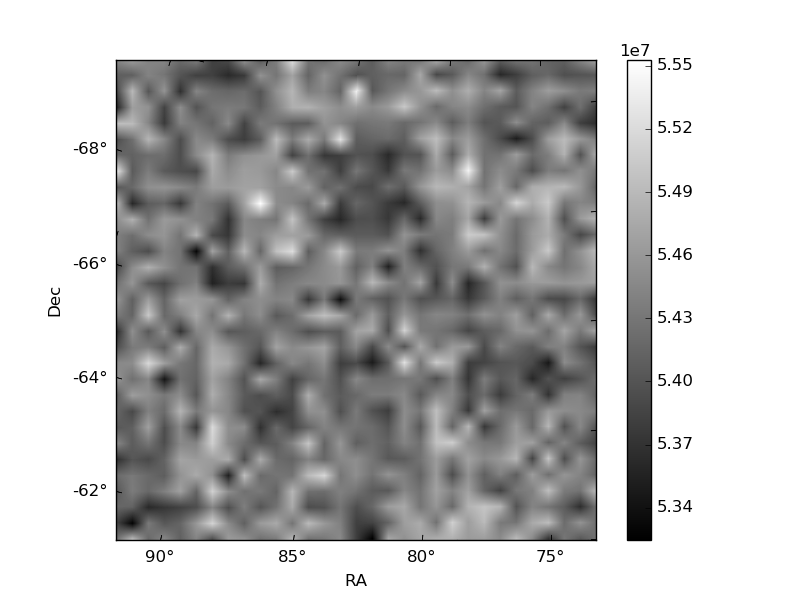
Histogram calculated using DETX and DETY for each event in the final _common_clean file
| Quadrant A | 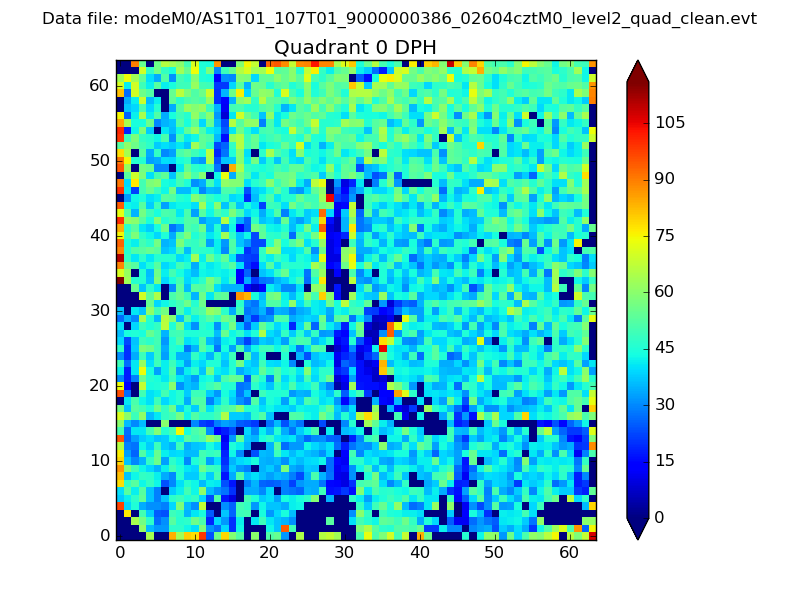 |
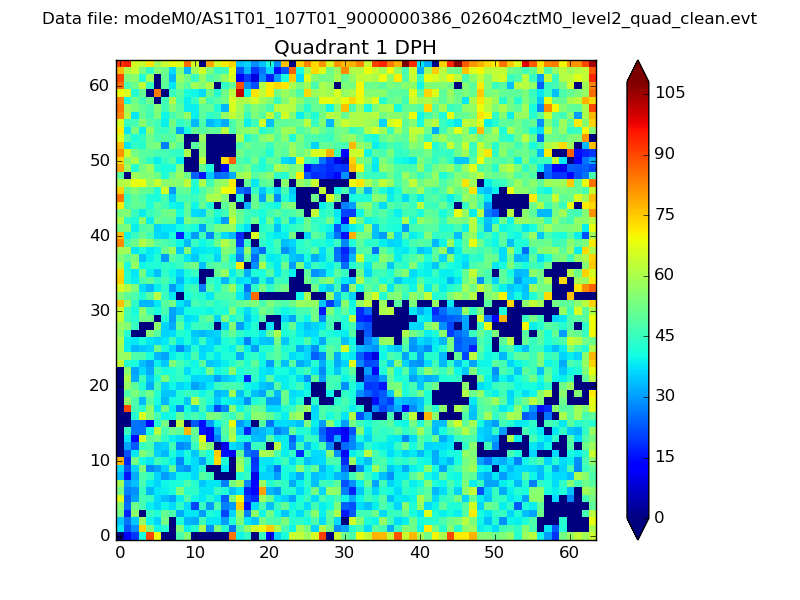 |
Quadrant B |
|---|---|---|---|
| Quadrant D | 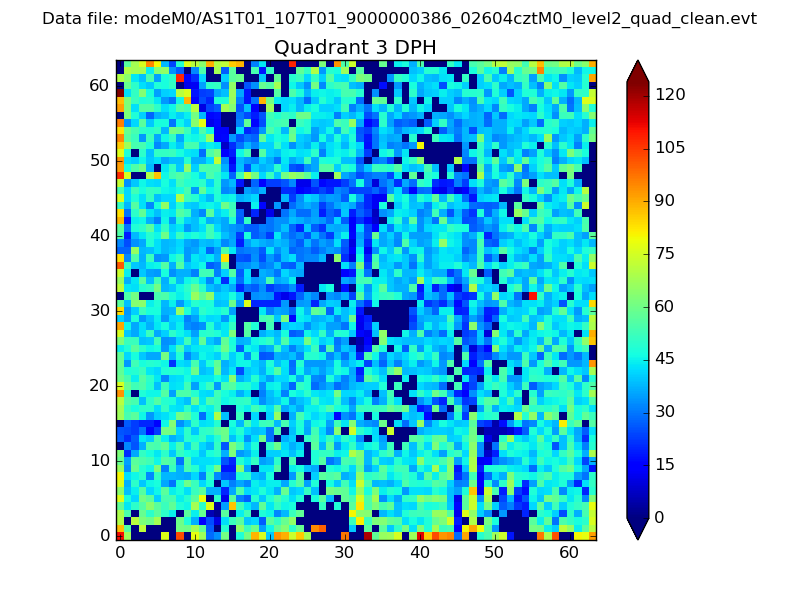 |
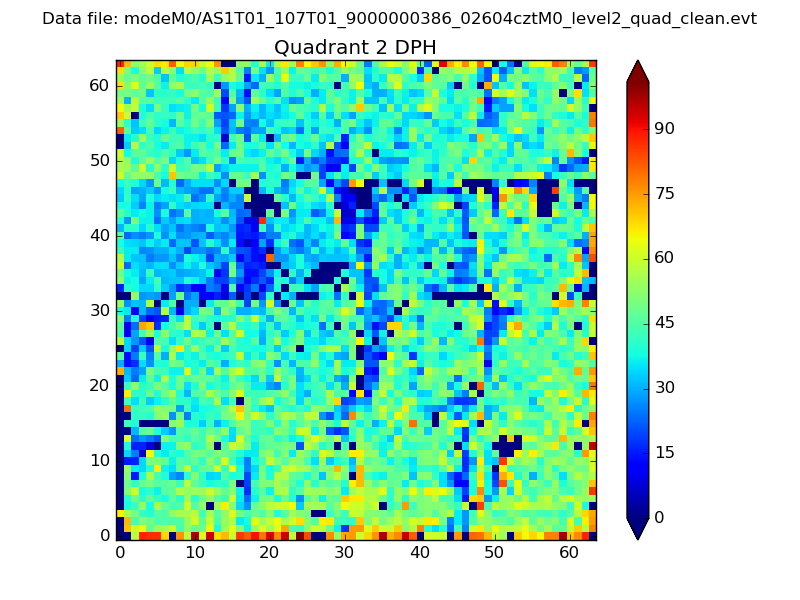 |
Quadrant C |
| Plot type | Count rate plots | Images |
|---|---|---|
| Comparison with Poisson distribution Blue bars denote a histogram of data divided into 1 sec bins. Red curve is a Poisson curve with rate = median count rate of data. |
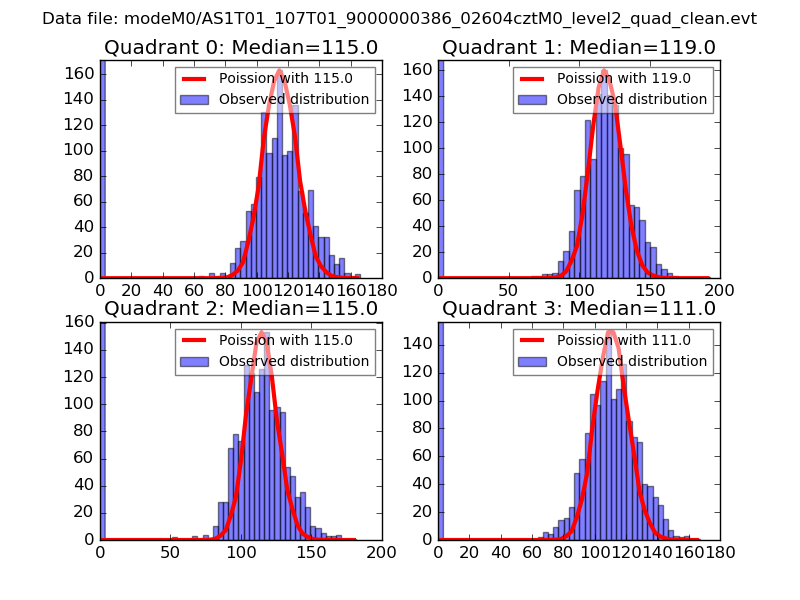 |
 |
| Quadrant-wise count rates Data is divided into 100 sec bins |
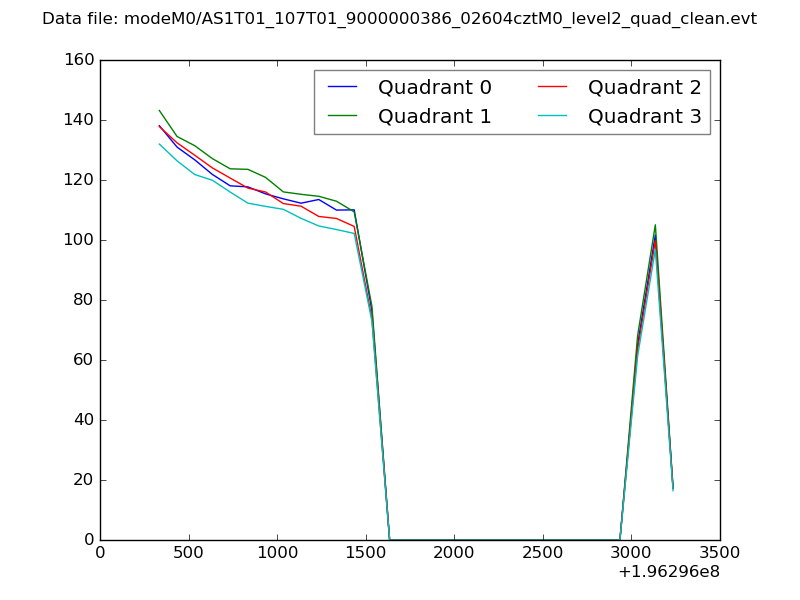 |
|
| Module-wise count rates for Quadrant A Data is divided into 100 sec bins |
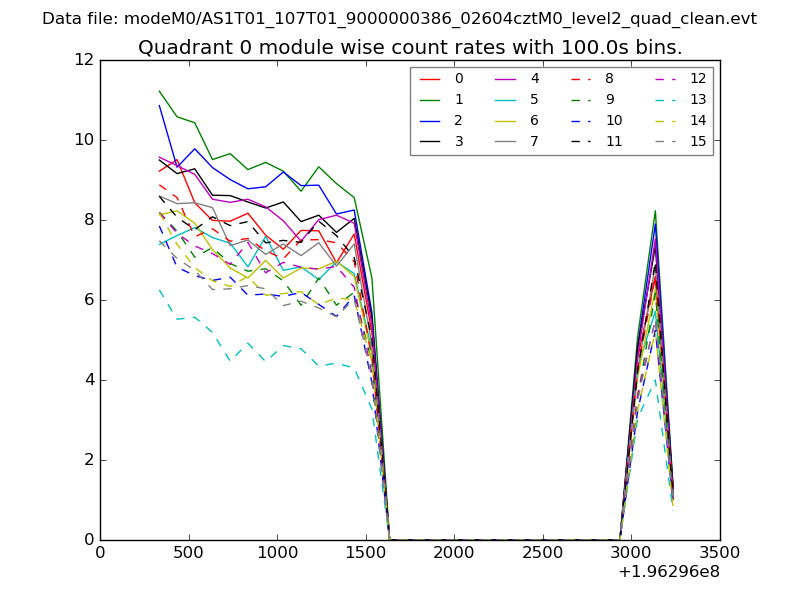 |
 |
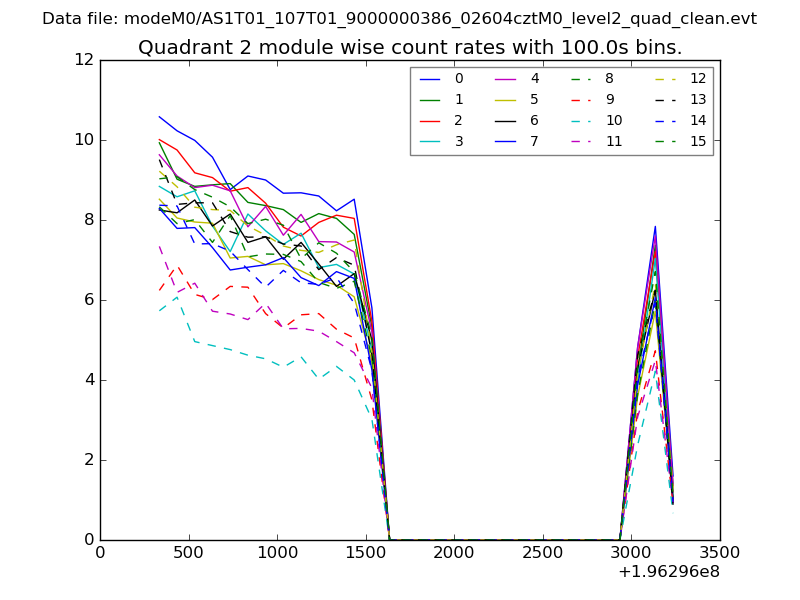
| Module-wise count rates for Quadrant B Data is divided into 100 sec bins |
 |
 |
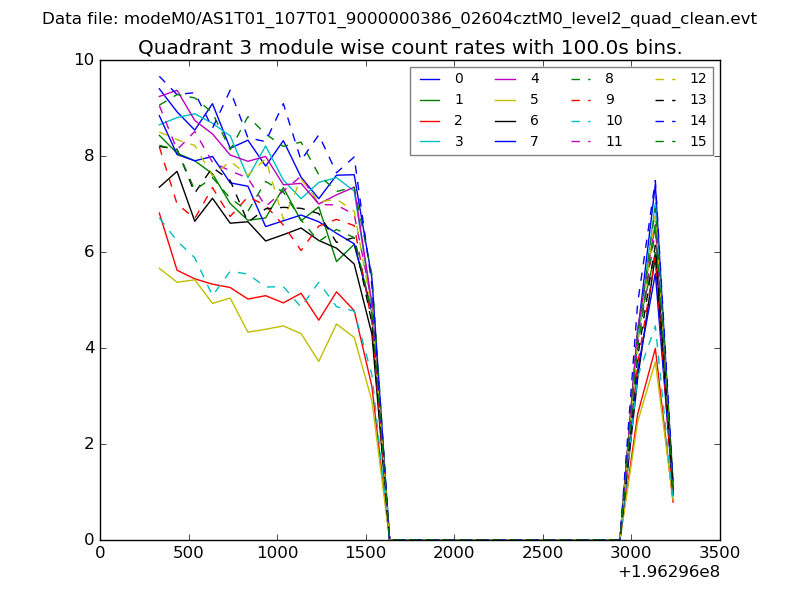
| Module-wise count rates for Quadrant C Data is divided into 100 sec bins |
 |
 |
| Module-wise count rates for Quadrant D Data is divided into 100 sec bins |
 |
 |
| Parameter | Plot |
|---|---|
| CZT HV Monitor | 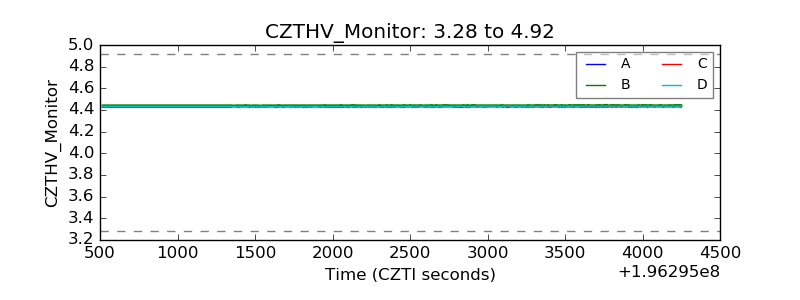 |
| D_VDD |  |
| Temperature 1 | 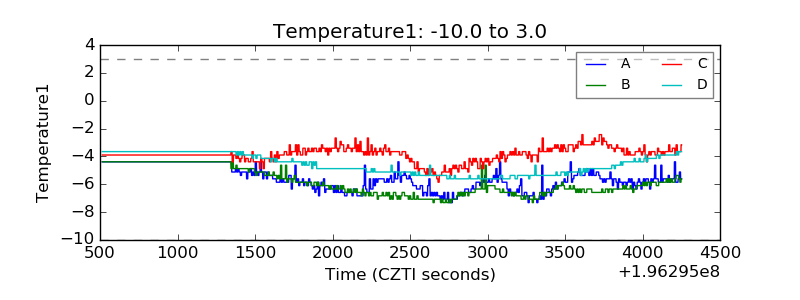 |
| Veto HV Monitor | 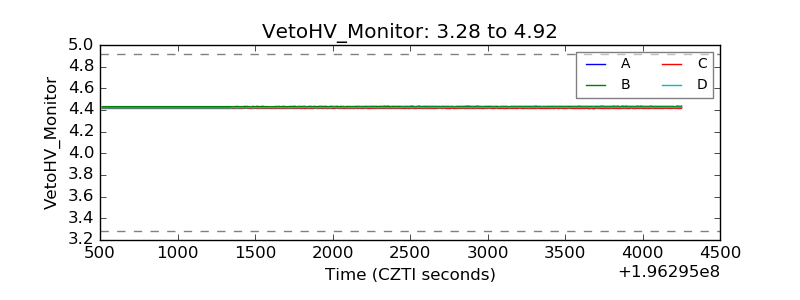 |
| Veto LLD | 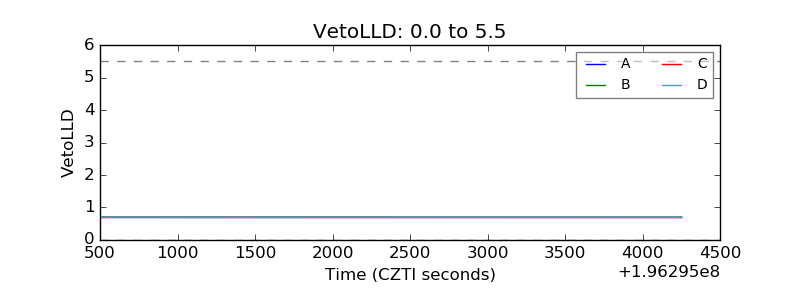 |
| Alpha Counter | 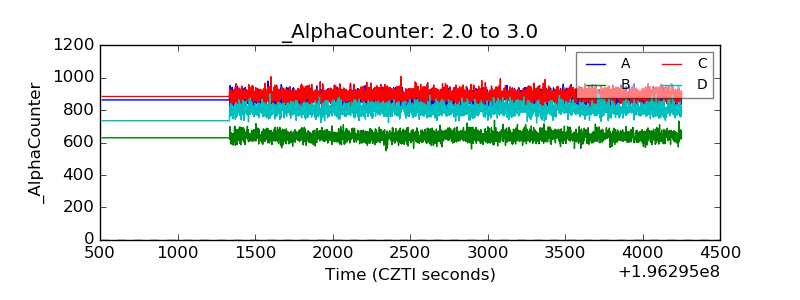 |
| _CPM_Rate | 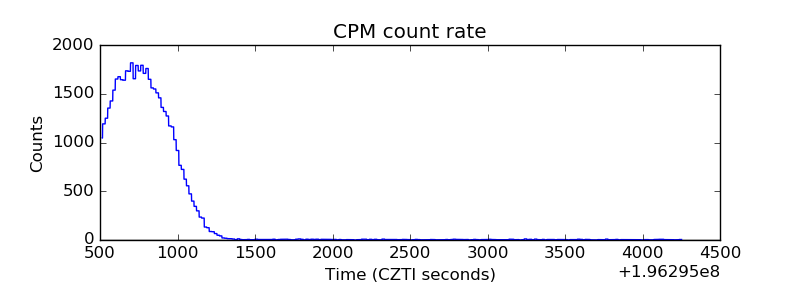 |
| CZT Counter | 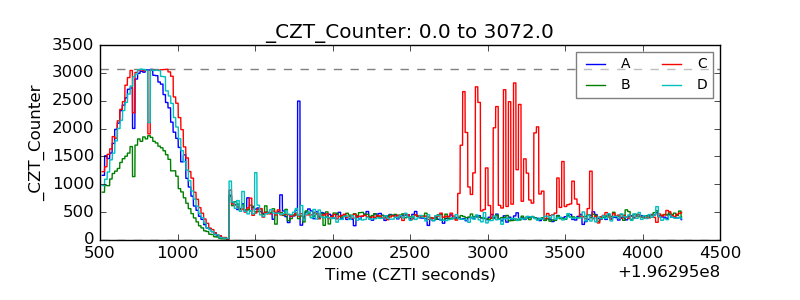 |
| +2.5 Volts monitor |  |
| +5 Volts monitor |  |
| Veto Counter | 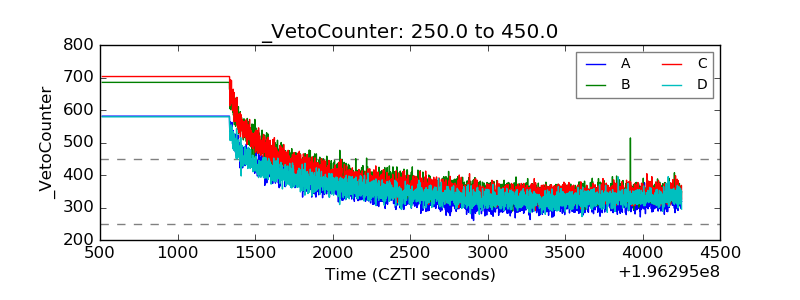 |