| Param | Original file | Final file |
|---|---|---|
| Filename | modeM0/AS1T01_034T01_9000000392cztM0_level2.fits | modeM0/AS1T01_034T01_9000000392cztM0_level2_quad_clean.evt |
| Size (bytes) | 203,031,360 | 320,653,440 |
| Size | 193.6 MB | 305.8 MB |
| Events in quadrant A | 1,187,374 | 2,048,143 |
| Events in quadrant B | 1,168,086 | 2,105,569 |
| Events in quadrant C | 1,191,124 | 2,074,458 |
| Events in quadrant D | 1,006,080 | 1,887,861 |
| Mode M9 | |||
|---|---|---|---|
| Quadrant | BADHDUFLAG | Total packets | Discarded packets |
| A | 0 | 42 | 0 |
| B | 0 | 42 | 0 |
| C | 0 | 42 | 0 |
| D | 0 | 42 | 0 |
| Mode SS | |||
|---|---|---|---|
| Quadrant | BADHDUFLAG | Total packets | Discarded packets |
| A | 0 | 472 | 0 |
| B | 0 | 472 | 0 |
| C | 0 | 472 | 0 |
| D | 0 | 472 | 0 |
| Mode M0 | |||
|---|---|---|---|
| Quadrant | BADHDUFLAG | Total packets | Discarded packets |
| A | 0 | 46865 | 0 |
| B | 0 | 47604 | 0 |
| C | 0 | 50275 | 0 |
| D | 0 | 50942 | 0 |
| Quadrant | Total seconds | Saturated seconds | Saturation percentage |
|---|---|---|---|
| A | 23196 | 83 | 0.357820% |
| B | 23196 | 111 | 0.478531% |
| C | 23196 | 235 | 1.013106% |
| D | 23196 | 270 | 1.163994% |
Noise dominated data is calculated using 1-second bins in cleaned event files. If a bin has >2000 counts, and if more than 50% of those come from <1% of pixels, then it is considered to be noise-dominated and hence unusable.
| Quadrant | # 1 sec bins | Bins with >0 counts | Bins with >2000 counts | High rate bins dominated by noise | Noise dominated (total time) | Noise dominated (detector-on time) | Marked lightcurve |
|---|---|---|---|---|---|---|---|
| A | 27453 | 23197 | 0 | 0 | 0.00% | 0.00% | 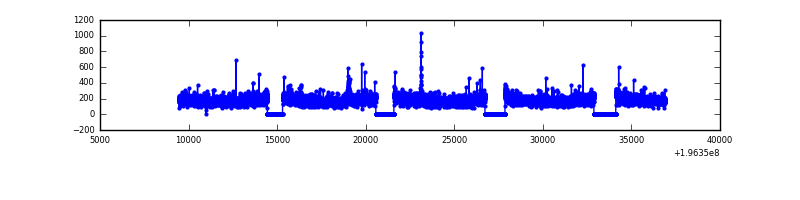 |
| B | 27453 | 23197 | 0 | 0 | 0.00% | 0.00% | 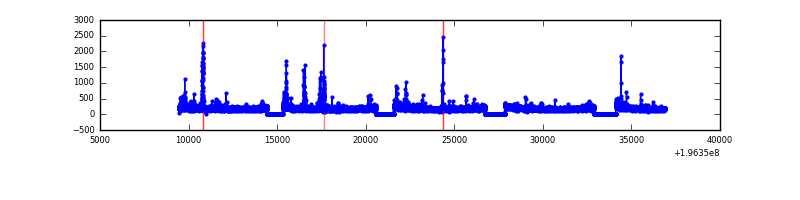 |
| C | 27453 | 23196 | 0 | 0 | 0.00% | 0.00% | 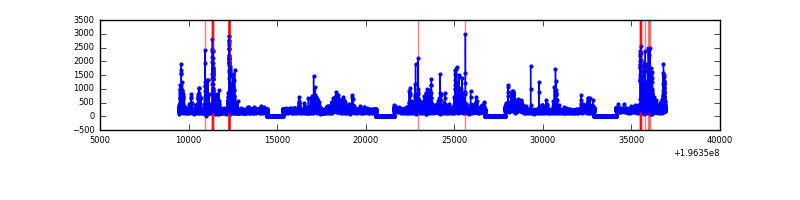 |
| D | 27453 | 23197 | 0 | 0 | 0.00% | 0.00% | 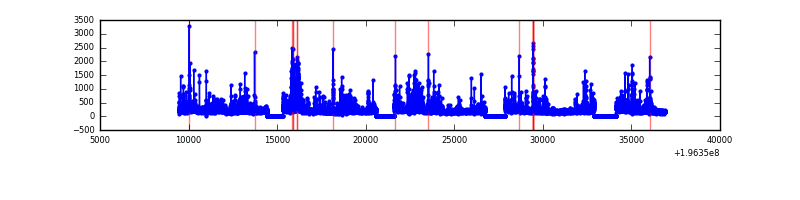 |
Top three noisy pixels from each quadrant. If the there are fewer than three noisy pixels in the level2.evt file, extra rows are filled as -1
| Pixel properties | Quadrant properties | ||||||
|---|---|---|---|---|---|---|---|
| Quadrant | DetID | PixID | Counts | Sigma | Mean | Median | Sigma |
| A | 0 | 29 | 1146 | 10.29 | 308 | 288 | 83.4 |
| A | 7 | 110 | 1049 | 9.12 | 308 | 288 | 83.4 |
| A | 14 | 79 | 911 | 7.47 | 308 | 288 | 83.4 |
| B | 2 | 9 | 1010 | 11.66 | 308 | 294 | 61.4 |
| B | 12 | 226 | 903 | 9.92 | 308 | 294 | 61.4 |
| B | 5 | 128 | 847 | 9.0 | 308 | 294 | 61.4 |
| C | 7 | 111 | 878 | 6.68 | 315 | 293 | 87.5 |
| C | 9 | 188 | 817 | 5.99 | 315 | 293 | 87.5 |
| C | 2 | 191 | 809 | 5.9 | 315 | 293 | 87.5 |
| D | 6 | 231 | 763 | 6.27 | 287 | 261 | 80.1 |
| D | 4 | 160 | 757 | 6.19 | 287 | 261 | 80.1 |
| D | 6 | 44 | 756 | 6.18 | 287 | 261 | 80.1 |
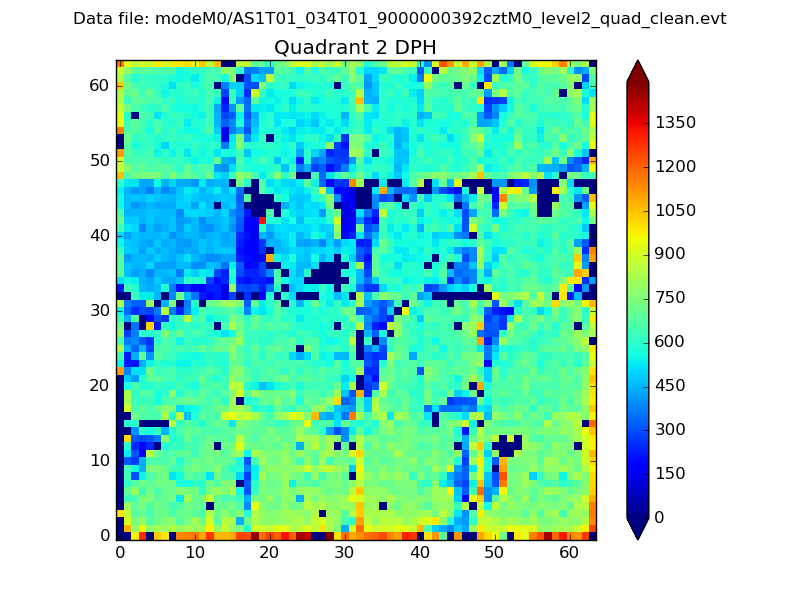
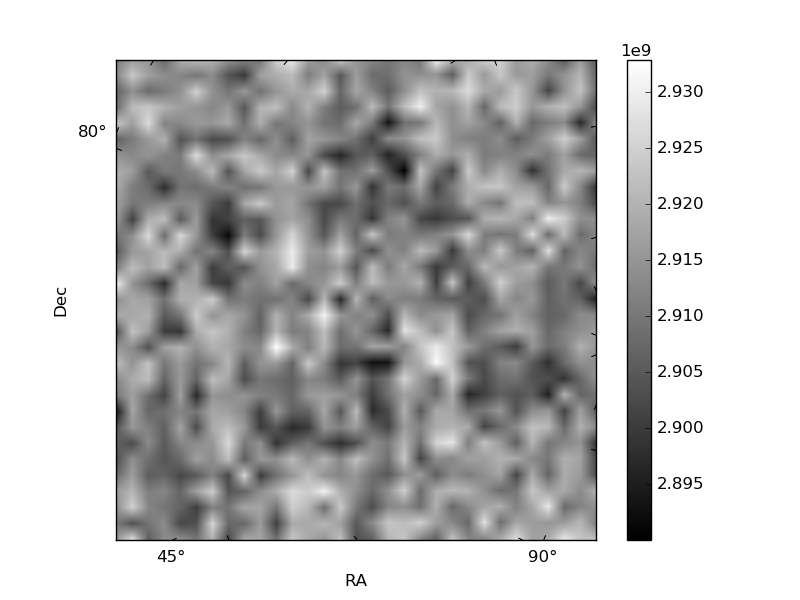
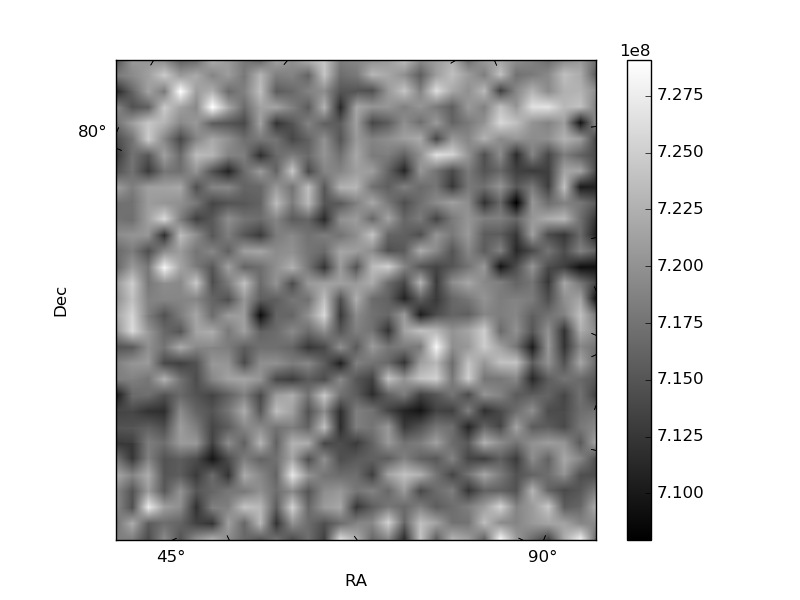
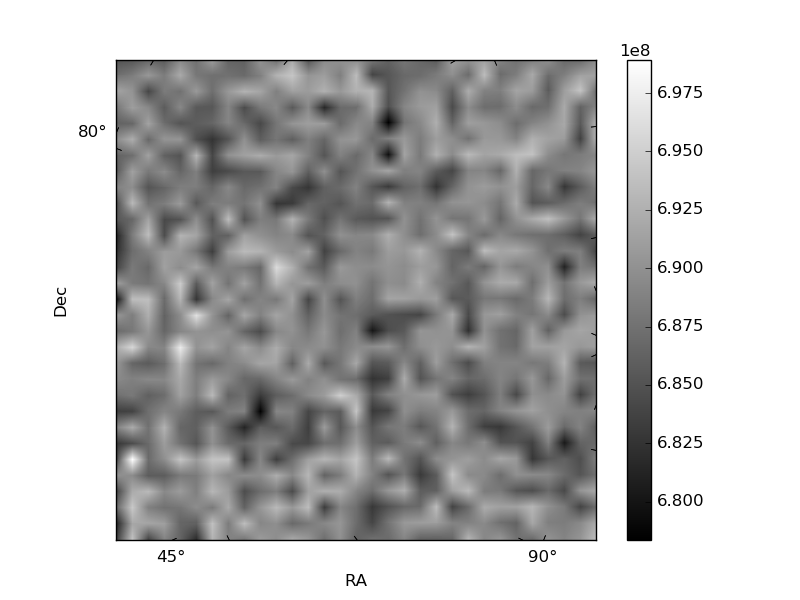
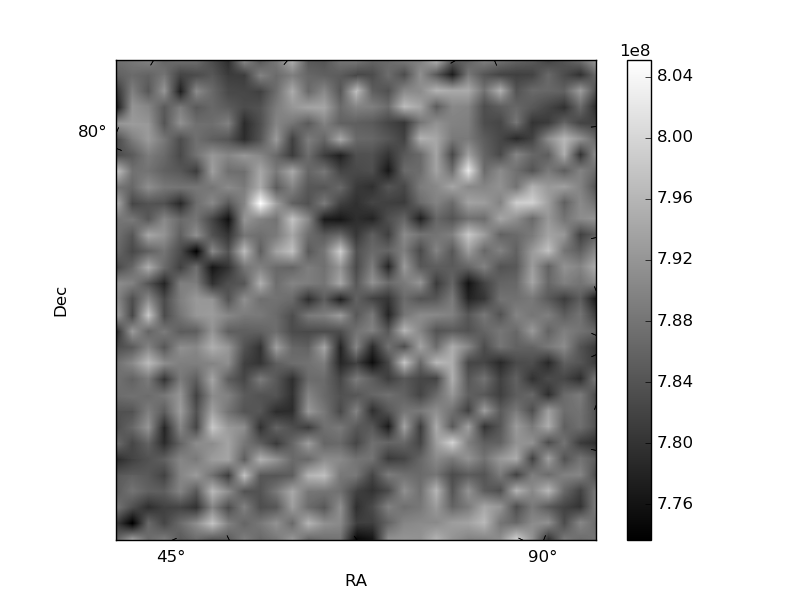
Histogram calculated using DETX and DETY for each event in the final _common_clean file
| Quadrant A | 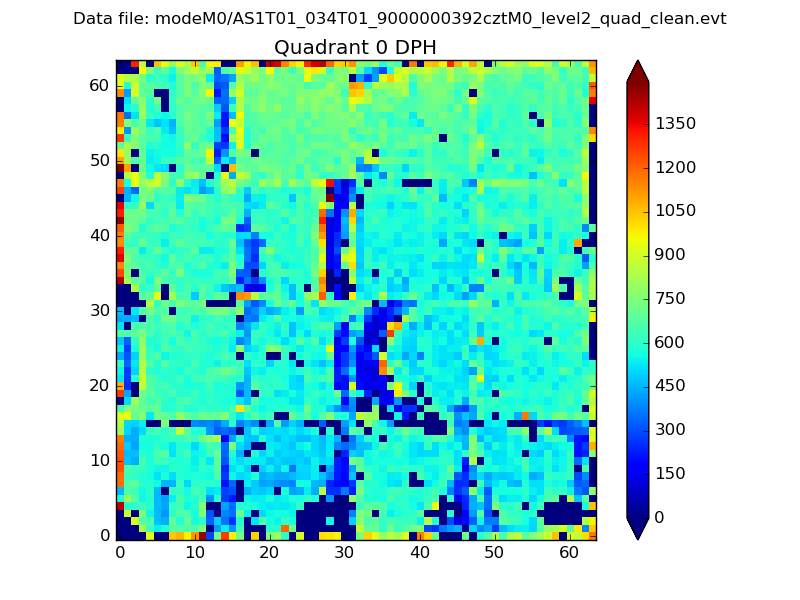 |
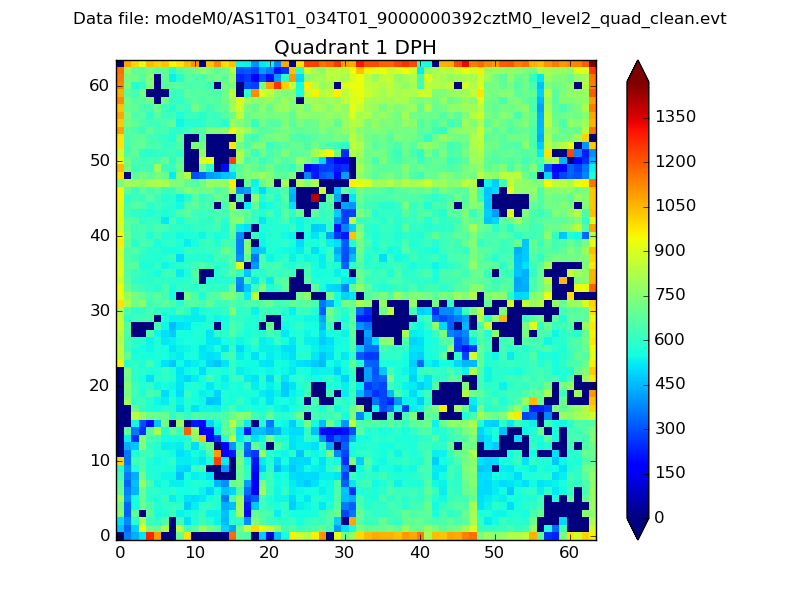 |
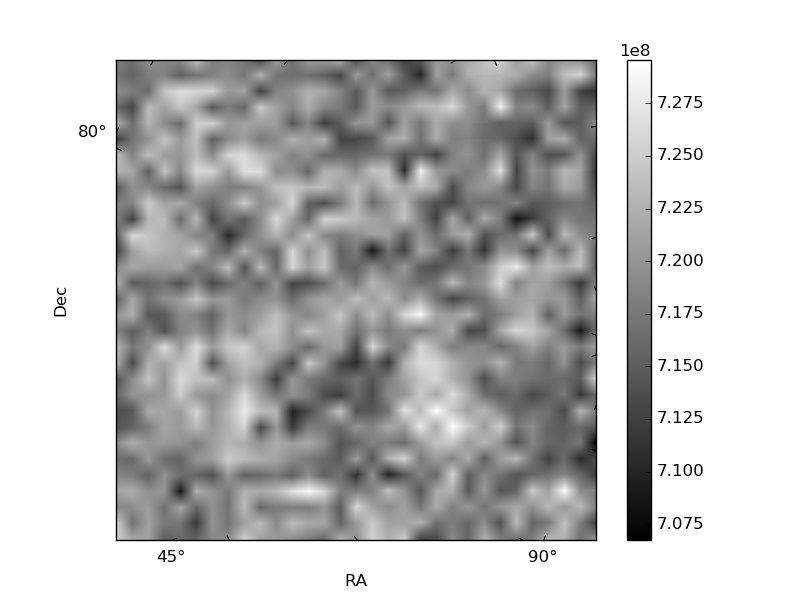
Quadrant B |
|---|---|---|---|
| Quadrant D | 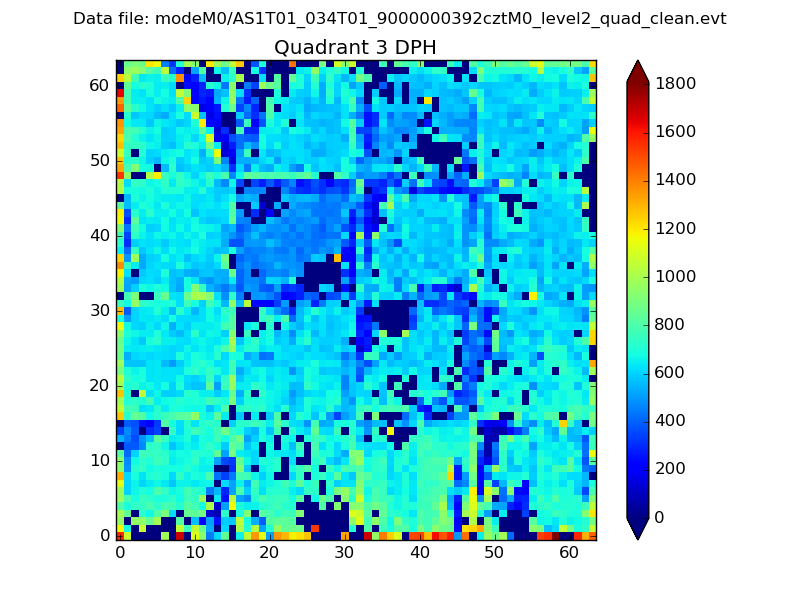 |
 |
Quadrant C |
| Plot type | Count rate plots | Images |
|---|---|---|
| Comparison with Poisson distribution Blue bars denote a histogram of data divided into 1 sec bins. Red curve is a Poisson curve with rate = median count rate of data. |
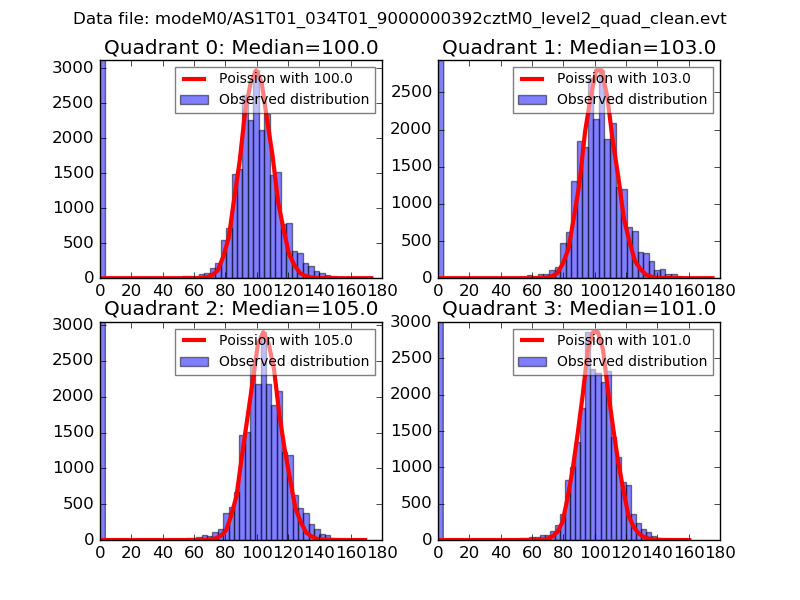 |
 |
| Quadrant-wise count rates Data is divided into 100 sec bins |
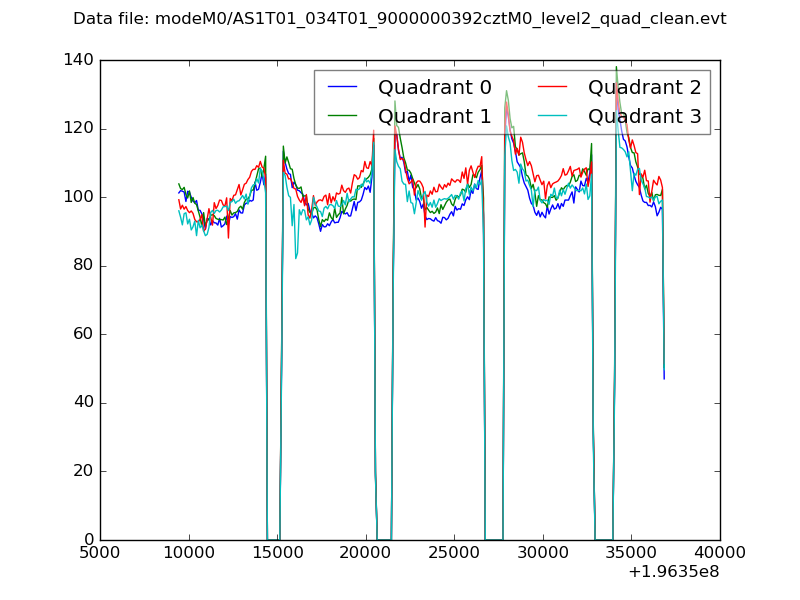 |
|
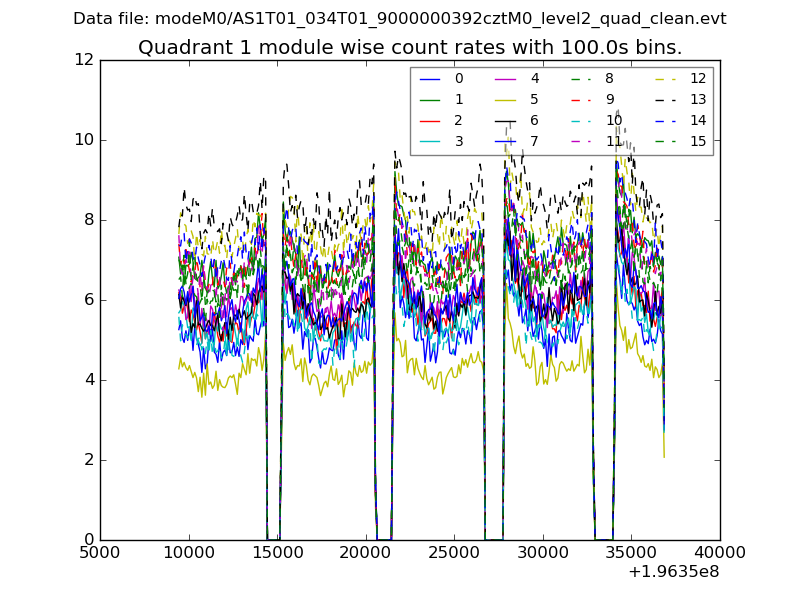
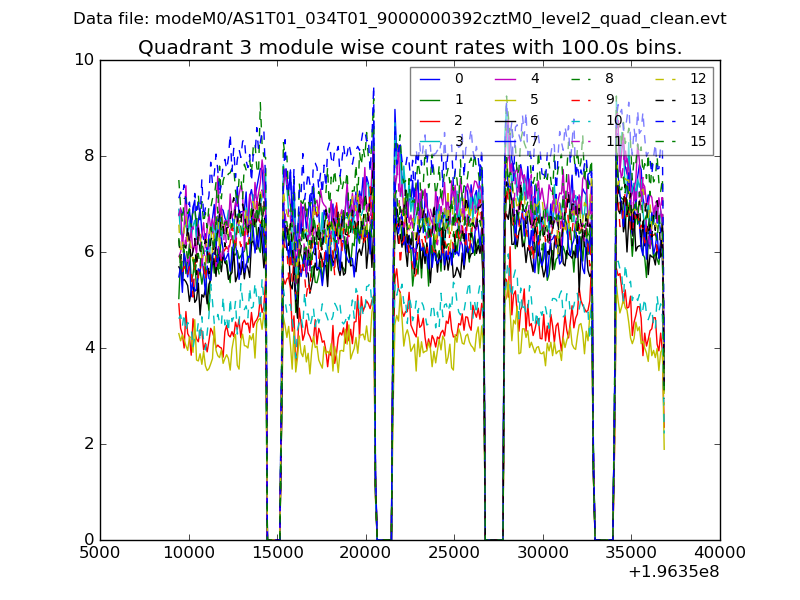
| Module-wise count rates for Quadrant A Data is divided into 100 sec bins |
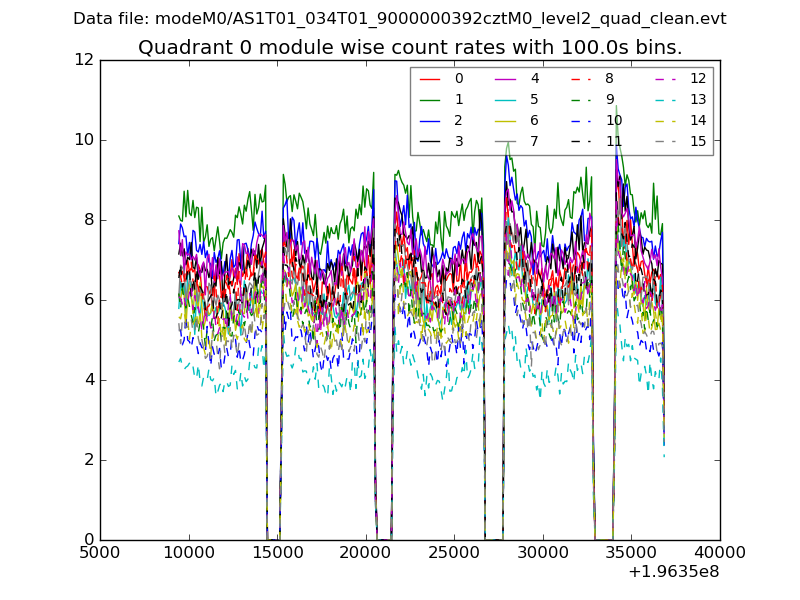 |
 |
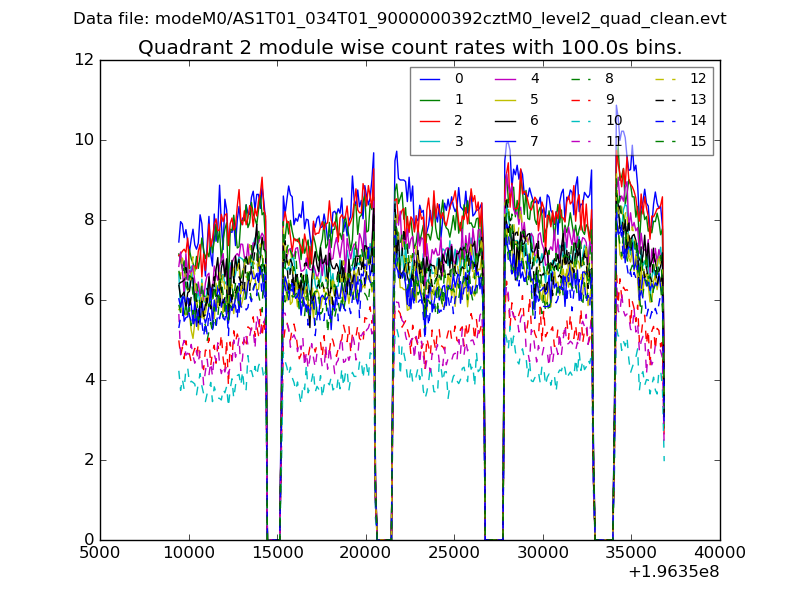
| Module-wise count rates for Quadrant B Data is divided into 100 sec bins |
 |
 |
| Module-wise count rates for Quadrant C Data is divided into 100 sec bins |
 |
 |
| Module-wise count rates for Quadrant D Data is divided into 100 sec bins |
 |
 |
| Parameter | Plot |
|---|---|
| CZT HV Monitor | 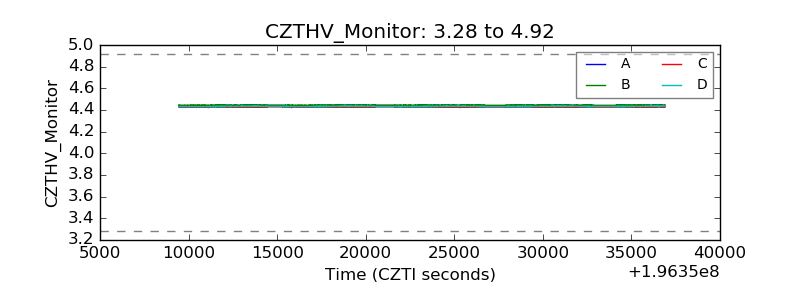 |
| D_VDD | 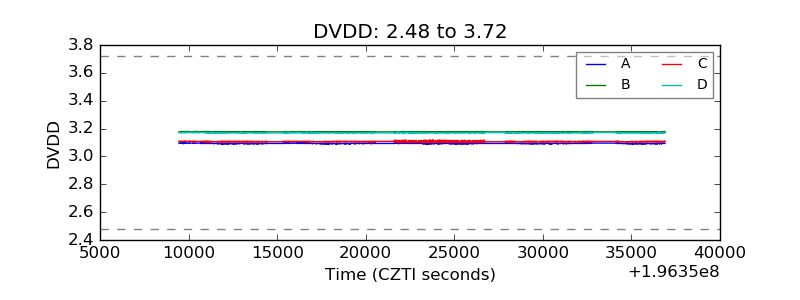 |
| Temperature 1 | 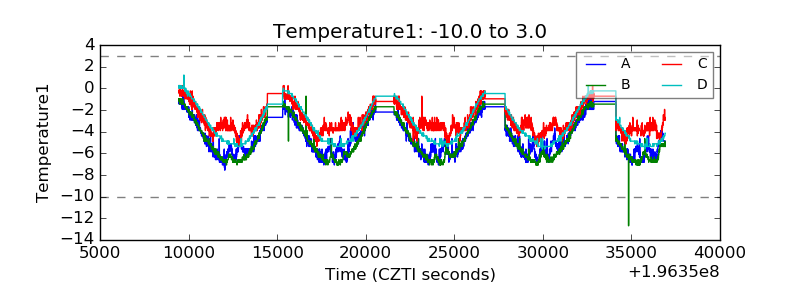 |
| Veto HV Monitor | 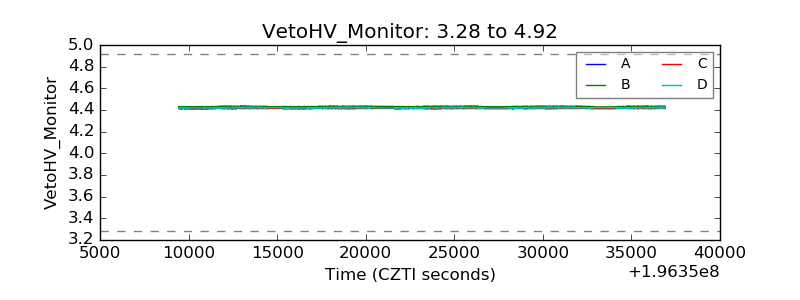 |
| Veto LLD | 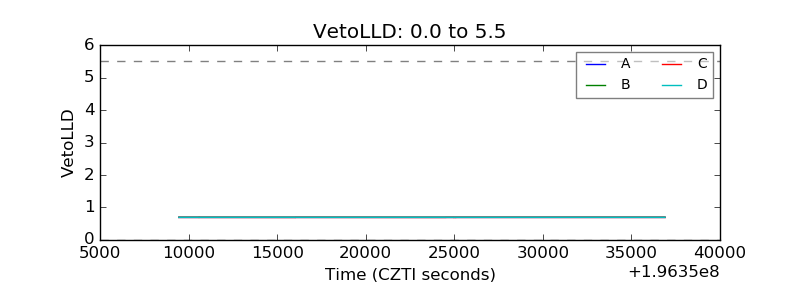 |
| Alpha Counter | 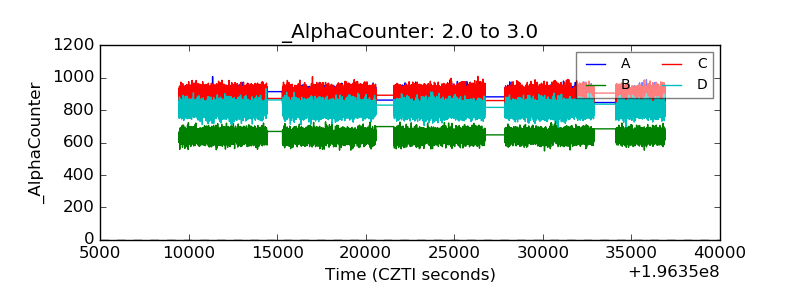 |
| _CPM_Rate | 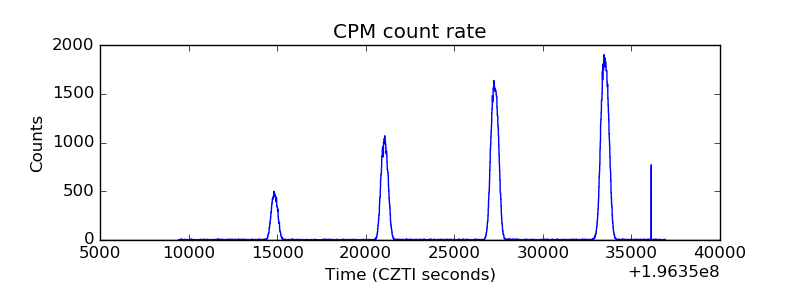 |
| CZT Counter | 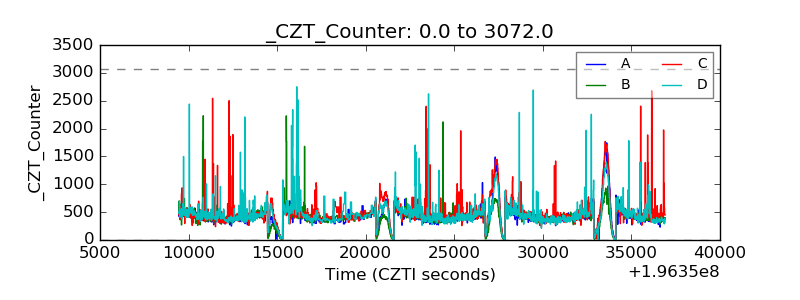 |
| +2.5 Volts monitor | 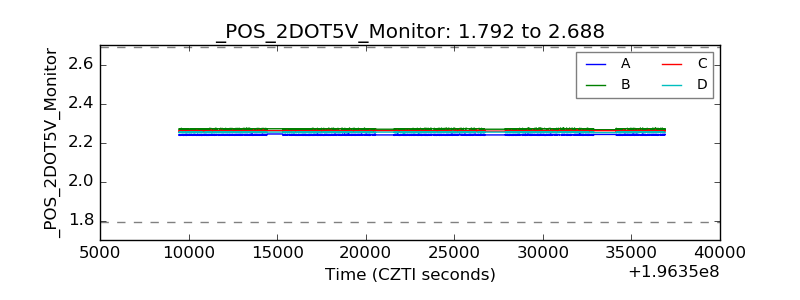 |
| +5 Volts monitor | 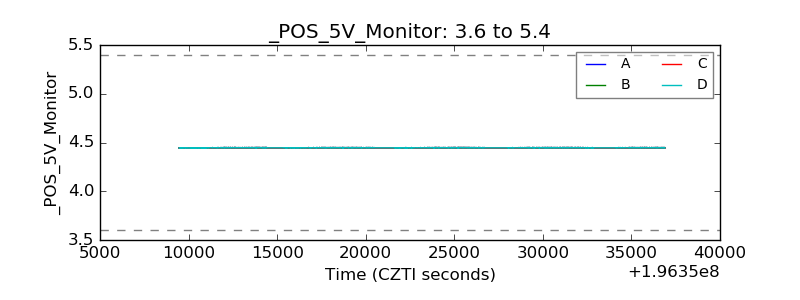 |
| _ROLL_ROT | 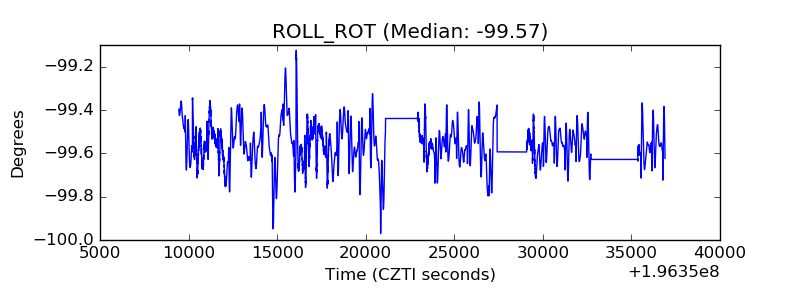 |
| _Roll_DEC | 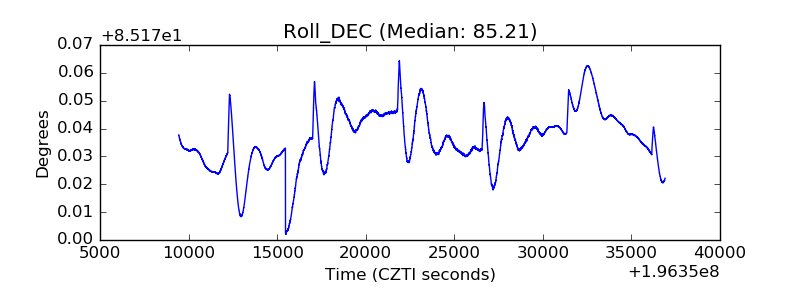 |
| _Roll_RA | 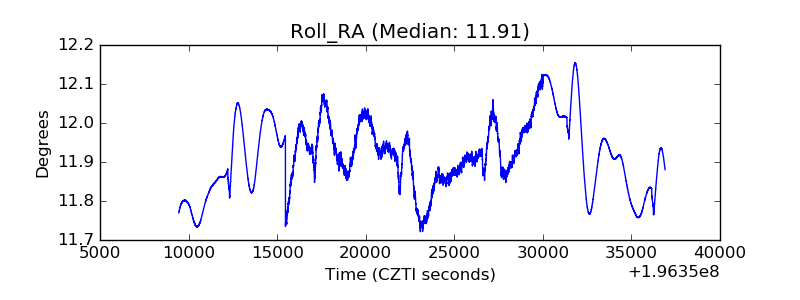 |
| Veto Counter | 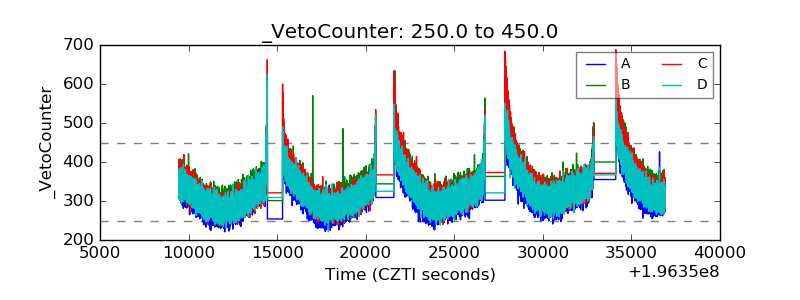 |