| Param | Original file | Final file |
|---|---|---|
| Filename | modeM0/AS1T01_051T01_9000000390cztM0_level2.fits | modeM0/AS1T01_051T01_9000000390cztM0_level2_quad_clean.evt |
| Size (bytes) | 324,417,600 | 516,775,680 |
| Size | 309.4 MB | 492.8 MB |
| Events in quadrant A | 1,912,776 | 3,368,688 |
| Events in quadrant B | 1,869,356 | 3,442,364 |
| Events in quadrant C | 1,904,134 | 3,339,259 |
| Events in quadrant D | 1,572,226 | 2,937,348 |
| Mode M0 | |||
|---|---|---|---|
| Quadrant | BADHDUFLAG | Total packets | Discarded packets |
| A | 0 | 76432 | 0 |
| B | 0 | 79902 | 0 |
| C | 0 | 79388 | 0 |
| D | 0 | 99495 | 0 |
| Mode M9 | |||
|---|---|---|---|
| Quadrant | BADHDUFLAG | Total packets | Discarded packets |
| A | 0 | 35 | 0 |
| B | 0 | 35 | 0 |
| C | 0 | 35 | 0 |
| D | 0 | 36 | 0 |
| Mode SS | |||
|---|---|---|---|
| Quadrant | BADHDUFLAG | Total packets | Discarded packets |
| A | 0 | 756 | 0 |
| B | 0 | 756 | 0 |
| C | 0 | 756 | 0 |
| D | 0 | 756 | 0 |
| Quadrant | Total seconds | Saturated seconds | Saturation percentage |
|---|---|---|---|
| A | 37356 | 629 | 1.683799% |
| B | 37356 | 674 | 1.804262% |
| C | 37356 | 455 | 1.218010% |
| D | 37356 | 1797 | 4.810472% |
Noise dominated data is calculated using 1-second bins in cleaned event files. If a bin has >2000 counts, and if more than 50% of those come from <1% of pixels, then it is considered to be noise-dominated and hence unusable.
| Quadrant | # 1 sec bins | Bins with >0 counts | Bins with >2000 counts | High rate bins dominated by noise | Noise dominated (total time) | Noise dominated (detector-on time) | Marked lightcurve |
|---|---|---|---|---|---|---|---|
| A | 40390 | 37355 | 0 | 0 | 0.00% | 0.00% |  |
| B | 40390 | 37356 | 0 | 0 | 0.00% | 0.00% |  |
| C | 40390 | 37356 | 0 | 0 | 0.00% | 0.00% |  |
| D | 40390 | 37353 | 0 | 0 | 0.00% | 0.00% |  |
Top three noisy pixels from each quadrant. If the there are fewer than three noisy pixels in the level2.evt file, extra rows are filled as -1
| Pixel properties | Quadrant properties | ||||||
|---|---|---|---|---|---|---|---|
| Quadrant | DetID | PixID | Counts | Sigma | Mean | Median | Sigma |
| A | 14 | 188 | 1885 | 10.92 | 495 | 463 | 130.2 |
| A | 0 | 29 | 1786 | 10.16 | 495 | 463 | 130.2 |
| A | 14 | 204 | 1714 | 9.61 | 495 | 463 | 130.2 |
| B | 2 | 9 | 1638 | 12.18 | 492 | 470 | 95.9 |
| B | 12 | 226 | 1402 | 9.72 | 492 | 470 | 95.9 |
| B | 5 | 128 | 1387 | 9.56 | 492 | 470 | 95.9 |
| C | 7 | 111 | 1324 | 6.27 | 503 | 464 | 137.2 |
| C | 2 | 191 | 1305 | 6.13 | 503 | 464 | 137.2 |
| C | 1 | 80 | 1302 | 6.11 | 503 | 464 | 137.2 |
| D | 4 | 160 | 1205 | 6.27 | 450 | 407 | 127.3 |
| D | 11 | 82 | 1195 | 6.19 | 450 | 407 | 127.3 |
| D | 6 | 231 | 1168 | 5.98 | 450 | 407 | 127.3 |
Histogram calculated using DETX and DETY for each event in the final _common_clean file
| Quadrant A | 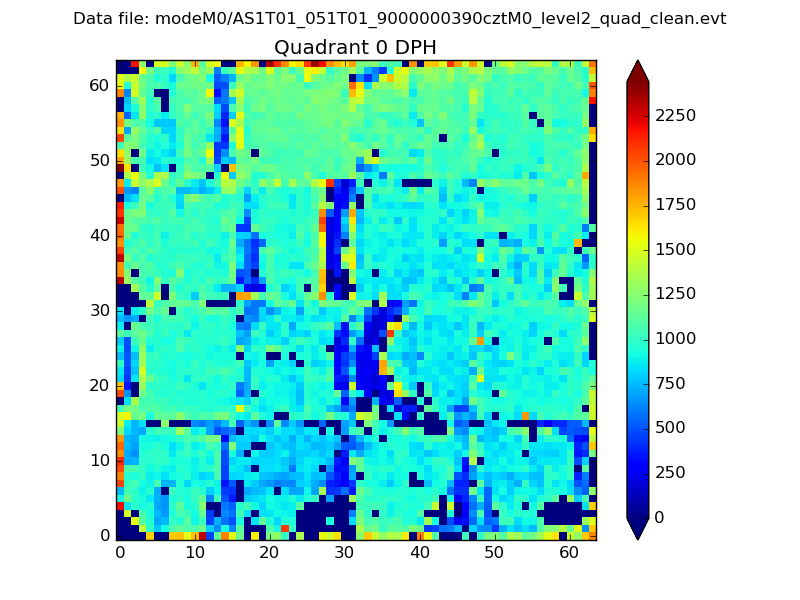 |
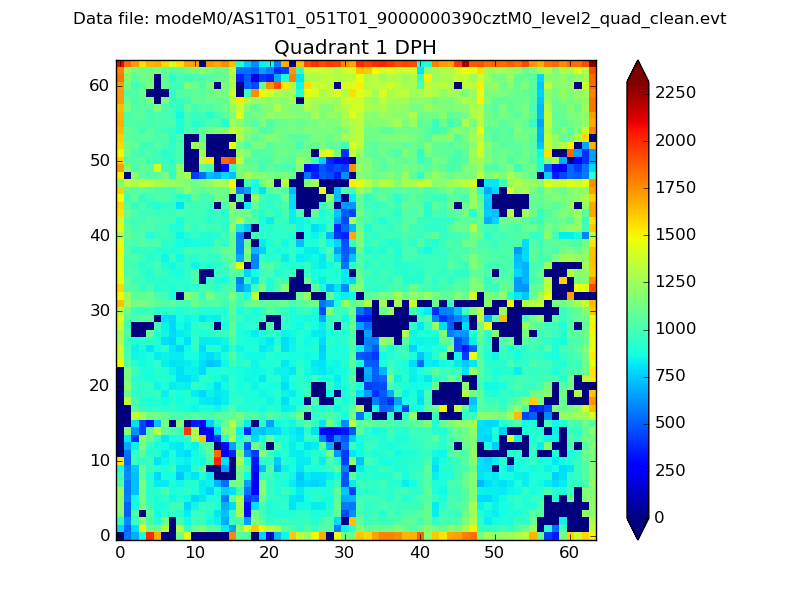 |
Quadrant B |
|---|---|---|---|
| Quadrant D |  |
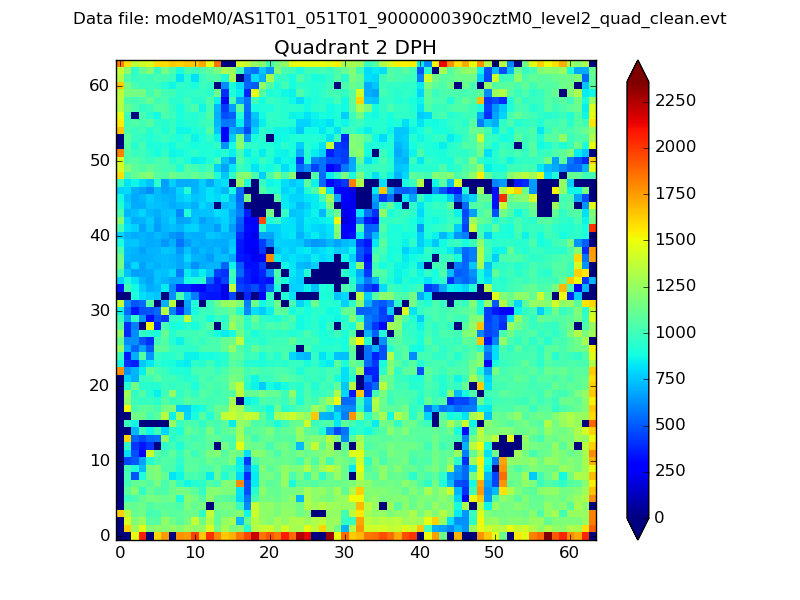 |
Quadrant C |
| Plot type | Count rate plots | Images |
|---|---|---|
| Comparison with Poisson distribution Blue bars denote a histogram of data divided into 1 sec bins. Red curve is a Poisson curve with rate = median count rate of data. |
 |
 |
| Quadrant-wise count rates Data is divided into 100 sec bins |
 |
|
| Module-wise count rates for Quadrant A Data is divided into 100 sec bins |
 |
 |
| Module-wise count rates for Quadrant B Data is divided into 100 sec bins |
 |
 |
| Module-wise count rates for Quadrant C Data is divided into 100 sec bins |
 |
 |
| Module-wise count rates for Quadrant D Data is divided into 100 sec bins |
 |
 |
| Parameter | Plot |
|---|---|
| CZT HV Monitor |  |
| D_VDD |  |
| Temperature 1 |  |
| Veto HV Monitor |  |
| Veto LLD |  |
| Alpha Counter |  |
| _CPM_Rate |  |
| CZT Counter |  |
| +2.5 Volts monitor |  |
| +5 Volts monitor |  |
| _ROLL_ROT |  |
| _Roll_DEC |  |
| _Roll_RA |  |
| Veto Counter |  |