| Param | Original file | Final file |
|---|---|---|
| Filename | modeM0/AS1T01_051T01_9000000390_02606cztM0_level2.evt | modeM0/AS1T01_051T01_9000000390_02606cztM0_level2_quad_clean.evt |
| Size (bytes) | 421,128,000 | 107,596,800 |
| Size | 401.6 MB | 102.6 MB |
| Events in quadrant A | 2,823,461 | 689,021 |
| Events in quadrant B | 3,155,900 | 710,438 |
| Events in quadrant C | 2,894,549 | 719,208 |
| Events in quadrant D | 3,432,709 | 681,763 |
| Mode M0 | |||
|---|---|---|---|
| Quadrant | BADHDUFLAG | Total packets | Discarded packets |
| A | 0 | 13347 | 0 |
| B | 0 | 14111 | 0 |
| C | 0 | 13455 | 0 |
| D | 0 | 15278 | 0 |
| Mode M9 | |||
|---|---|---|---|
| Quadrant | BADHDUFLAG | Total packets | Discarded packets |
| A | 0 | 16 | 0 |
| B | 0 | 16 | 0 |
| C | 0 | 16 | 0 |
| D | 0 | 17 | 0 |
| Mode SS | |||
|---|---|---|---|
| Quadrant | BADHDUFLAG | Total packets | Discarded packets |
| A | 0 | 134 | 0 |
| B | 0 | 134 | 0 |
| C | 0 | 134 | 0 |
| D | 0 | 134 | 0 |
| Quadrant | Total seconds | Saturated seconds | Saturation percentage |
|---|---|---|---|
| A | 6571 | 28 | 0.426115% |
| B | 6571 | 62 | 0.943540% |
| C | 6571 | 19 | 0.289149% |
| D | 6571 | 106 | 1.613149% |
Noise dominated data is calculated using 1-second bins in cleaned event files. If a bin has >2000 counts, and if more than 50% of those come from <1% of pixels, then it is considered to be noise-dominated and hence unusable.
| Quadrant | # 1 sec bins | Bins with >0 counts | Bins with >2000 counts | High rate bins dominated by noise | Noise dominated (total time) | Noise dominated (detector-on time) | Marked lightcurve |
|---|---|---|---|---|---|---|---|
| A | 7771 | 6572 | 0 | 0 | 0.00% | 0.00% | 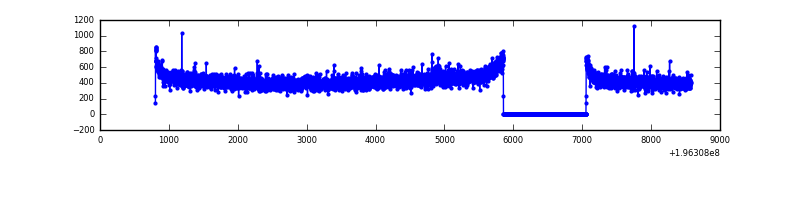 |
| B | 7771 | 6572 | 16 | 16 | 0.21% | 0.24% | 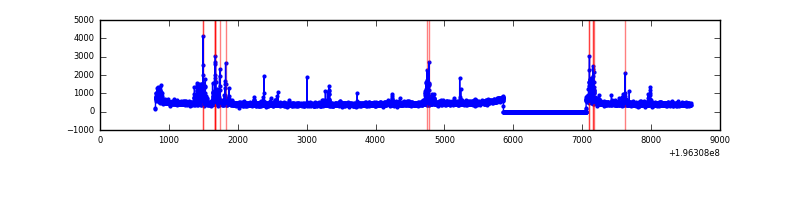 |
| C | 7771 | 6572 | 5 | 5 | 0.06% | 0.08% | 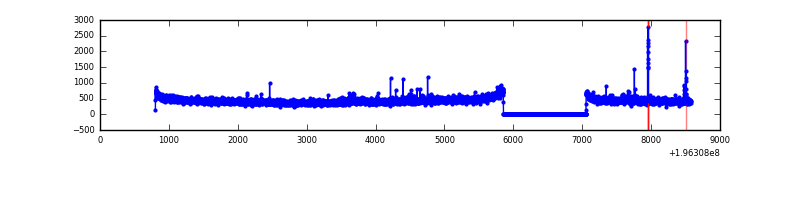 |
| D | 7771 | 6572 | 42 | 42 | 0.54% | 0.64% | 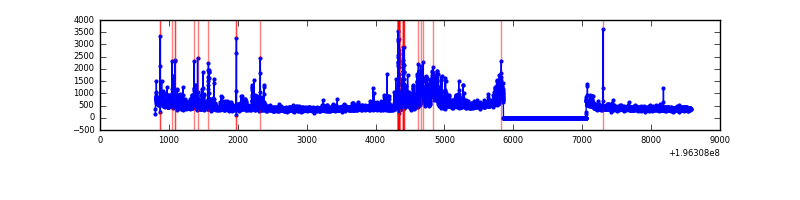 |
Top three noisy pixels from each quadrant. If the there are fewer than three noisy pixels in the level2.evt file, extra rows are filled as -1
| Pixel properties | Quadrant properties | ||||||
|---|---|---|---|---|---|---|---|
| Quadrant | DetID | PixID | Counts | Sigma | Mean | Median | Sigma |
| A | 3 | 1 | 13813 | 88.71 | 727 | 710 | 147.7 |
| A | 12 | 194 | 7949 | 49.01 | 727 | 710 | 147.7 |
| A | 0 | 226 | 7703 | 47.34 | 727 | 710 | 147.7 |
| B | 10 | 244 | 235358 | 1679.4 | 743 | 723 | 139.7 |
| B | 7 | 205 | 25617 | 178.18 | 743 | 723 | 139.7 |
| B | 0 | 189 | 11298 | 75.69 | 743 | 723 | 139.7 |
| C | 10 | 82 | 29560 | 174.94 | 716 | 719 | 164.9 |
| C | 9 | 70 | 24247 | 142.71 | 716 | 719 | 164.9 |
| C | 10 | 34 | 22363 | 131.29 | 716 | 719 | 164.9 |
| D | 2 | 216 | 433206 | 2619.89 | 697 | 680 | 165.1 |
| D | 2 | 136 | 140683 | 848.02 | 697 | 680 | 165.1 |
| D | 2 | 184 | 88506 | 531.98 | 697 | 680 | 165.1 |
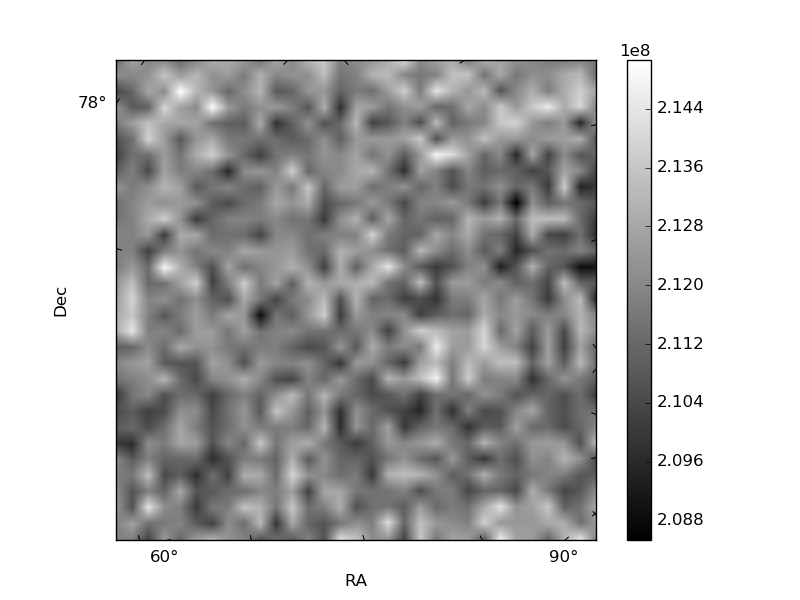
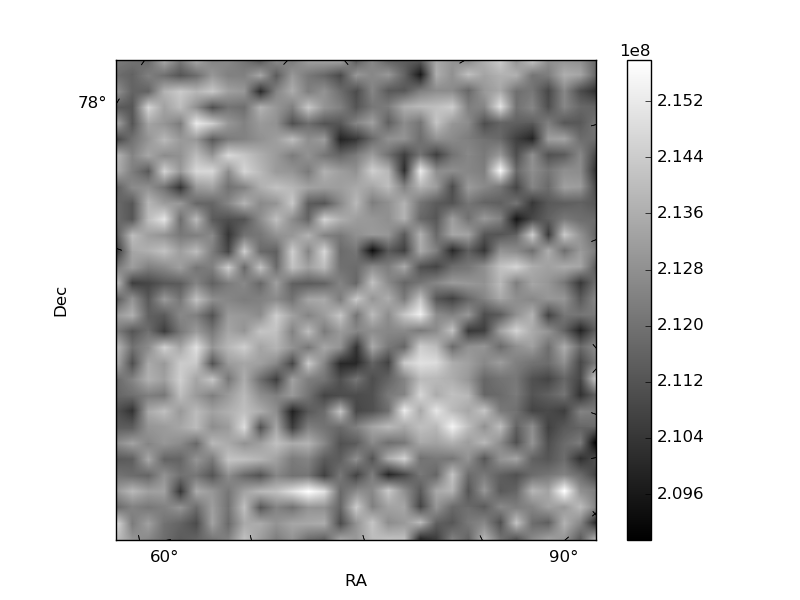
Histogram calculated using DETX and DETY for each event in the final _common_clean file
| Quadrant A | 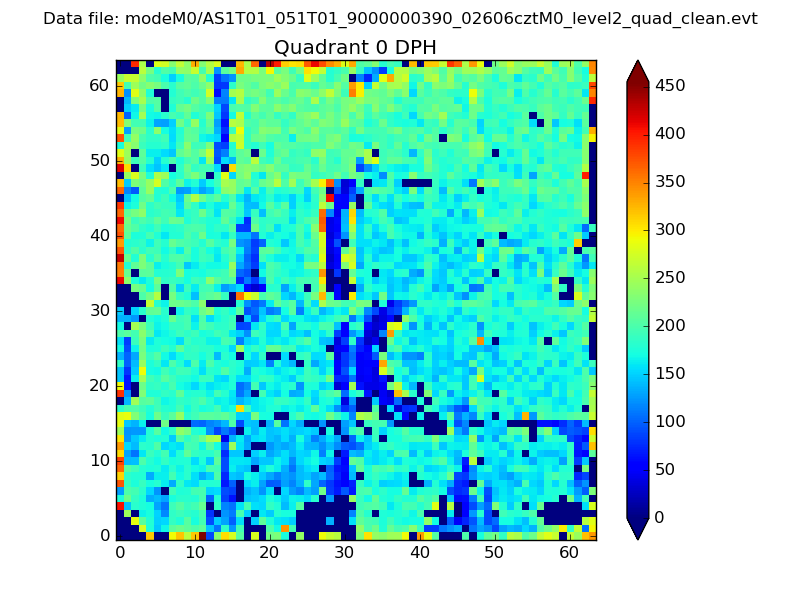 |
 |
Quadrant B |
|---|---|---|---|
| Quadrant D |  |
 |
Quadrant C |
| Plot type | Count rate plots | Images |
|---|---|---|
| Comparison with Poisson distribution Blue bars denote a histogram of data divided into 1 sec bins. Red curve is a Poisson curve with rate = median count rate of data. |
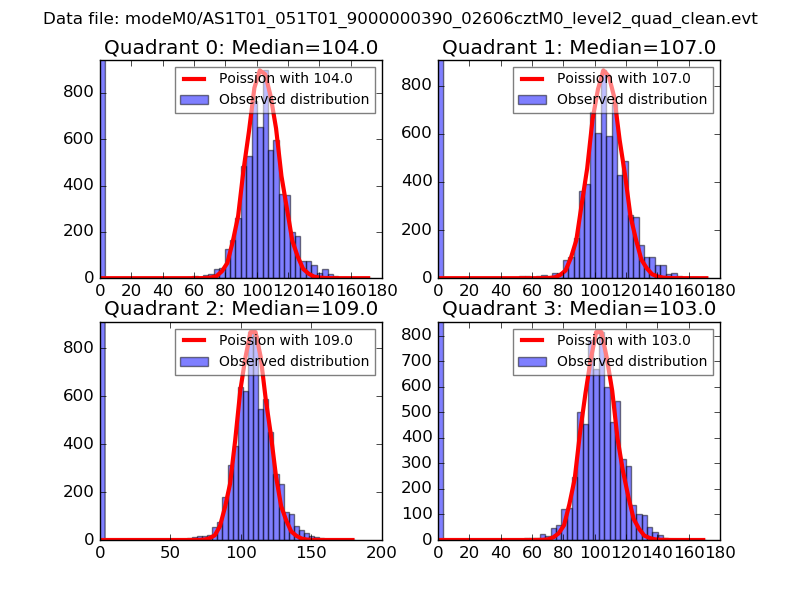 |
 |
| Quadrant-wise count rates Data is divided into 100 sec bins |
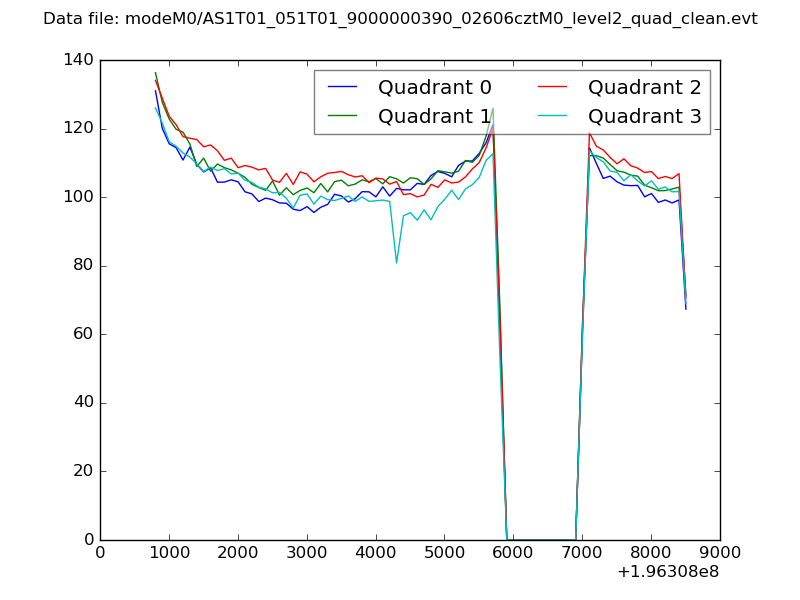 |
|
| Module-wise count rates for Quadrant A Data is divided into 100 sec bins |
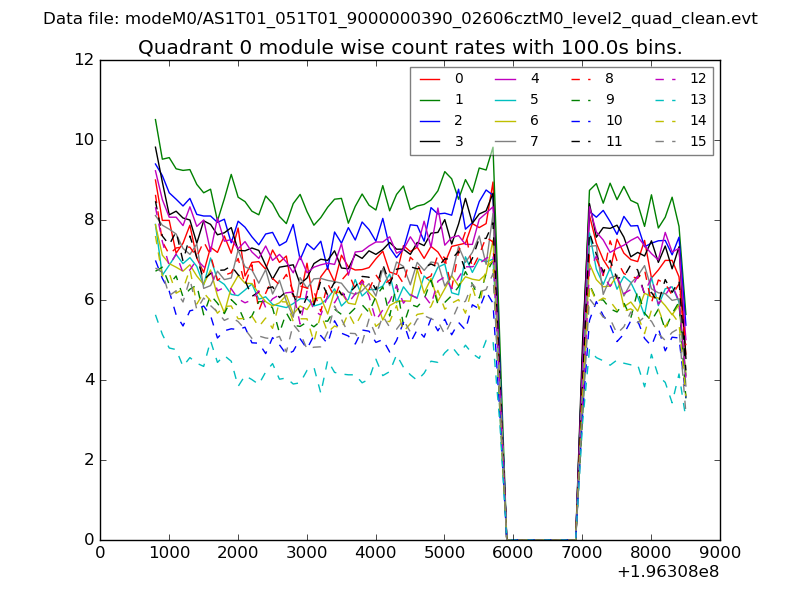 |
 |
| Module-wise count rates for Quadrant B Data is divided into 100 sec bins |
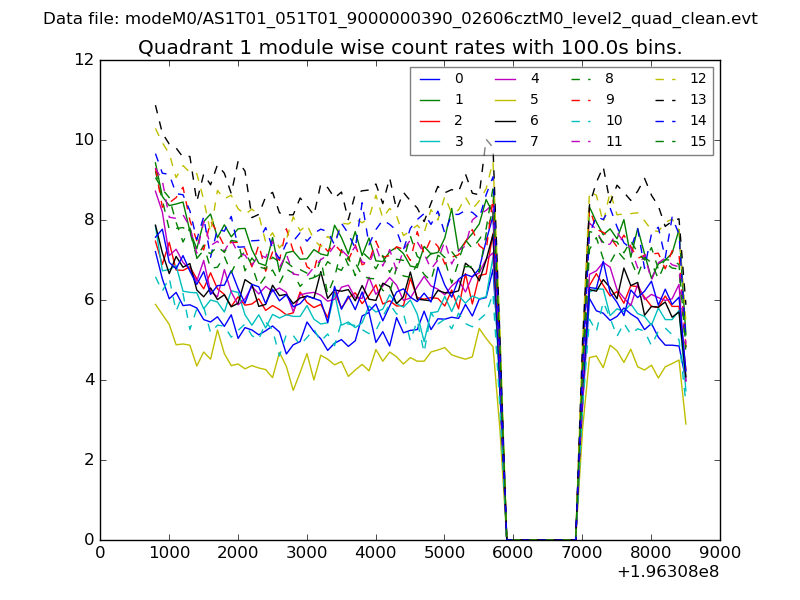 |
 |
| Module-wise count rates for Quadrant C Data is divided into 100 sec bins |
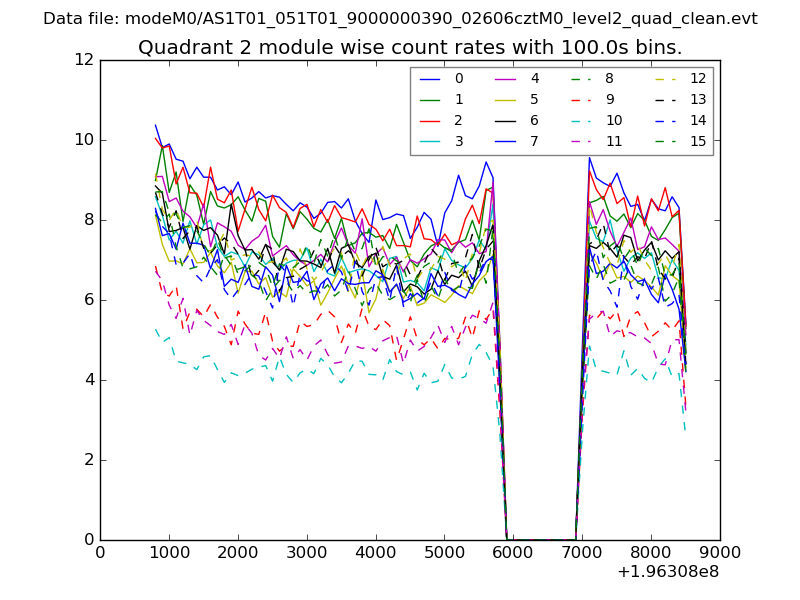 |
 |
| Module-wise count rates for Quadrant D Data is divided into 100 sec bins |
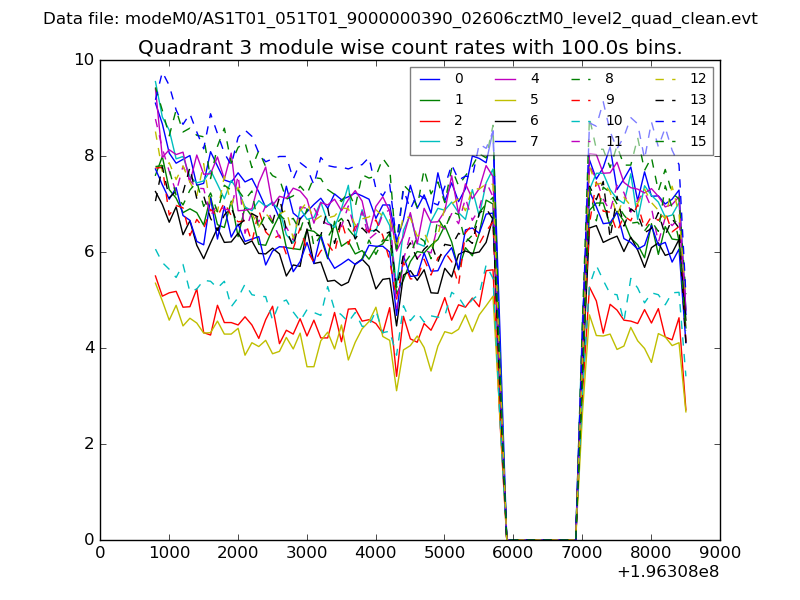 |
 |
| Parameter | Plot |
|---|---|
| CZT HV Monitor | 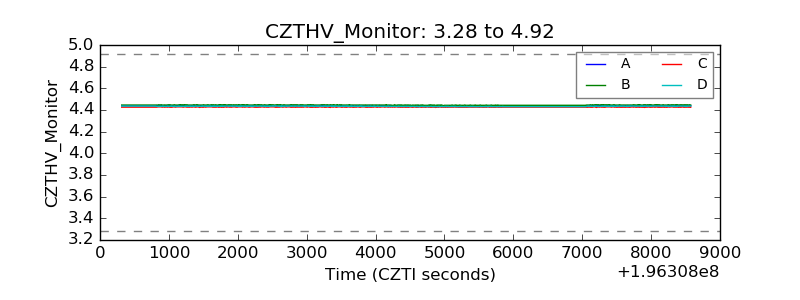 |
| D_VDD | 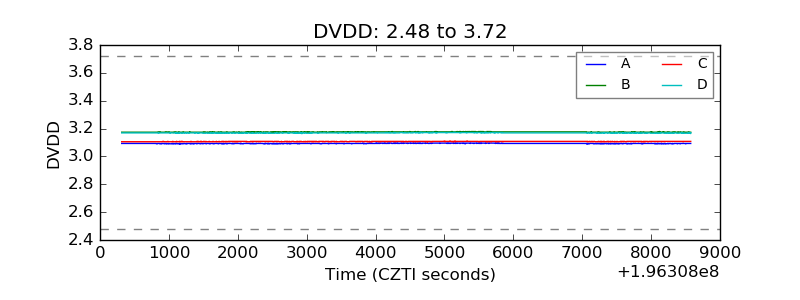 |
| Temperature 1 | 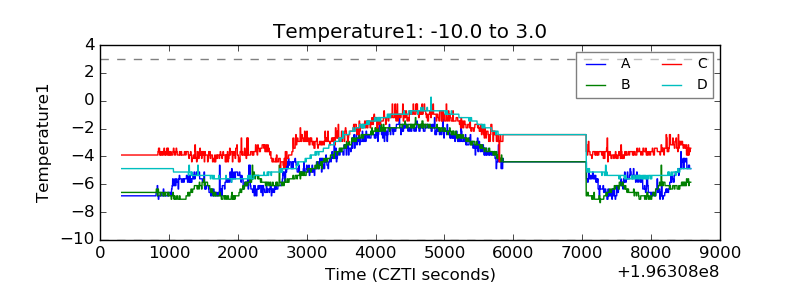 |
| Veto HV Monitor | 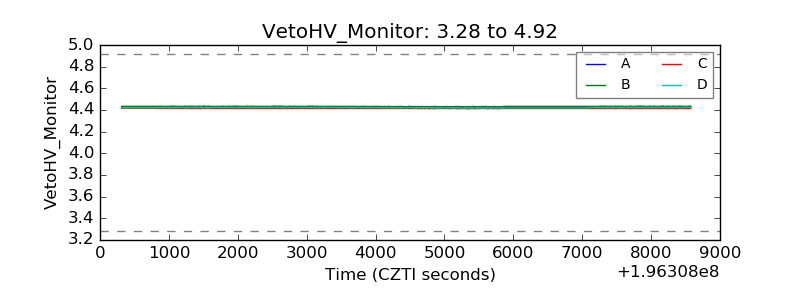 |
| Veto LLD | 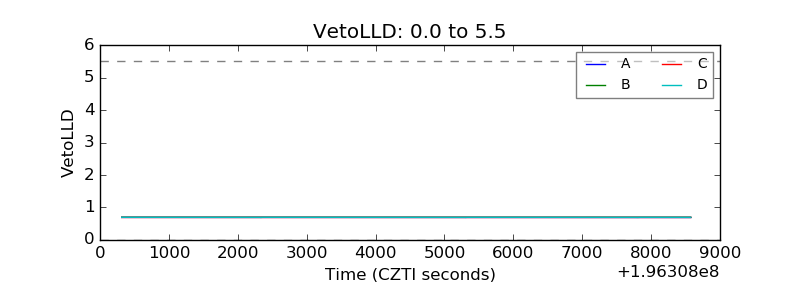 |
| Alpha Counter | 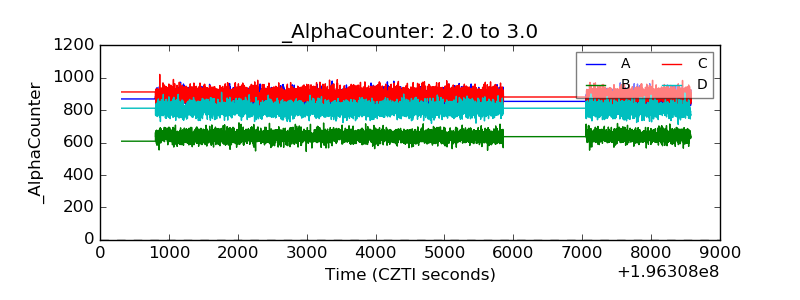 |
| _CPM_Rate | 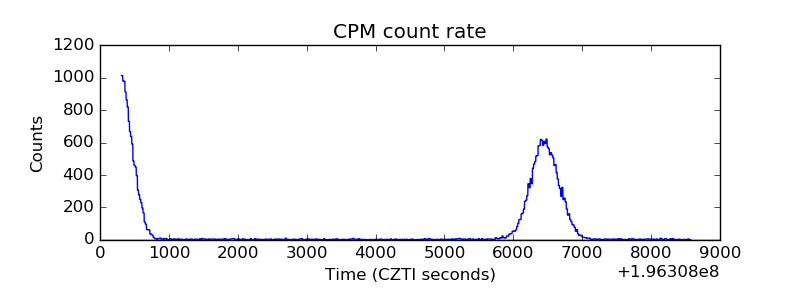 |
| CZT Counter | 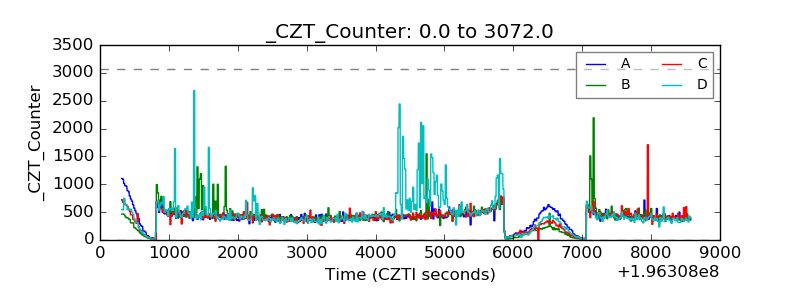 |
| +2.5 Volts monitor |  |
| +5 Volts monitor |  |
| _ROLL_ROT | 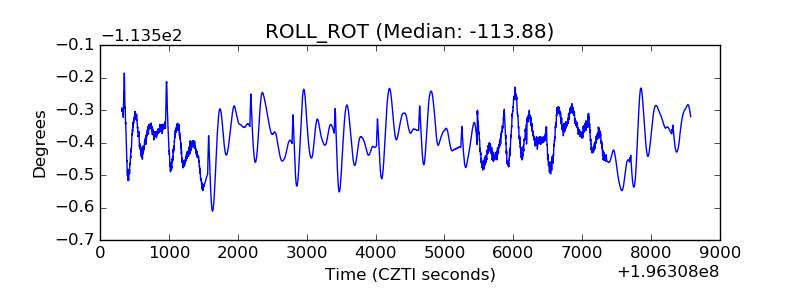 |
| _Roll_DEC | 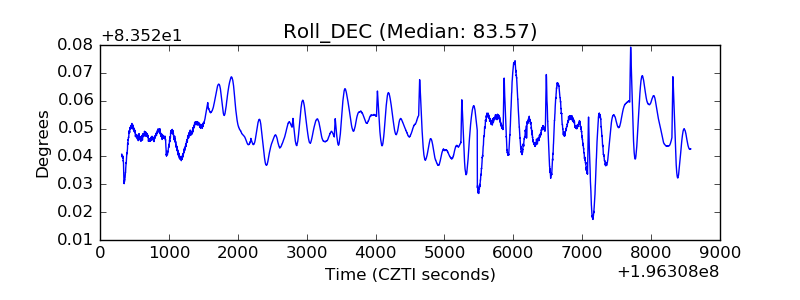 |
| _Roll_RA | 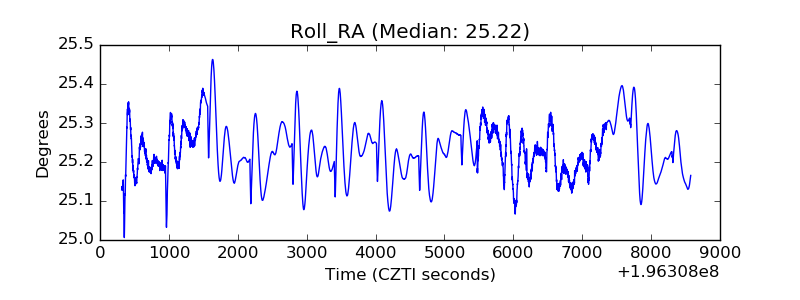 |
| Veto Counter | 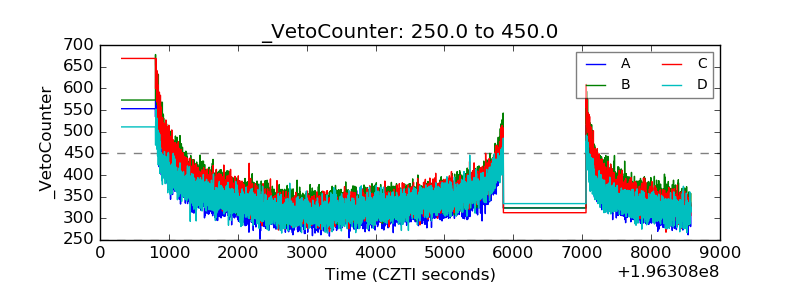 |