| Param | Original file | Final file |
|---|---|---|
| Filename | modeM0/AS1T01_046T01_9000000396cztM0_level2.fits | modeM0/AS1T01_046T01_9000000396cztM0_level2_quad_clean.evt |
| Size (bytes) | 674,271,360 | 761,451,840 |
| Size | 643.0 MB | 726.2 MB |
| Events in quadrant A | 3,988,098 | 4,568,690 |
| Events in quadrant B | 3,915,594 | 4,655,548 |
| Events in quadrant C | 3,948,246 | 4,501,756 |
| Events in quadrant D | 3,365,012 | 4,134,646 |
| Mode SS | |||
|---|---|---|---|
| Quadrant | BADHDUFLAG | Total packets | Discarded packets |
| A | 0 | 1546 | 0 |
| B | 0 | 1550 | 0 |
| C | 0 | 1538 | 0 |
| D | 0 | 1537 | 0 |
| Mode M0 | |||
|---|---|---|---|
| Quadrant | BADHDUFLAG | Total packets | Discarded packets |
| A | 0 | 155060 | 0 |
| B | 0 | 156587 | 0 |
| C | 0 | 179509 | 0 |
| D | 0 | 173771 | 0 |
| Mode M9 | |||
|---|---|---|---|
| Quadrant | BADHDUFLAG | Total packets | Discarded packets |
| A | 0 | 132 | 0 |
| B | 0 | 132 | 0 |
| C | 0 | 132 | 0 |
| D | 0 | 132 | 0 |
| Quadrant | Total seconds | Saturated seconds | Saturation percentage |
|---|---|---|---|
| A | 75889 | 912 | 1.201755% |
| B | 75874 | 924 | 1.217808% |
| C | 75845 | 1826 | 2.407542% |
| D | 75835 | 1561 | 2.058416% |
Noise dominated data is calculated using 1-second bins in cleaned event files. If a bin has >2000 counts, and if more than 50% of those come from <1% of pixels, then it is considered to be noise-dominated and hence unusable.
| Quadrant | # 1 sec bins | Bins with >0 counts | Bins with >2000 counts | High rate bins dominated by noise | Noise dominated (total time) | Noise dominated (detector-on time) | Marked lightcurve |
|---|---|---|---|---|---|---|---|
| A | 114543 | 76260 | 0 | 0 | 0.00% | 0.00% |  |
| B | 114543 | 76232 | 0 | 0 | 0.00% | 0.00% |  |
| C | 114543 | 76190 | 0 | 0 | 0.00% | 0.00% |  |
| D | 114543 | 76170 | 0 | 0 | 0.00% | 0.00% |  |
Top three noisy pixels from each quadrant. If the there are fewer than three noisy pixels in the level2.evt file, extra rows are filled as -1
| Pixel properties | Quadrant properties | ||||||
|---|---|---|---|---|---|---|---|
| Quadrant | DetID | PixID | Counts | Sigma | Mean | Median | Sigma |
| A | 14 | 188 | 3960 | 11.14 | 1032 | 958 | 269.5 |
| A | 0 | 29 | 3769 | 10.43 | 1032 | 958 | 269.5 |
| A | 7 | 110 | 3514 | 9.48 | 1032 | 958 | 269.5 |
| B | 2 | 9 | 3527 | 12.62 | 1029 | 978 | 201.9 |
| B | 12 | 226 | 3012 | 10.07 | 1029 | 978 | 201.9 |
| B | 14 | 254 | 2744 | 8.75 | 1029 | 978 | 201.9 |
| C | 7 | 111 | 2800 | 6.49 | 1044 | 960 | 283.7 |
| C | 1 | 80 | 2692 | 6.11 | 1044 | 960 | 283.7 |
| C | 1 | 81 | 2659 | 5.99 | 1044 | 960 | 283.7 |
| D | 3 | 14 | 2613 | 6.53 | 959 | 869 | 267.2 |
| D | 6 | 231 | 2530 | 6.22 | 959 | 869 | 267.2 |
| D | 11 | 82 | 2528 | 6.21 | 959 | 869 | 267.2 |
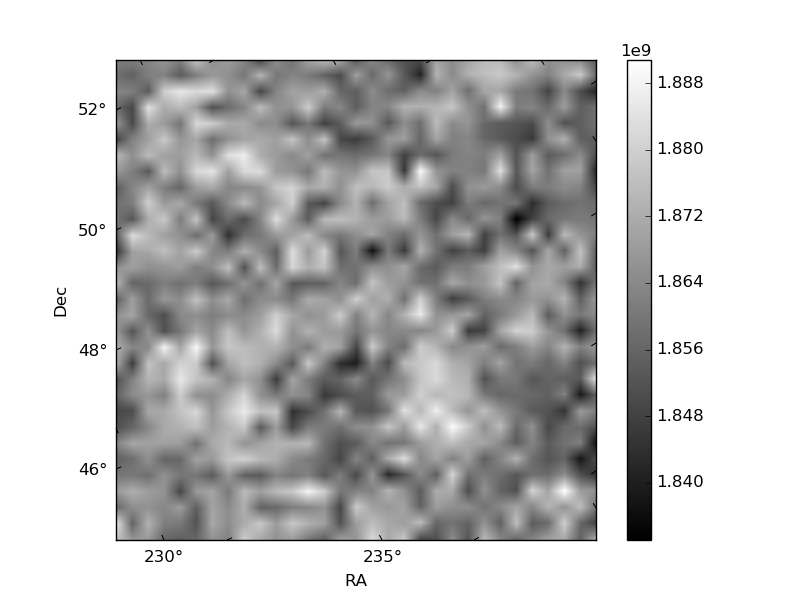
Histogram calculated using DETX and DETY for each event in the final _common_clean file
| Quadrant A |  |
 |
Quadrant B |
|---|---|---|---|
| Quadrant D |  |
 |
Quadrant C |
| Plot type | Count rate plots | Images |
|---|---|---|
| Comparison with Poisson distribution Blue bars denote a histogram of data divided into 1 sec bins. Red curve is a Poisson curve with rate = median count rate of data. |
 |
 |
| Quadrant-wise count rates Data is divided into 100 sec bins |
 |
|
| Module-wise count rates for Quadrant A Data is divided into 100 sec bins |
 |
 |
| Module-wise count rates for Quadrant B Data is divided into 100 sec bins |
 |
 |
| Module-wise count rates for Quadrant C Data is divided into 100 sec bins |
 |
 |
| Module-wise count rates for Quadrant D Data is divided into 100 sec bins |
 |
 |
| Parameter | Plot |
|---|---|
| CZT HV Monitor |  |
| D_VDD | 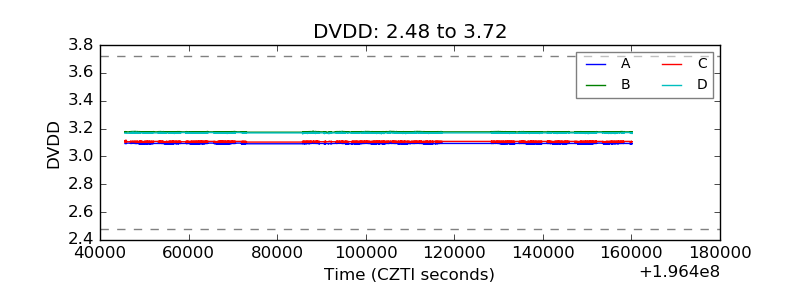 |
| Temperature 1 |  |
| Veto HV Monitor |  |
| Veto LLD |  |
| Alpha Counter |  |
| _CPM_Rate |  |
| CZT Counter |  |
| +2.5 Volts monitor |  |
| +5 Volts monitor |  |
| _ROLL_ROT |  |
| _Roll_DEC |  |
| _Roll_RA | 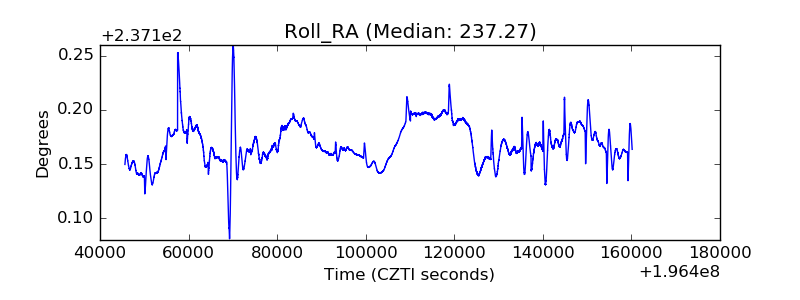 |
| Veto Counter |  |