| Param | Original file | Final file |
|---|---|---|
| Filename | modeM0/AS1T01_055T01_9000000394cztM0_level2.fits | modeM0/AS1T01_055T01_9000000394cztM0_level2_quad_clean.evt |
| Size (bytes) | 426,384,000 | 453,372,480 |
| Size | 406.6 MB | 432.4 MB |
| Events in quadrant A | 2,548,526 | 2,738,312 |
| Events in quadrant B | 2,486,266 | 2,737,223 |
| Events in quadrant C | 2,508,330 | 2,631,335 |
| Events in quadrant D | 2,100,714 | 2,355,694 |
| Mode M9 | |||
|---|---|---|---|
| Quadrant | BADHDUFLAG | Total packets | Discarded packets |
| A | 0 | 50 | 0 |
| B | 0 | 50 | 0 |
| C | 0 | 50 | 0 |
| D | 0 | 51 | 0 |
| Mode M0 | |||
|---|---|---|---|
| Quadrant | BADHDUFLAG | Total packets | Discarded packets |
| A | 0 | 98436 | 0 |
| B | 0 | 99277 | 0 |
| C | 0 | 99390 | 0 |
| D | 0 | 123375 | 0 |
| Mode SS | |||
|---|---|---|---|
| Quadrant | BADHDUFLAG | Total packets | Discarded packets |
| A | 0 | 972 | 0 |
| B | 0 | 972 | 0 |
| C | 0 | 972 | 0 |
| D | 0 | 972 | 0 |
| Quadrant | Total seconds | Saturated seconds | Saturation percentage |
|---|---|---|---|
| A | 47622 | 923 | 1.938180% |
| B | 47622 | 954 | 2.003276% |
| C | 47622 | 581 | 1.220024% |
| D | 47622 | 1597 | 3.353492% |
Noise dominated data is calculated using 1-second bins in cleaned event files. If a bin has >2000 counts, and if more than 50% of those come from <1% of pixels, then it is considered to be noise-dominated and hence unusable.
| Quadrant | # 1 sec bins | Bins with >0 counts | Bins with >2000 counts | High rate bins dominated by noise | Noise dominated (total time) | Noise dominated (detector-on time) | Marked lightcurve |
|---|---|---|---|---|---|---|---|
| A | 52132 | 47622 | 0 | 0 | 0.00% | 0.00% | 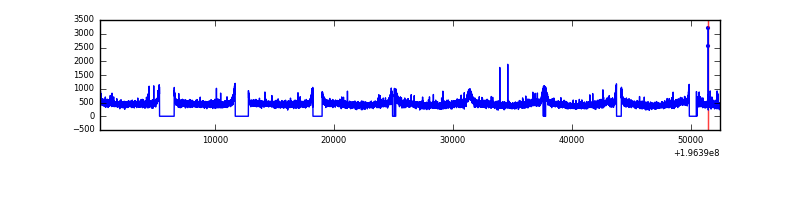 |
| B | 52132 | 47622 | 0 | 0 | 0.00% | 0.00% |  |
| C | 52132 | 47621 | 0 | 0 | 0.00% | 0.00% |  |
| D | 52132 | 47618 | 0 | 0 | 0.00% | 0.00% |  |
Top three noisy pixels from each quadrant. If the there are fewer than three noisy pixels in the level2.evt file, extra rows are filled as -1
| Pixel properties | Quadrant properties | ||||||
|---|---|---|---|---|---|---|---|
| Quadrant | DetID | PixID | Counts | Sigma | Mean | Median | Sigma |
| A | 14 | 188 | 2526 | 11.1 | 659 | 613 | 172.3 |
| A | 0 | 29 | 2321 | 9.91 | 659 | 613 | 172.3 |
| A | 7 | 110 | 2235 | 9.41 | 659 | 613 | 172.3 |
| B | 2 | 9 | 2151 | 11.56 | 653 | 618 | 132.6 |
| B | 12 | 226 | 1866 | 9.41 | 653 | 618 | 132.6 |
| B | 5 | 128 | 1693 | 8.11 | 653 | 618 | 132.6 |
| C | 7 | 111 | 1699 | 6.03 | 663 | 609 | 180.6 |
| C | 9 | 188 | 1658 | 5.81 | 663 | 609 | 180.6 |
| C | 2 | 191 | 1648 | 5.75 | 663 | 609 | 180.6 |
| D | 3 | 14 | 1589 | 6.22 | 601 | 543 | 168.2 |
| D | 1 | 19 | 1589 | 6.22 | 601 | 543 | 168.2 |
| D | 6 | 231 | 1558 | 6.03 | 601 | 543 | 168.2 |
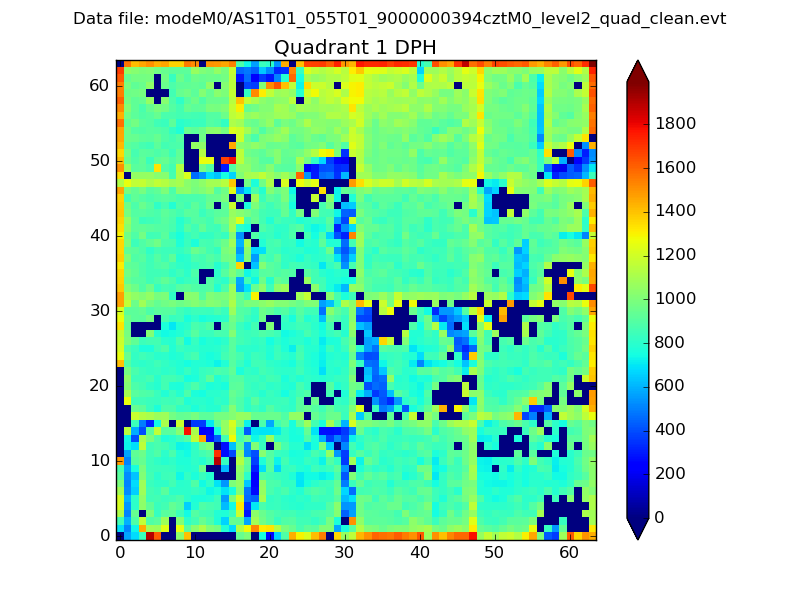
Histogram calculated using DETX and DETY for each event in the final _common_clean file
| Quadrant A |  |
 |
Quadrant B |
|---|---|---|---|
| Quadrant D | 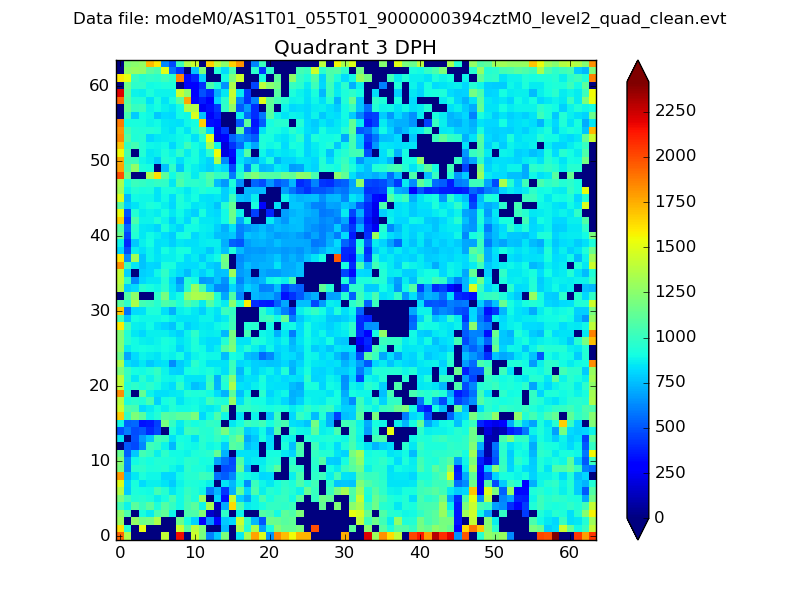 |
 |
Quadrant C |
| Plot type | Count rate plots | Images |
|---|---|---|
| Comparison with Poisson distribution Blue bars denote a histogram of data divided into 1 sec bins. Red curve is a Poisson curve with rate = median count rate of data. |
 |
 |
| Quadrant-wise count rates Data is divided into 100 sec bins |
 |
|
| Module-wise count rates for Quadrant A Data is divided into 100 sec bins |
 |
 |
| Module-wise count rates for Quadrant B Data is divided into 100 sec bins |
 |
 |
| Module-wise count rates for Quadrant C Data is divided into 100 sec bins |
 |
 |
| Module-wise count rates for Quadrant D Data is divided into 100 sec bins |
 |
 |
| Parameter | Plot |
|---|---|
| CZT HV Monitor |  |
| D_VDD | 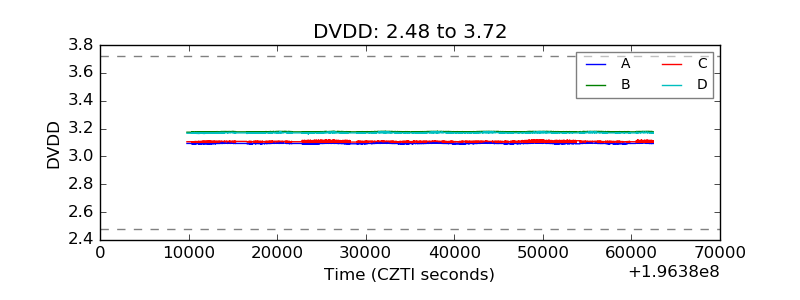 |
| Temperature 1 |  |
| Veto HV Monitor |  |
| Veto LLD |  |
| Alpha Counter |  |
| _CPM_Rate |  |
| CZT Counter |  |
| +2.5 Volts monitor |  |
| +5 Volts monitor |  |
| _ROLL_ROT |  |
| _Roll_DEC |  |
| _Roll_RA |  |
| Veto Counter |  |