| Param | Original file | Final file |
|---|---|---|
| Filename | modeM0/AS1P01_010T01_9000000398cztM0_level2.fits | modeM0/AS1P01_010T01_9000000398cztM0_level2_quad_clean.evt |
| Size (bytes) | 1,430,389,440 | 481,674,240 |
| Size | 1.3 GB | 459.4 MB |
| Events in quadrant A | 8,544,098 | 906,172 |
| Events in quadrant B | 8,338,550 | 915,456 |
| Events in quadrant C | 8,147,006 | 815,136 |
| Events in quadrant D | 7,127,142 | 781,801 |
| Mode M9 | |||
|---|---|---|---|
| Quadrant | BADHDUFLAG | Total packets | Discarded packets |
| A | 0 | 237 | 0 |
| B | 0 | 237 | 0 |
| C | 0 | 237 | 0 |
| D | 0 | 238 | 0 |
| Mode SS | |||
|---|---|---|---|
| Quadrant | BADHDUFLAG | Total packets | Discarded packets |
| A | 0 | 3302 | 0 |
| B | 0 | 3304 | 0 |
| C | 0 | 3302 | 0 |
| D | 0 | 3306 | 0 |
| Mode M0 | |||
|---|---|---|---|
| Quadrant | BADHDUFLAG | Total packets | Discarded packets |
| A | 0 | 332149 | 0 |
| B | 0 | 334648 | 0 |
| C | 0 | 487489 | 0 |
| D | 0 | 375967 | 0 |
| Quadrant | Total seconds | Saturated seconds | Saturation percentage |
|---|---|---|---|
| A | 162850 | 1573 | 0.965920% |
| B | 162845 | 1671 | 1.026129% |
| C | 162803 | 11703 | 7.188442% |
| D | 162832 | 3584 | 2.201042% |
Noise dominated data is calculated using 1-second bins in cleaned event files. If a bin has >2000 counts, and if more than 50% of those come from <1% of pixels, then it is considered to be noise-dominated and hence unusable.
| Quadrant | # 1 sec bins | Bins with >0 counts | Bins with >2000 counts | High rate bins dominated by noise | Noise dominated (total time) | Noise dominated (detector-on time) | Marked lightcurve |
|---|---|---|---|---|---|---|---|
| A | 201666 | 162887 | 0 | 0 | 0.00% | 0.00% | 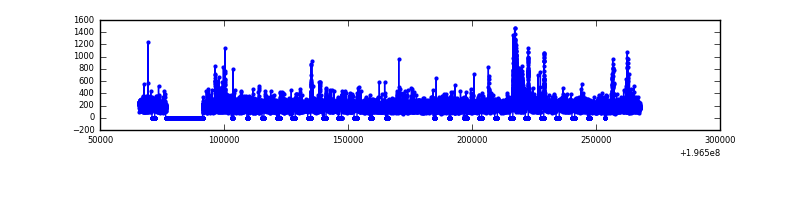 |
| B | 201666 | 162880 | 0 | 0 | 0.00% | 0.00% |  |
| C | 201666 | 162837 | 0 | 0 | 0.00% | 0.00% |  |
| D | 201666 | 162793 | 0 | 0 | 0.00% | 0.00% |  |
Top three noisy pixels from each quadrant. If the there are fewer than three noisy pixels in the level2.evt file, extra rows are filled as -1
| Pixel properties | Quadrant properties | ||||||
|---|---|---|---|---|---|---|---|
| Quadrant | DetID | PixID | Counts | Sigma | Mean | Median | Sigma |
| A | 14 | 188 | 8364 | 10.98 | 2218 | 2073 | 573.1 |
| A | 0 | 29 | 8019 | 10.38 | 2218 | 2073 | 573.1 |
| A | 14 | 204 | 7336 | 9.18 | 2218 | 2073 | 573.1 |
| B | 2 | 9 | 7504 | 12.91 | 2197 | 2095 | 419.1 |
| B | 12 | 226 | 6432 | 10.35 | 2197 | 2095 | 419.1 |
| B | 14 | 254 | 6010 | 9.34 | 2197 | 2095 | 419.1 |
| C | 7 | 111 | 5728 | 6.49 | 2156 | 1991 | 576.1 |
| C | 1 | 80 | 5392 | 5.9 | 2156 | 1991 | 576.1 |
| C | 2 | 191 | 5371 | 5.87 | 2156 | 1991 | 576.1 |
| D | 3 | 14 | 5410 | 6.28 | 2036 | 1847 | 567.6 |
| D | 11 | 82 | 5338 | 6.15 | 2036 | 1847 | 567.6 |
| D | 4 | 160 | 5246 | 5.99 | 2036 | 1847 | 567.6 |
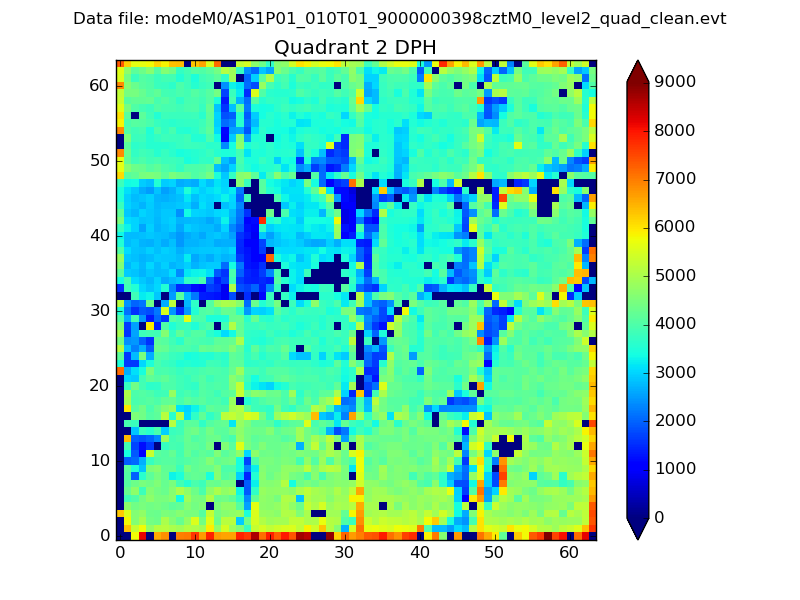
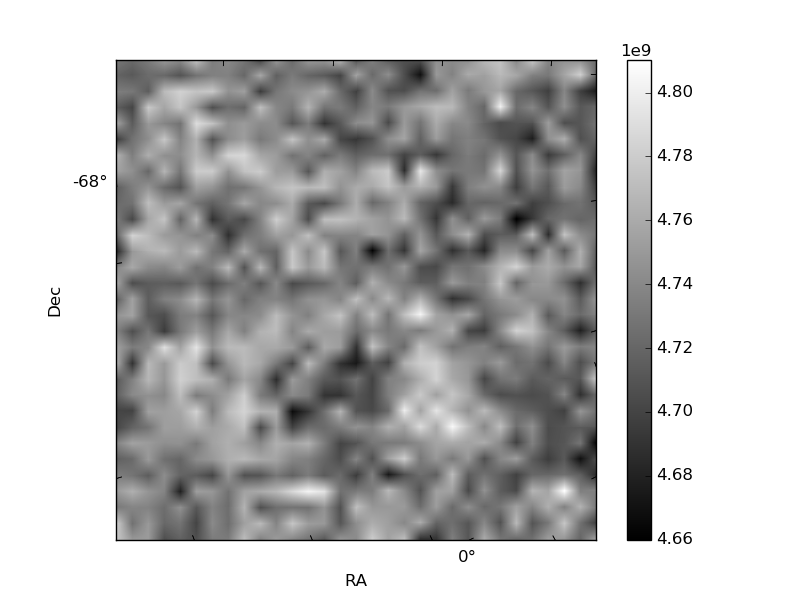
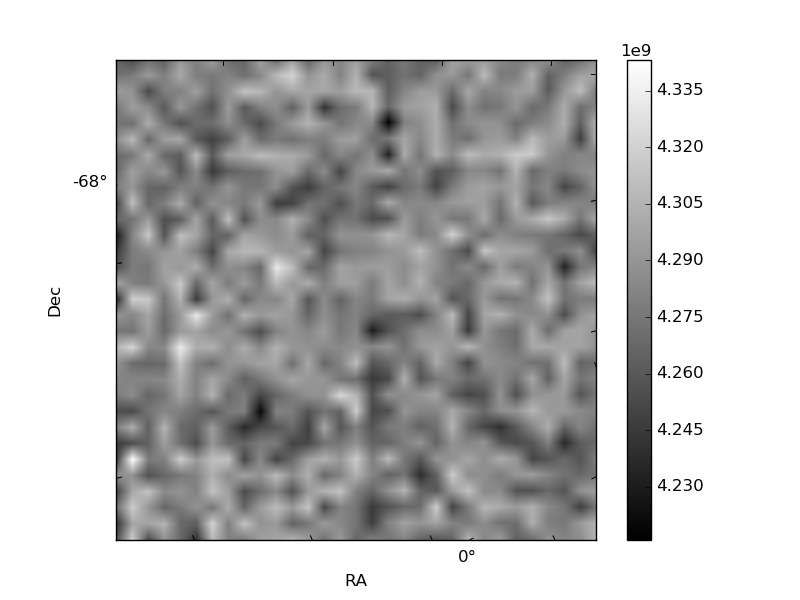
Histogram calculated using DETX and DETY for each event in the final _common_clean file
| Quadrant A |  |
 |
Quadrant B |
|---|---|---|---|
| Quadrant D | 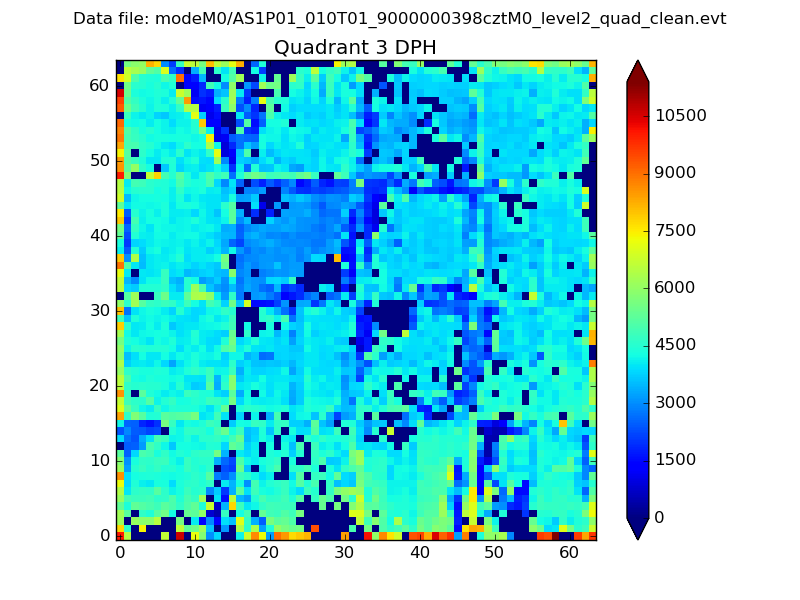 |
 |
Quadrant C |
| Plot type | Count rate plots | Images |
|---|---|---|
| Comparison with Poisson distribution Blue bars denote a histogram of data divided into 1 sec bins. Red curve is a Poisson curve with rate = median count rate of data. |
 |
 |
| Quadrant-wise count rates Data is divided into 100 sec bins |
 |
|
| Module-wise count rates for Quadrant A Data is divided into 100 sec bins |
 |
 |
| Module-wise count rates for Quadrant B Data is divided into 100 sec bins |
 |
 |
| Module-wise count rates for Quadrant C Data is divided into 100 sec bins |
 |
 |
| Module-wise count rates for Quadrant D Data is divided into 100 sec bins |
 |
 |
| Parameter | Plot |
|---|---|
| CZT HV Monitor |  |
| D_VDD |  |
| Temperature 1 | 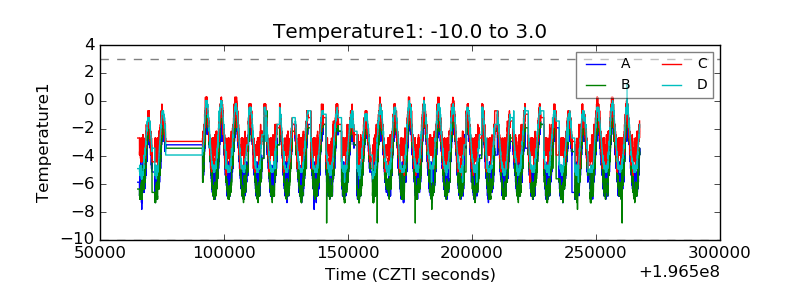 |
| Veto HV Monitor | 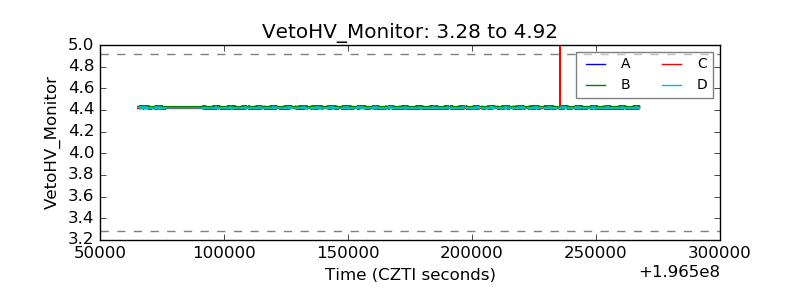 |
| Veto LLD |  |
| Alpha Counter |  |
| _CPM_Rate |  |
| CZT Counter | 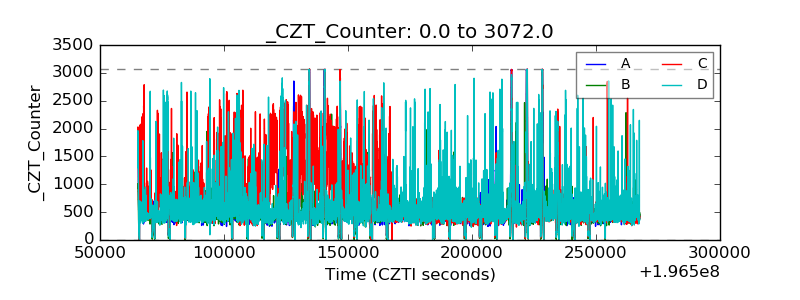 |
| +2.5 Volts monitor |  |
| +5 Volts monitor |  |
| _ROLL_ROT |  |
| _Roll_DEC |  |
| _Roll_RA |  |
| Veto Counter |  |