| Param | Original file | Final file |
|---|---|---|
| Filename | modeM0/AS1P01_010T01_9000000398_02652cztM0_level2.evt | modeM0/AS1P01_010T01_9000000398_02652cztM0_level2_quad_clean.evt |
| Size (bytes) | 503,588,160 | 108,529,920 |
| Size | 480.3 MB | 103.5 MB |
| Events in quadrant A | 3,045,732 | 713,143 |
| Events in quadrant B | 3,154,519 | 718,544 |
| Events in quadrant C | 4,958,602 | 688,810 |
| Events in quadrant D | 3,620,955 | 677,361 |
Noise dominated data is calculated using 1-second bins in cleaned event files. If a bin has >2000 counts, and if more than 50% of those come from <1% of pixels, then it is considered to be noise-dominated and hence unusable.
| Quadrant | # 1 sec bins | Bins with >0 counts | Bins with >2000 counts | High rate bins dominated by noise | Noise dominated (total time) | Noise dominated (detector-on time) | Marked lightcurve |
|---|---|---|---|---|---|---|---|
| A | 7230 | 7026 | 0 | 0 | 0.00% | 0.00% | 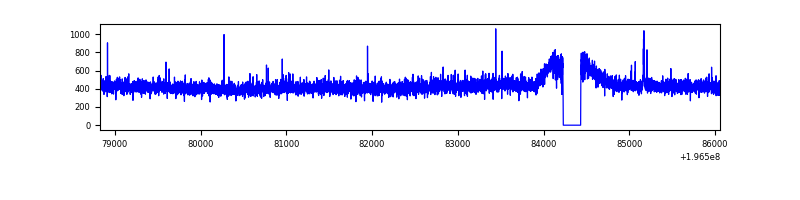 |
| B | 7229 | 7025 | 3 | 3 | 0.04% | 0.04% | 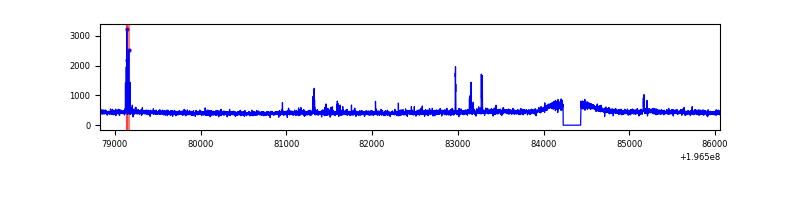 |
| C | 7229 | 7025 | 44 | 44 | 0.61% | 0.63% | 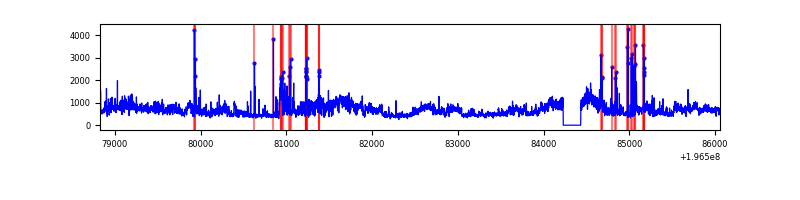 |
| D | 7229 | 7025 | 74 | 74 | 1.02% | 1.05% | 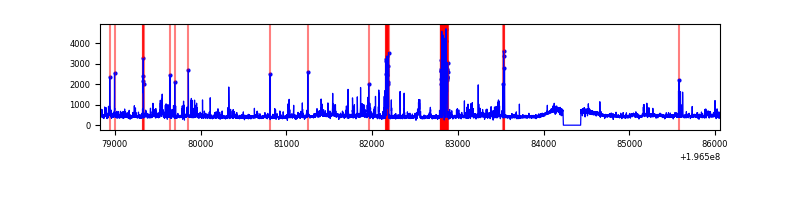 |
Top three noisy pixels from each quadrant. If the there are fewer than three noisy pixels in the level2.evt file, extra rows are filled as -1
| Pixel properties | Quadrant properties | ||||||
|---|---|---|---|---|---|---|---|
| Quadrant | DetID | PixID | Counts | Sigma | Mean | Median | Sigma |
| A | 8 | 15 | 10978 | 63.09 | 786 | 764 | 161.9 |
| A | 0 | 226 | 8772 | 49.47 | 786 | 764 | 161.9 |
| A | 12 | 194 | 8635 | 48.62 | 786 | 764 | 161.9 |
| B | 10 | 244 | 44940 | 292.03 | 794 | 773 | 151.2 |
| B | 0 | 191 | 12700 | 78.86 | 794 | 773 | 151.2 |
| B | 15 | 186 | 12607 | 78.25 | 794 | 773 | 151.2 |
| C | 9 | 70 | 1940589 | 10977.47 | 757 | 755 | 176.7 |
| C | 8 | 112 | 28766 | 158.51 | 757 | 755 | 176.7 |
| C | 8 | 128 | 12403 | 65.91 | 757 | 755 | 176.7 |
| D | 2 | 54 | 293461 | 1631.32 | 755 | 736 | 179.4 |
| D | 2 | 255 | 212720 | 1181.36 | 755 | 736 | 179.4 |
| D | 2 | 184 | 86994 | 480.7 | 755 | 736 | 179.4 |
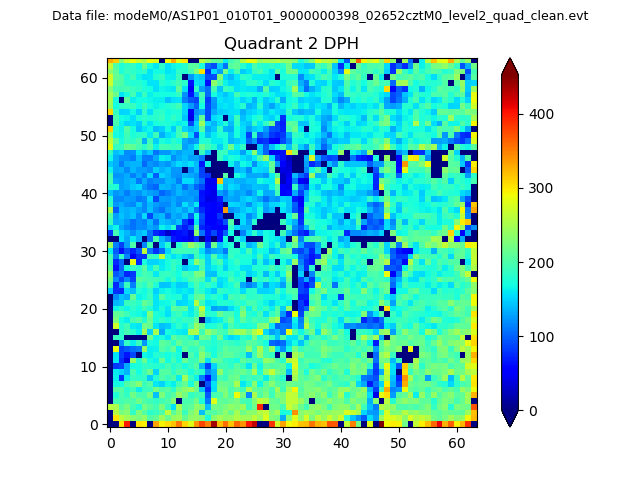
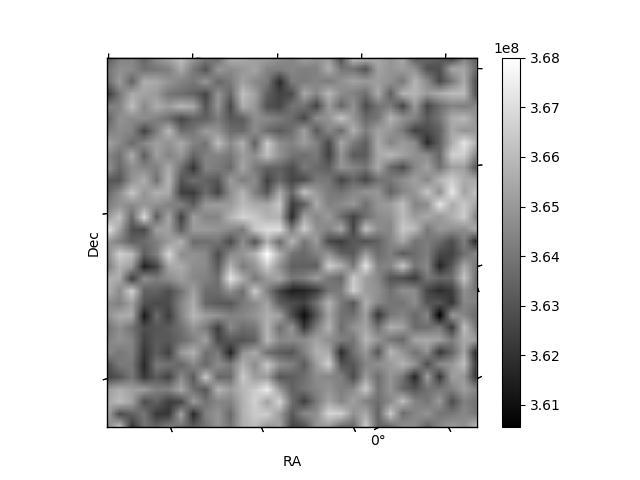
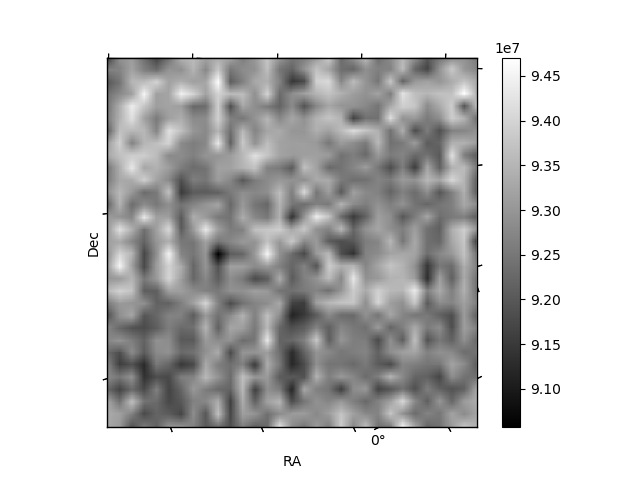
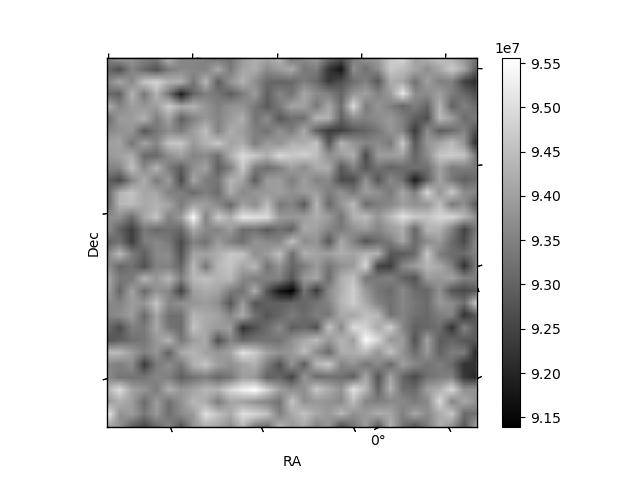
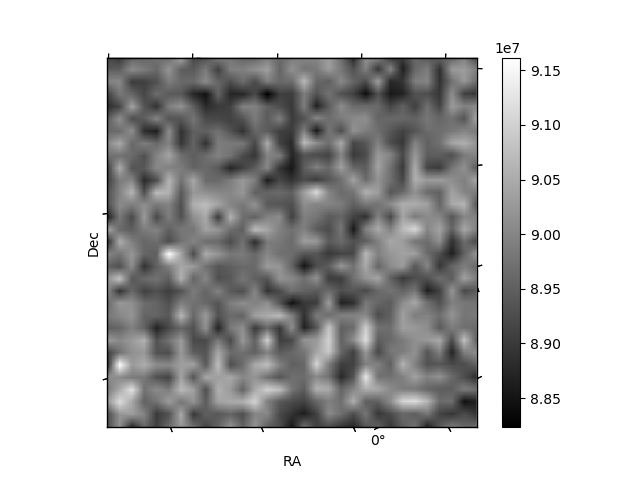
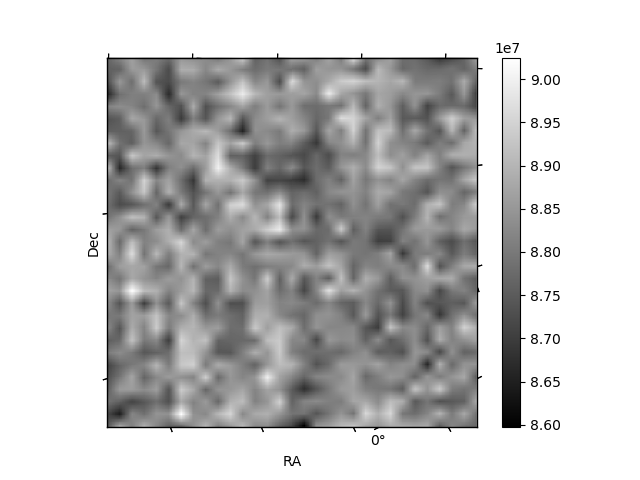
Histogram calculated using DETX and DETY for each event in the final _common_clean file
| Quadrant A | 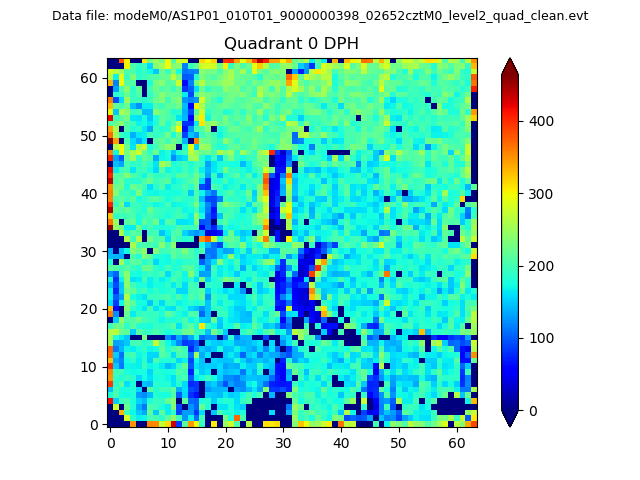 |
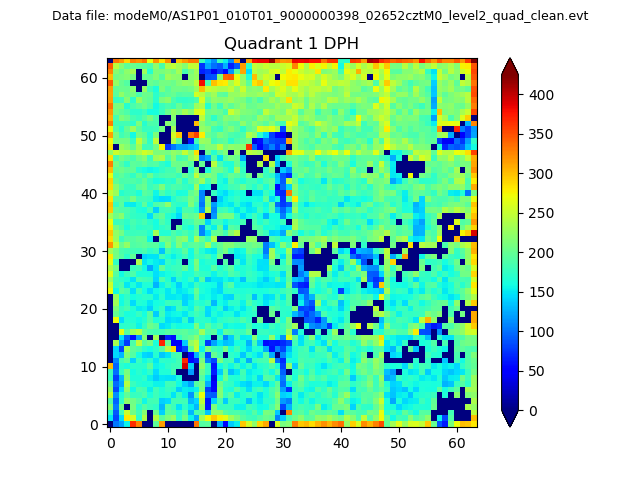 |
Quadrant B |
|---|---|---|---|
| Quadrant D | 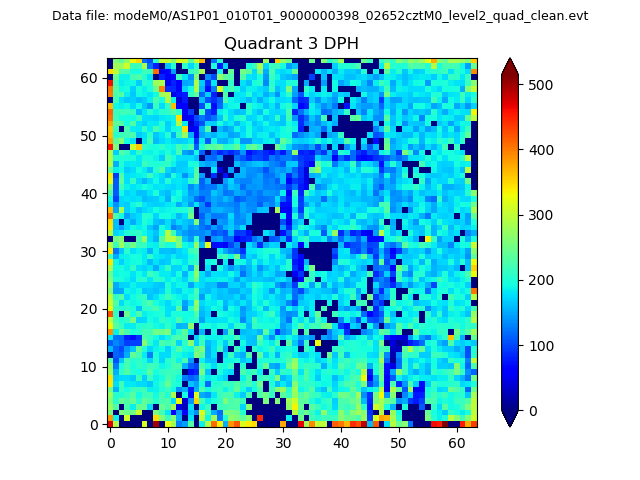 |
 |
Quadrant C |
| Plot type | Count rate plots | Images |
|---|---|---|
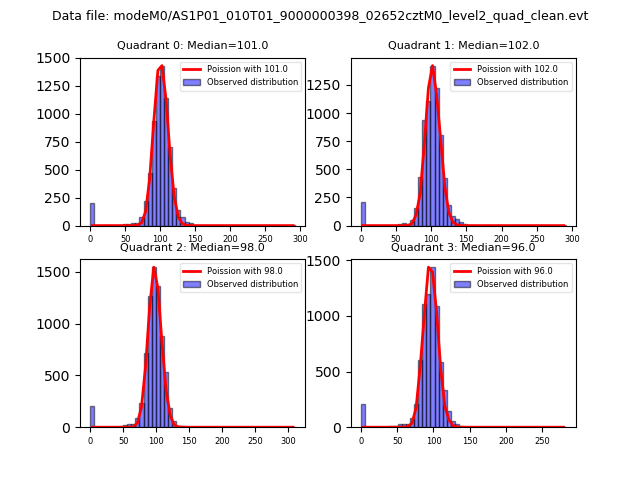
| Comparison with Poisson distribution Blue bars denote a histogram of data divided into 1 sec bins. Red curve is a Poisson curve with rate = median count rate of data. |
 |
 |
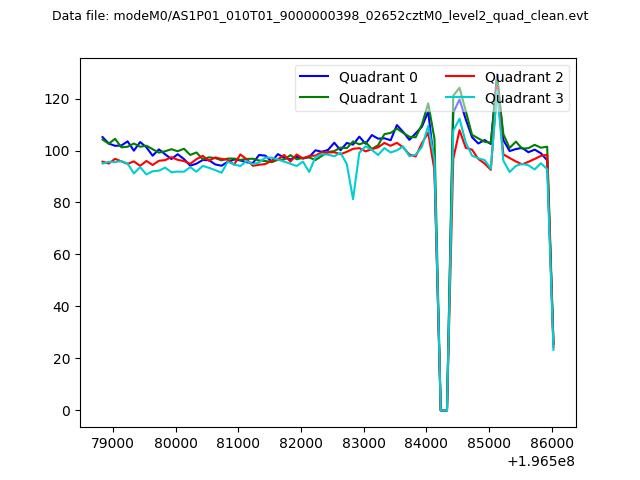
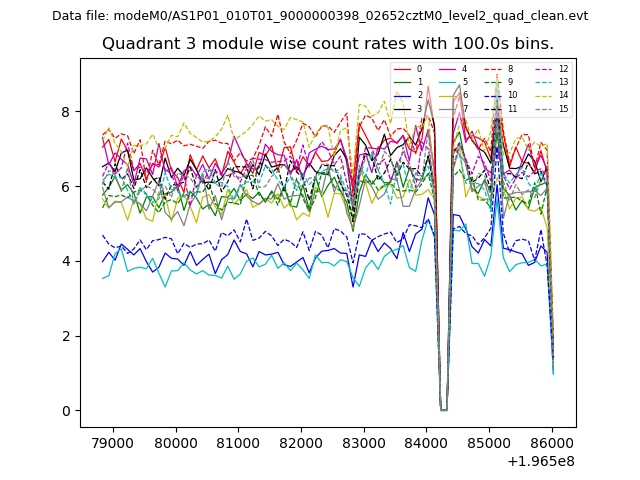
| Quadrant-wise count rates Data is divided into 100 sec bins |
 |
|
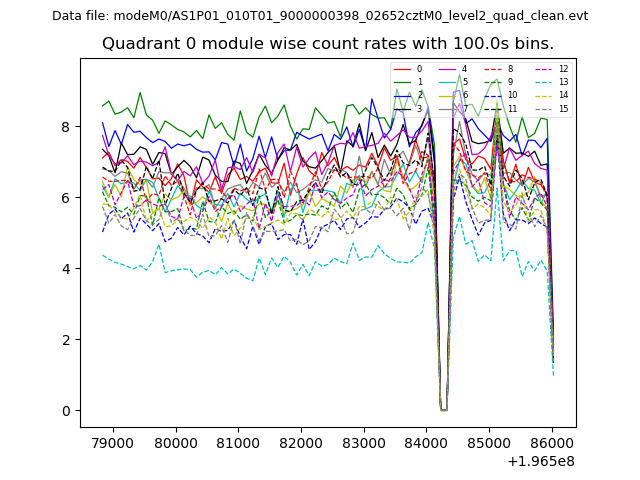
| Module-wise count rates for Quadrant A Data is divided into 100 sec bins |
 |
 |
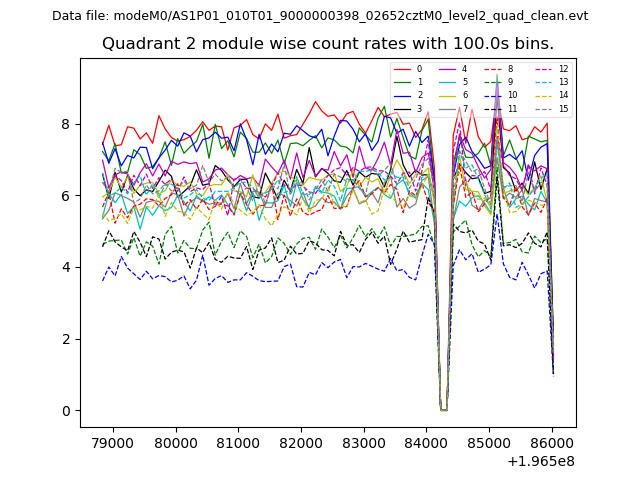
| Module-wise count rates for Quadrant B Data is divided into 100 sec bins |
 |
 |
| Module-wise count rates for Quadrant C Data is divided into 100 sec bins |
 |
 |
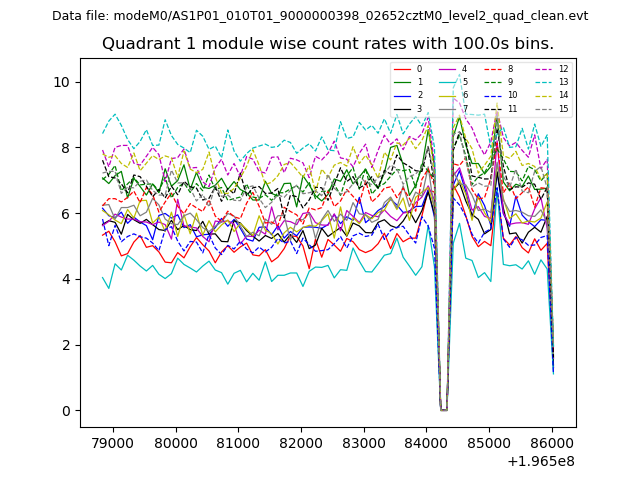
| Module-wise count rates for Quadrant D Data is divided into 100 sec bins |
 |
 |
| Parameter | Plot |
|---|---|
| CZT HV Monitor |  |
| D_VDD | 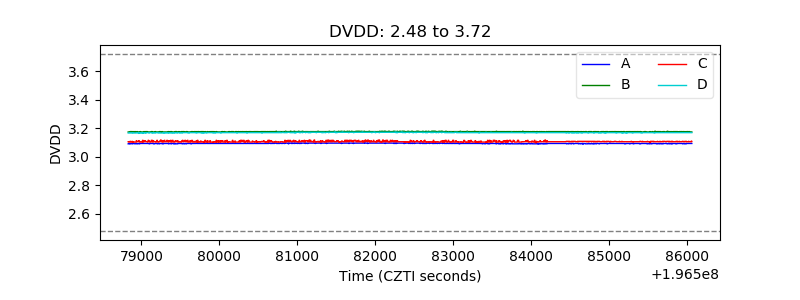 |
| Temperature 1 | 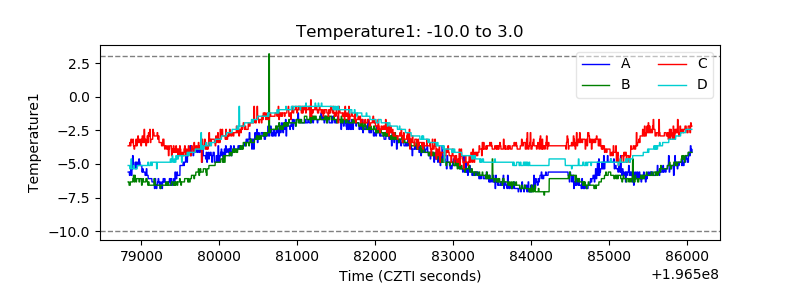 |
| Veto HV Monitor | 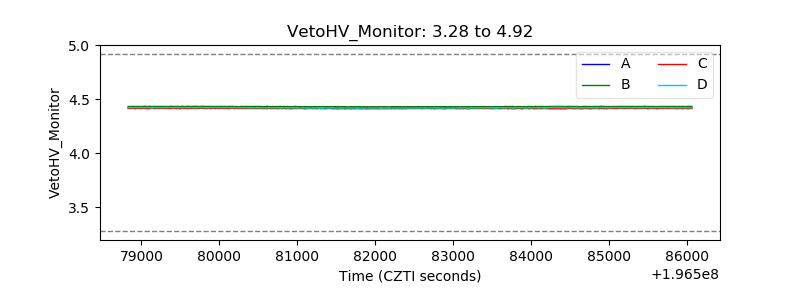 |
| Veto LLD | 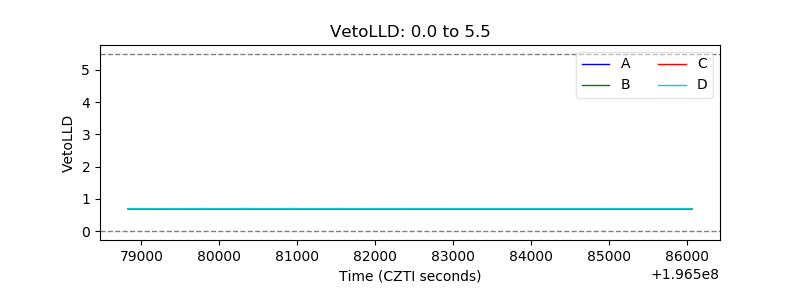 |
| Alpha Counter | 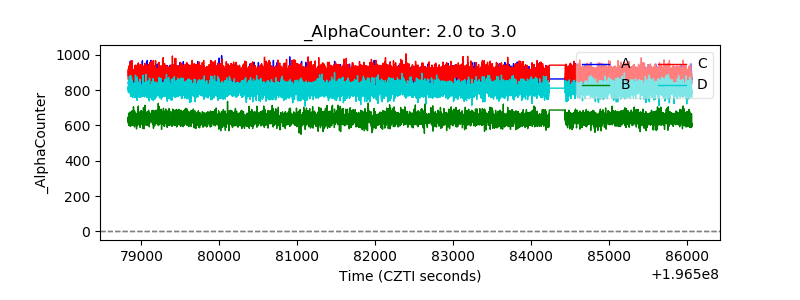 |
| _CPM_Rate | 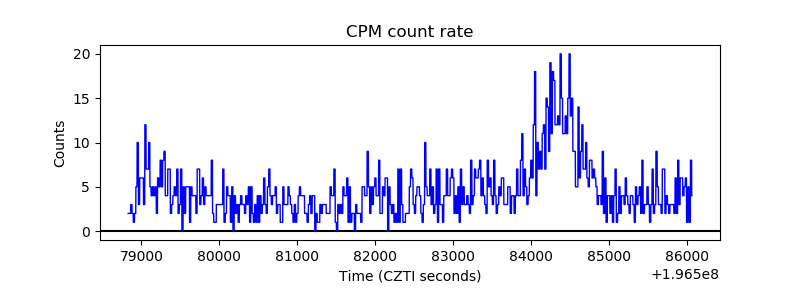 |
| CZT Counter | 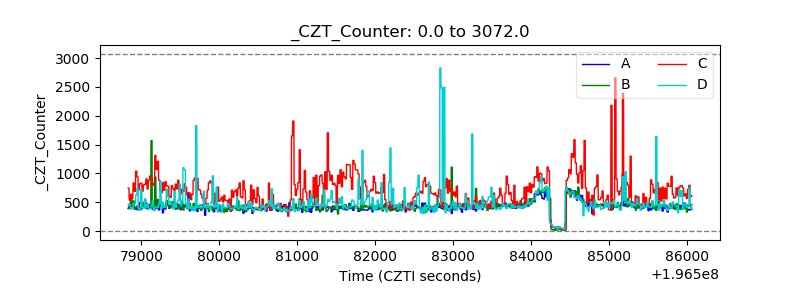 |
| +2.5 Volts monitor |  |
| +5 Volts monitor |  |
| _ROLL_ROT | 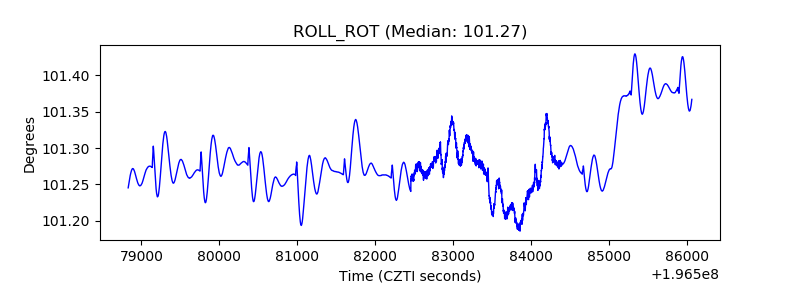 |
| _Roll_DEC | 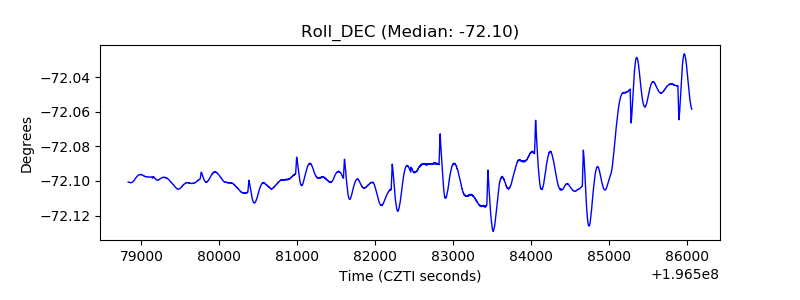 |
| _Roll_RA | 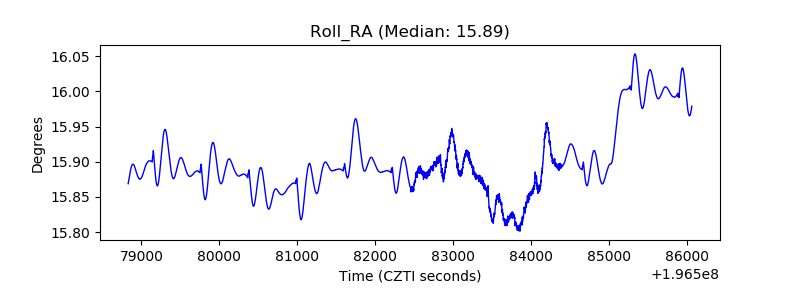 |
| Veto Counter | 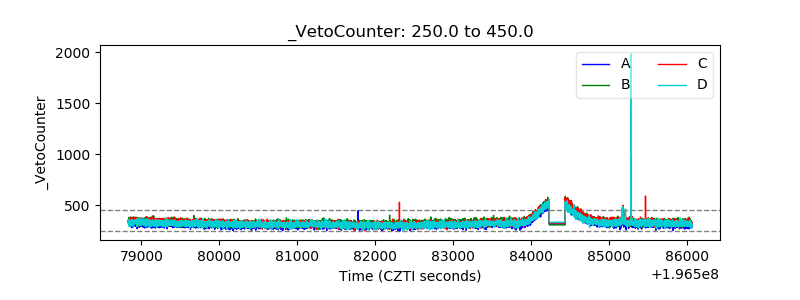 |