| Param | Original file | Final file |
|---|---|---|
| Filename | modeM0/AS1P01_010T01_9000000398_02657cztM0_level2.evt | modeM0/AS1P01_010T01_9000000398_02657cztM0_level2_quad_clean.evt |
| Size (bytes) | 2,355,857,280 | 498,142,080 |
| Size | 2.2 GB | 475.1 MB |
| Events in quadrant A | 12,689,026 | 3,340,961 |
| Events in quadrant B | 13,076,037 | 3,379,594 |
| Events in quadrant C | 26,892,345 | 3,185,626 |
| Events in quadrant D | 16,710,835 | 3,163,839 |
| Mode M9 | |||
|---|---|---|---|
| Quadrant | BADHDUFLAG | Total packets | Discarded packets |
| A | 0 | 27 | 0 |
| B | 0 | 27 | 0 |
| C | 0 | 27 | 0 |
| D | 0 | 27 | 0 |
| Mode SS | |||
|---|---|---|---|
| Quadrant | BADHDUFLAG | Total packets | Discarded packets |
| A | 0 | 598 | 0 |
| B | 0 | 598 | 0 |
| C | 0 | 598 | 0 |
| D | 0 | 598 | 0 |
| Mode M0 | |||
|---|---|---|---|
| Quadrant | BADHDUFLAG | Total packets | Discarded packets |
| A | 0 | 59674 | 6 |
| B | 0 | 60359 | 5 |
| C | 0 | 100850 | 5 |
| D | 0 | 70981 | 8 |
| Quadrant | Total seconds | Saturated seconds | Saturation percentage |
|---|---|---|---|
| A | 29354 | 466 | 1.587518% |
| B | 29354 | 457 | 1.556858% |
| C | 29354 | 2287 | 7.791102% |
| D | 29353 | 976 | 3.325043% |
Noise dominated data is calculated using 1-second bins in cleaned event files. If a bin has >2000 counts, and if more than 50% of those come from <1% of pixels, then it is considered to be noise-dominated and hence unusable.
| Quadrant | # 1 sec bins | Bins with >0 counts | Bins with >2000 counts | High rate bins dominated by noise | Noise dominated (total time) | Noise dominated (detector-on time) | Marked lightcurve |
|---|---|---|---|---|---|---|---|
| A | 44525 | 29360 | 0 | 0 | 0.00% | 0.00% | 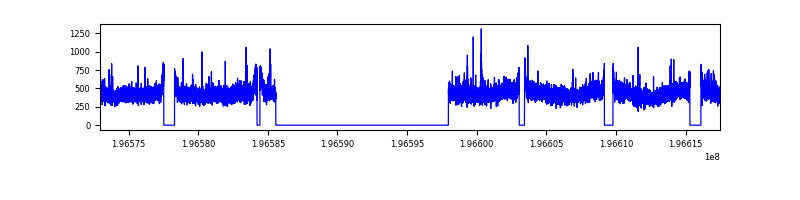 |
| B | 44525 | 29360 | 6 | 6 | 0.01% | 0.02% | 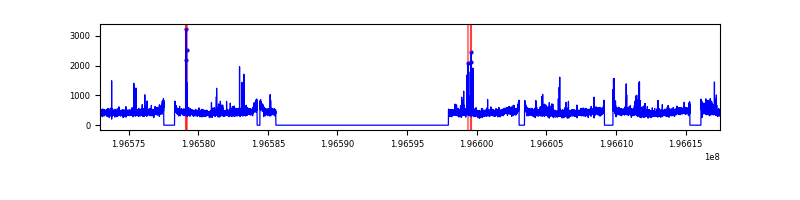 |
| C | 44525 | 29360 | 985 | 985 | 2.21% | 3.35% | 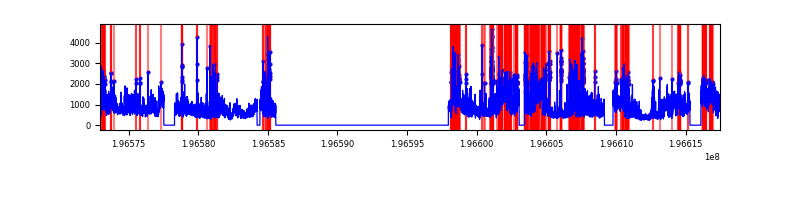 |
| D | 44525 | 29358 | 506 | 506 | 1.14% | 1.72% | 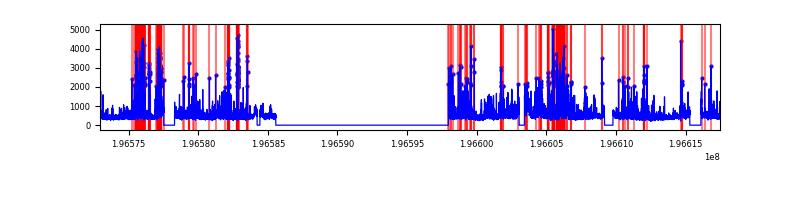 |
Top three noisy pixels from each quadrant. If the there are fewer than three noisy pixels in the level2.evt file, extra rows are filled as -1
| Pixel properties | Quadrant properties | ||||||
|---|---|---|---|---|---|---|---|
| Quadrant | DetID | PixID | Counts | Sigma | Mean | Median | Sigma |
| A | 8 | 15 | 103913 | 153.24 | 3254 | 3176 | 657.4 |
| A | 12 | 194 | 36265 | 50.33 | 3254 | 3176 | 657.4 |
| A | 0 | 226 | 35818 | 49.65 | 3254 | 3176 | 657.4 |
| B | 15 | 85 | 98348 | 153.91 | 3291 | 3203 | 618.2 |
| B | 14 | 167 | 78191 | 121.31 | 3291 | 3203 | 618.2 |
| B | 10 | 244 | 66558 | 102.49 | 3291 | 3203 | 618.2 |
| C | 9 | 70 | 14328934 | 20164.27 | 3083 | 3088 | 710.5 |
| C | 14 | 223 | 291660 | 406.18 | 3083 | 3088 | 710.5 |
| C | 8 | 112 | 58881 | 78.53 | 3083 | 3088 | 710.5 |
| D | 2 | 255 | 1568445 | 2123.34 | 3106 | 3026 | 737.2 |
| D | 2 | 184 | 1104141 | 1493.55 | 3106 | 3026 | 737.2 |
| D | 13 | 223 | 990234 | 1339.05 | 3106 | 3026 | 737.2 |
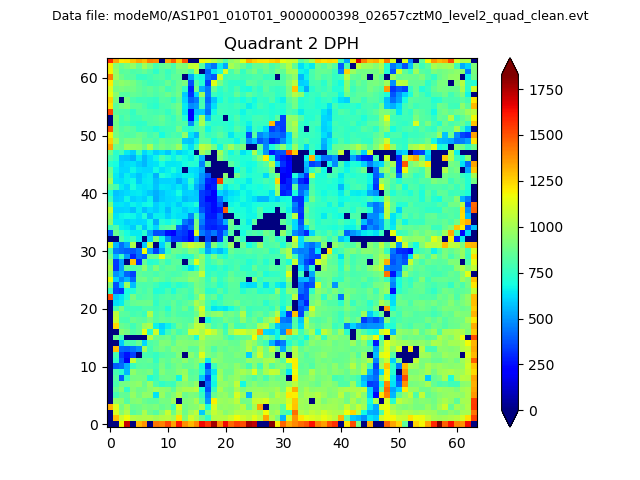
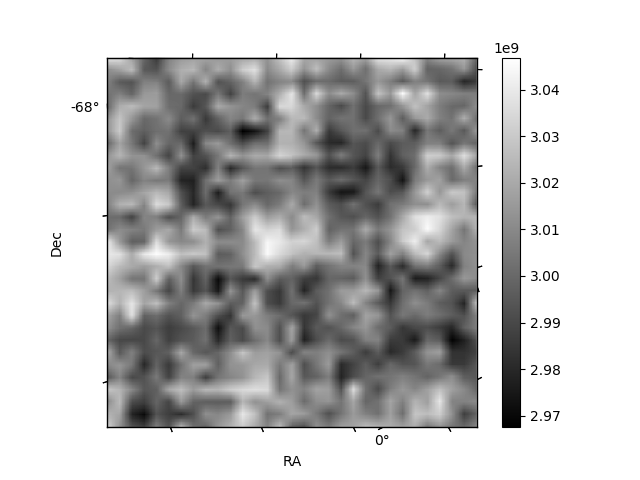
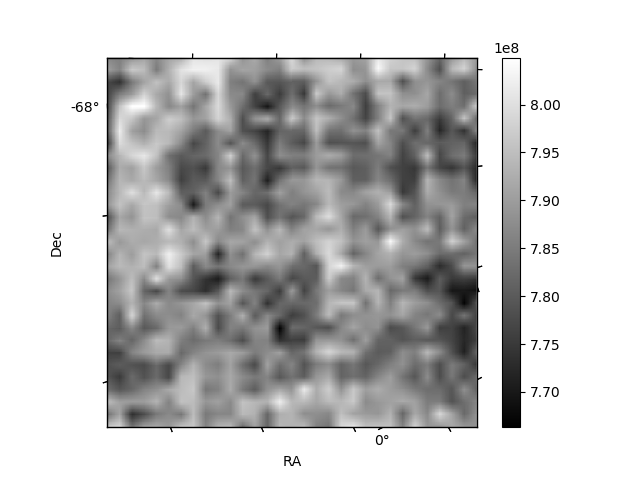
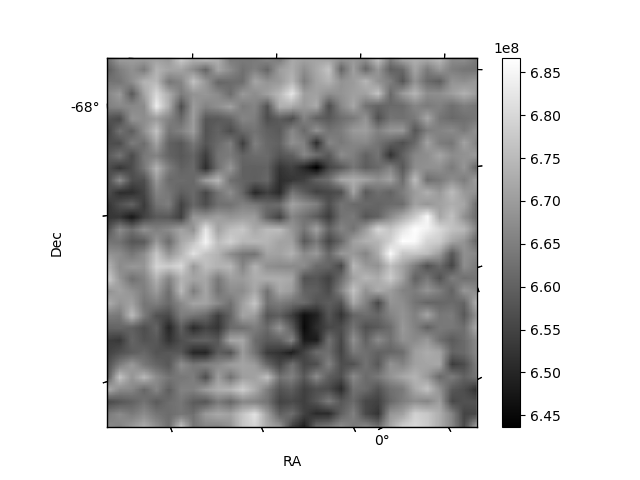
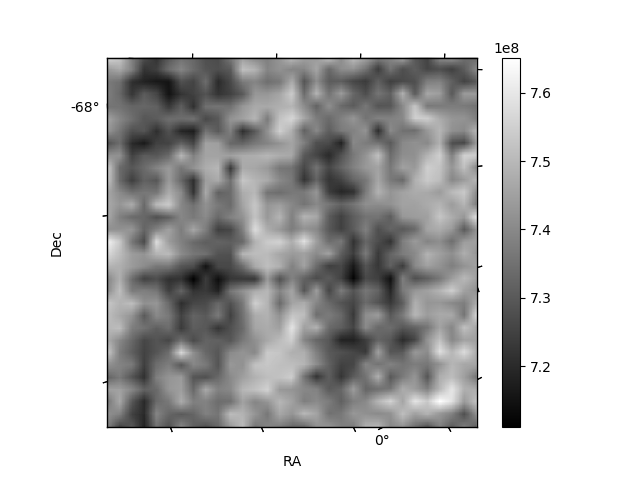
Histogram calculated using DETX and DETY for each event in the final _common_clean file
| Quadrant A | 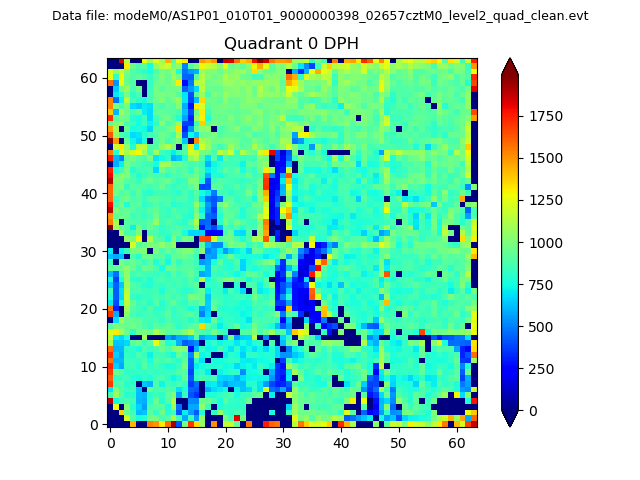 |
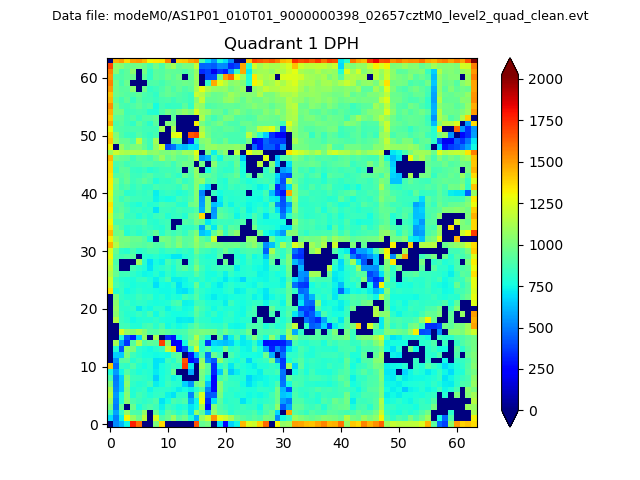 |
Quadrant B |
|---|---|---|---|
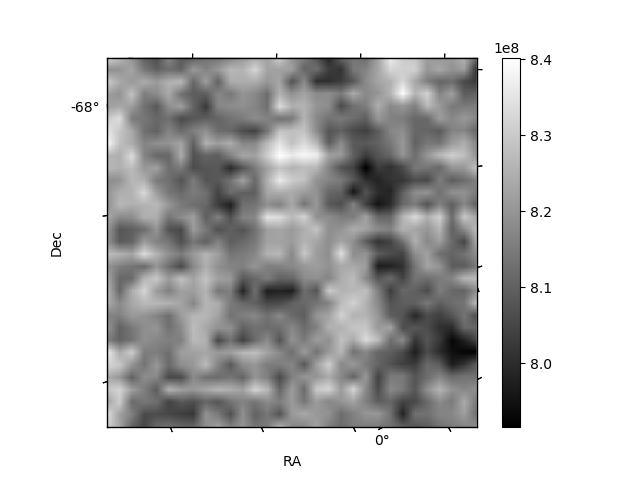
| Quadrant D | 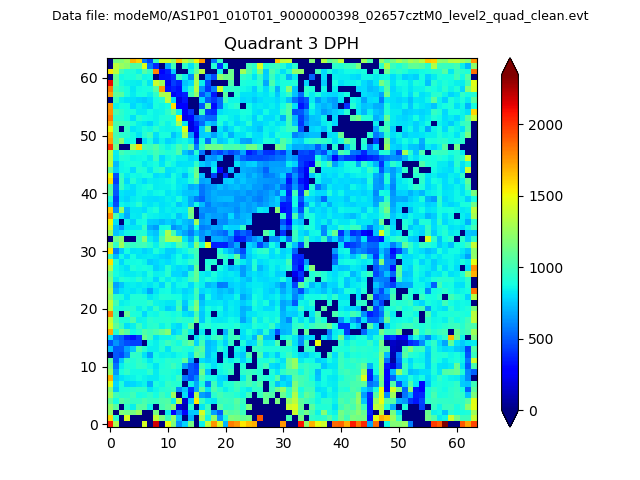 |
 |
Quadrant C |
| Plot type | Count rate plots | Images |
|---|---|---|
| Comparison with Poisson distribution Blue bars denote a histogram of data divided into 1 sec bins. Red curve is a Poisson curve with rate = median count rate of data. |
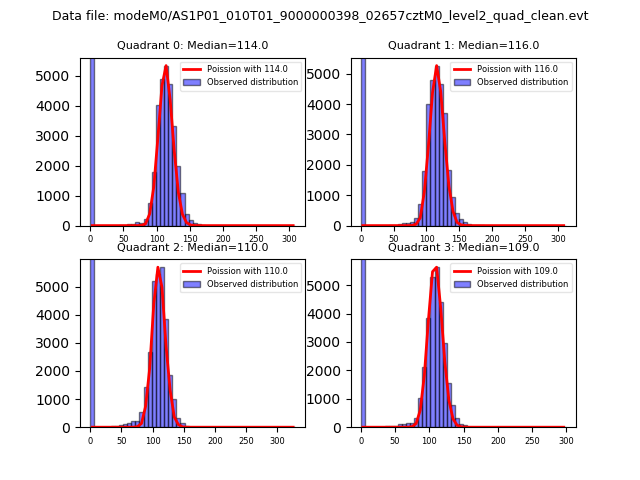 |
 |
| Quadrant-wise count rates Data is divided into 100 sec bins |
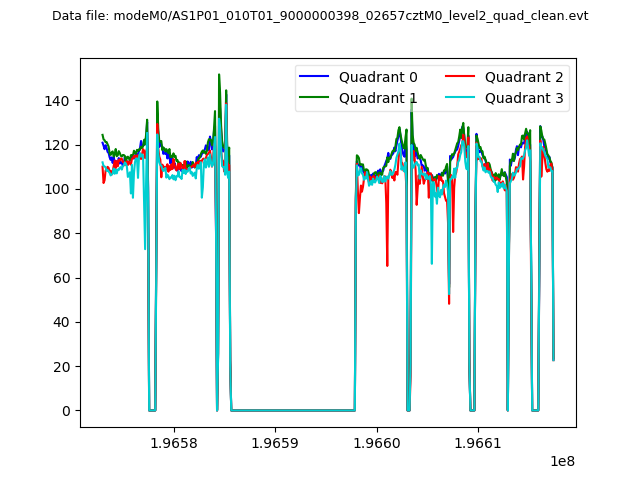 |
|
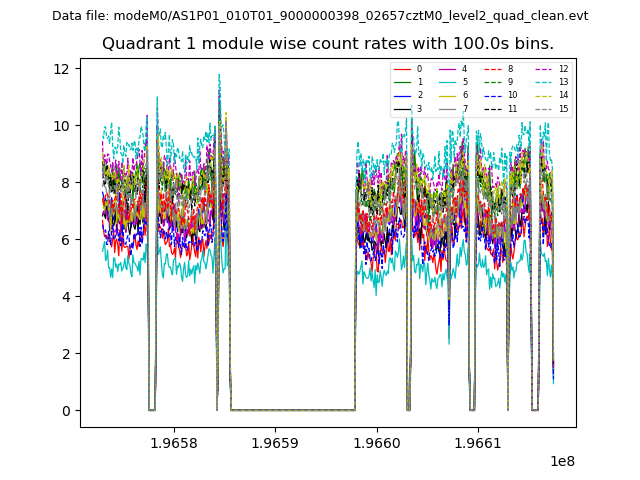
| Module-wise count rates for Quadrant A Data is divided into 100 sec bins |
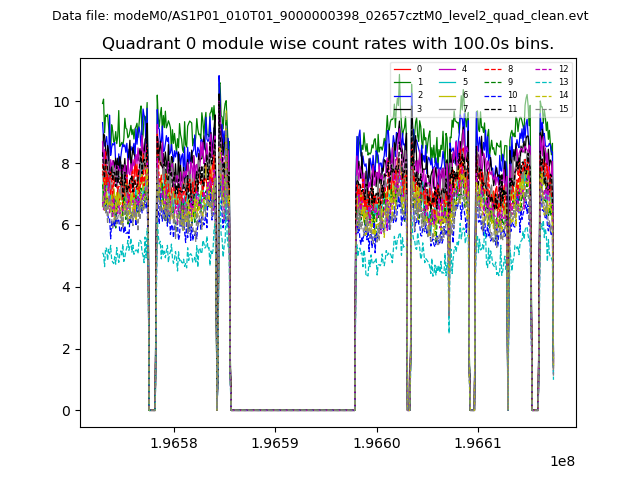 |
 |
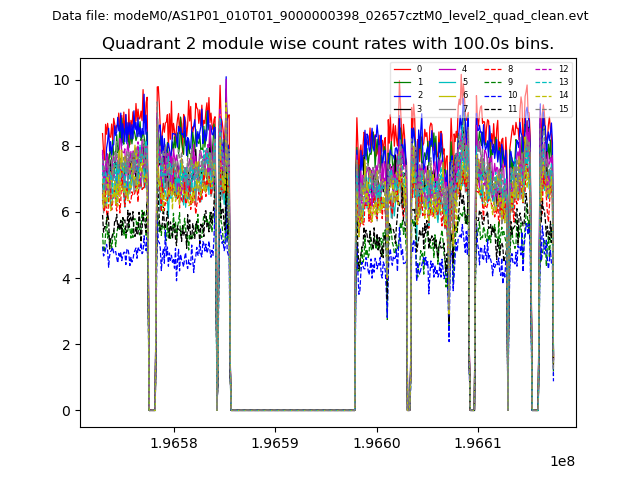
| Module-wise count rates for Quadrant B Data is divided into 100 sec bins |
 |
 |
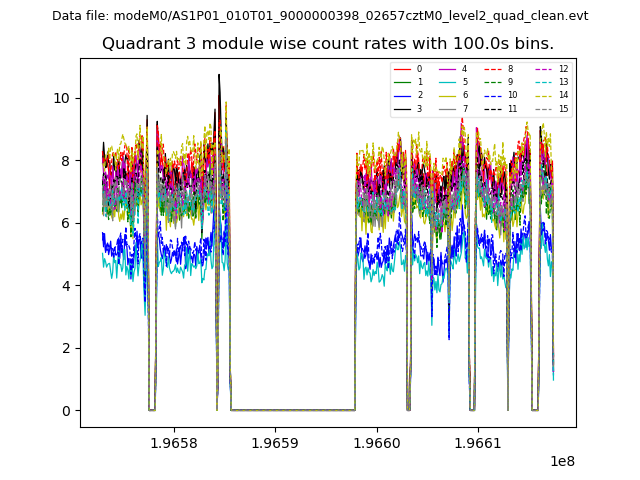
| Module-wise count rates for Quadrant C Data is divided into 100 sec bins |
 |
 |
| Module-wise count rates for Quadrant D Data is divided into 100 sec bins |
 |
 |
| Parameter | Plot |
|---|---|
| CZT HV Monitor | 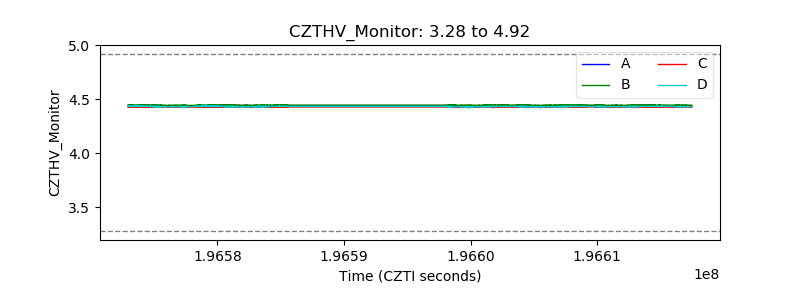 |
| D_VDD | 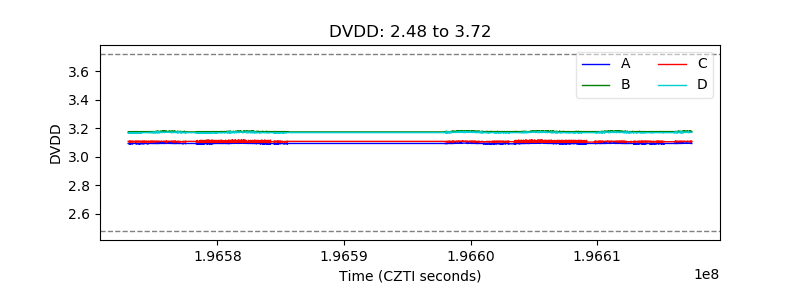 |
| Temperature 1 | 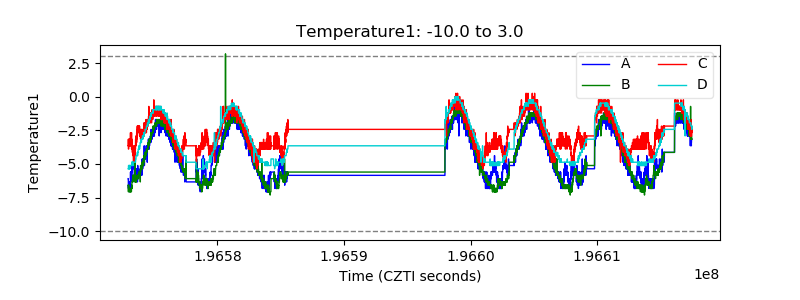 |
| Veto HV Monitor | 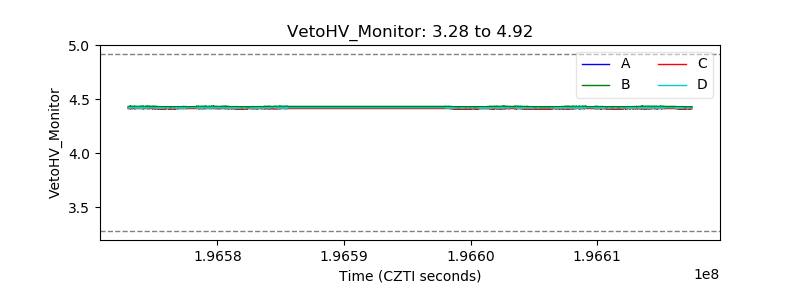 |
| Veto LLD | 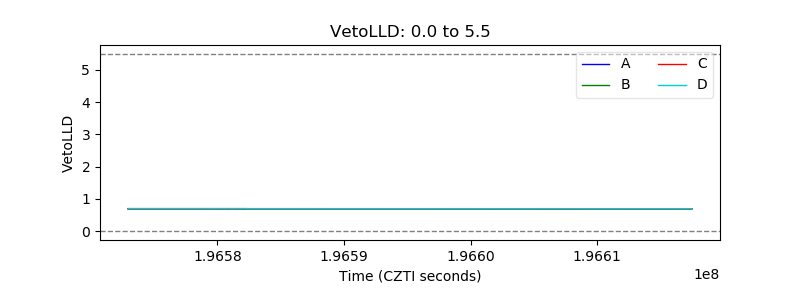 |
| Alpha Counter | 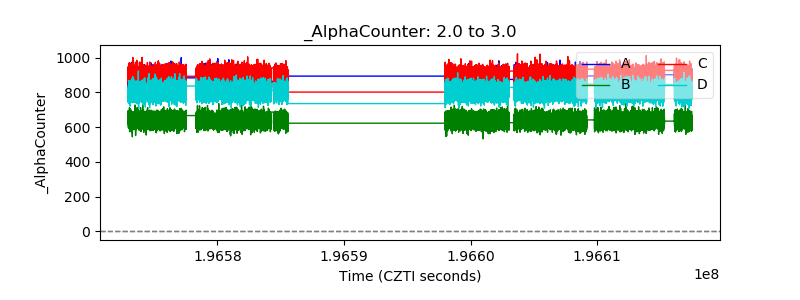 |
| _CPM_Rate | 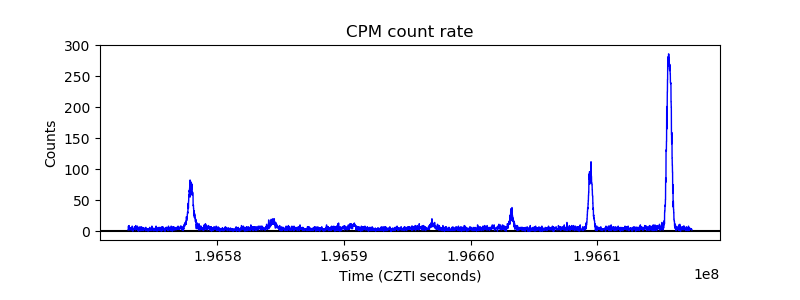 |
| CZT Counter | 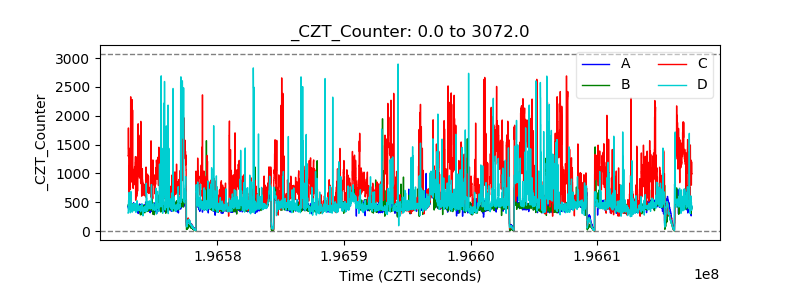 |
| +2.5 Volts monitor |  |
| +5 Volts monitor |  |
| _ROLL_ROT | 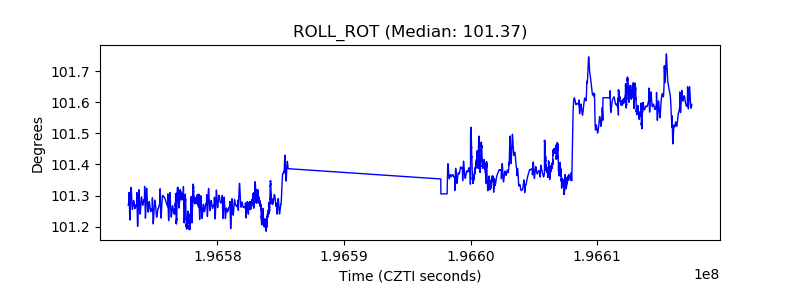 |
| _Roll_DEC | 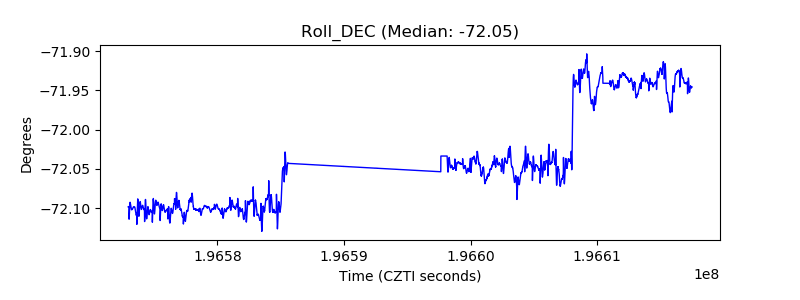 |
| _Roll_RA | 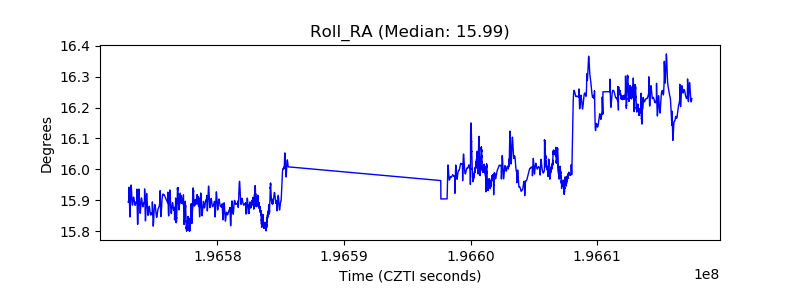 |
| Veto Counter | 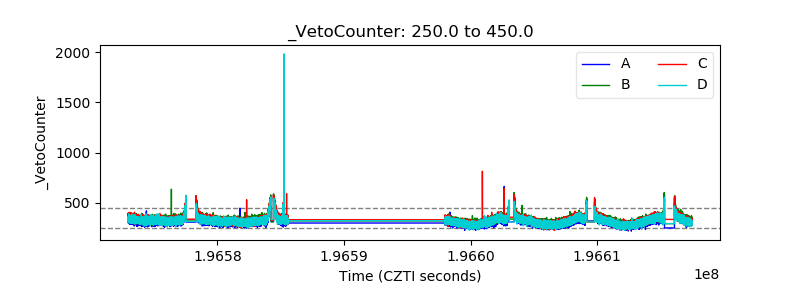 |