| Param | Original file | Final file |
|---|---|---|
| Filename | modeM0/AS1P01_010T01_9000000398_02686cztM0_level2.evt | modeM0/AS1P01_010T01_9000000398_02686cztM0_level2_quad_clean.evt |
| Size (bytes) | 428,883,840 | 96,816,960 |
| Size | 409.0 MB | 92.3 MB |
| Events in quadrant A | 2,972,963 | 618,503 |
| Events in quadrant B | 3,072,335 | 626,943 |
| Events in quadrant C | 3,012,733 | 614,488 |
| Events in quadrant D | 3,466,341 | 596,475 |
| Mode SS | |||
|---|---|---|---|
| Quadrant | BADHDUFLAG | Total packets | Discarded packets |
| A | 0 | 136 | 0 |
| B | 0 | 136 | 0 |
| C | 0 | 136 | 0 |
| D | 0 | 136 | 0 |
| Mode M0 | |||
|---|---|---|---|
| Quadrant | BADHDUFLAG | Total packets | Discarded packets |
| A | 0 | 14009 | 0 |
| B | 0 | 14195 | 0 |
| C | 0 | 14168 | 0 |
| D | 0 | 15200 | 0 |
| Quadrant | Total seconds | Saturated seconds | Saturation percentage |
|---|---|---|---|
| A | 6822 | 142 | 2.081501% |
| B | 6822 | 127 | 1.861624% |
| C | 6822 | 67 | 0.982117% |
| D | 6822 | 126 | 1.846966% |
Noise dominated data is calculated using 1-second bins in cleaned event files. If a bin has >2000 counts, and if more than 50% of those come from <1% of pixels, then it is considered to be noise-dominated and hence unusable.
| Quadrant | # 1 sec bins | Bins with >0 counts | Bins with >2000 counts | High rate bins dominated by noise | Noise dominated (total time) | Noise dominated (detector-on time) | Marked lightcurve |
|---|---|---|---|---|---|---|---|
| A | 6822 | 6822 | 0 | 0 | 0.00% | 0.00% |  |
| B | 6822 | 6822 | 9 | 9 | 0.13% | 0.13% |  |
| C | 6822 | 6822 | 1 | 1 | 0.01% | 0.01% |  |
| D | 6822 | 6822 | 27 | 27 | 0.40% | 0.40% |  |
Top three noisy pixels from each quadrant. If the there are fewer than three noisy pixels in the level2.evt file, extra rows are filled as -1
| Pixel properties | Quadrant properties | ||||||
|---|---|---|---|---|---|---|---|
| Quadrant | DetID | PixID | Counts | Sigma | Mean | Median | Sigma |
| A | 14 | 238 | 16198 | 97.88 | 764 | 745 | 157.9 |
| A | 13 | 9 | 9604 | 56.11 | 764 | 745 | 157.9 |
| A | 12 | 194 | 8537 | 49.36 | 764 | 745 | 157.9 |
| B | 14 | 53 | 36439 | 240.95 | 773 | 751 | 148.1 |
| B | 14 | 167 | 34111 | 225.24 | 773 | 751 | 148.1 |
| B | 15 | 85 | 17552 | 113.44 | 773 | 751 | 148.1 |
| C | 0 | 3 | 70932 | 404.03 | 744 | 745 | 173.7 |
| C | 12 | 4 | 18663 | 103.14 | 744 | 745 | 173.7 |
| C | 13 | 61 | 6691 | 34.23 | 744 | 745 | 173.7 |
| D | 2 | 184 | 279667 | 1592.21 | 736 | 715 | 175.2 |
| D | 12 | 79 | 116720 | 662.13 | 736 | 715 | 175.2 |
| D | 13 | 169 | 96651 | 547.58 | 736 | 715 | 175.2 |
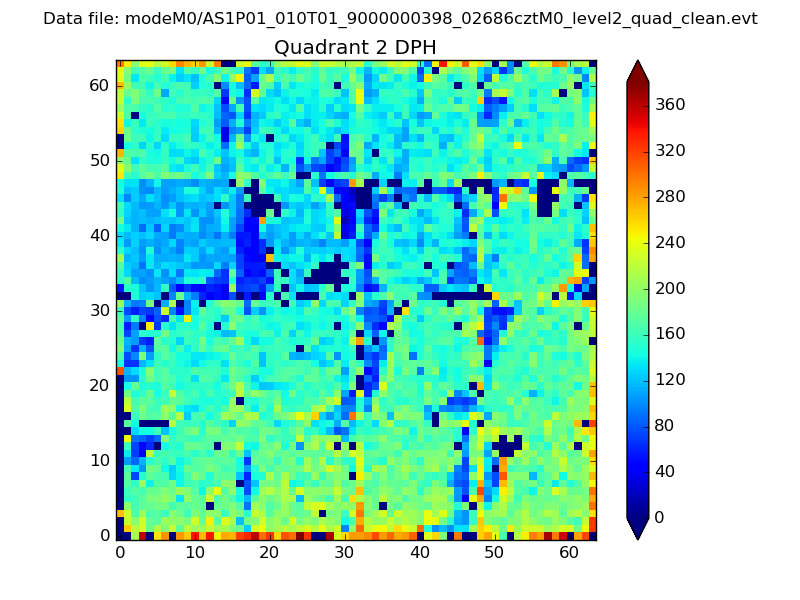
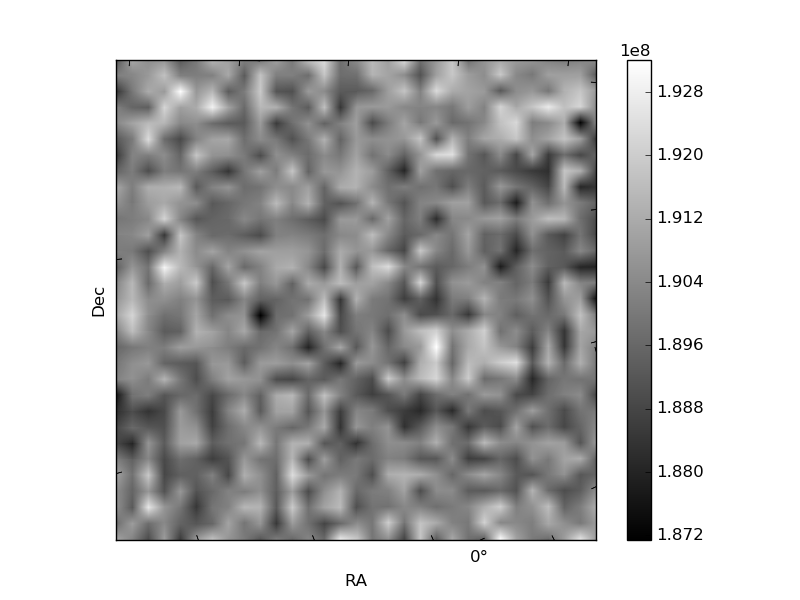
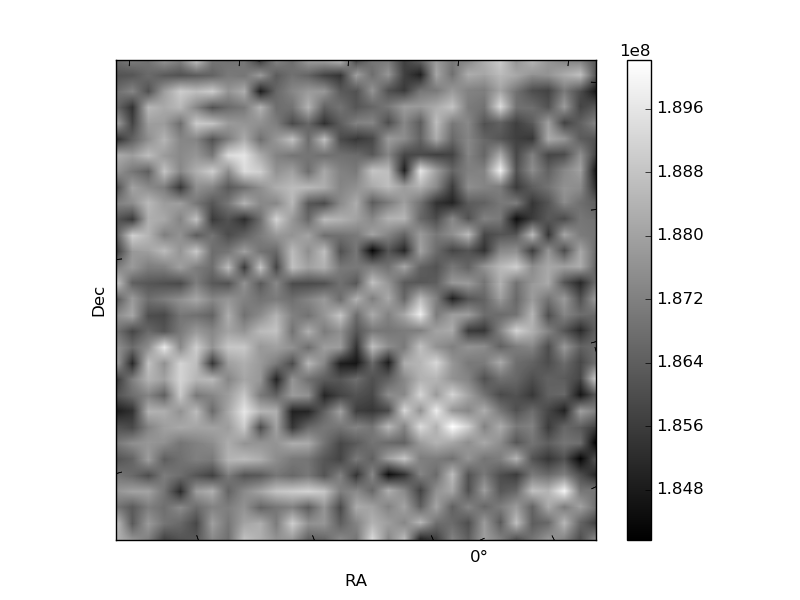
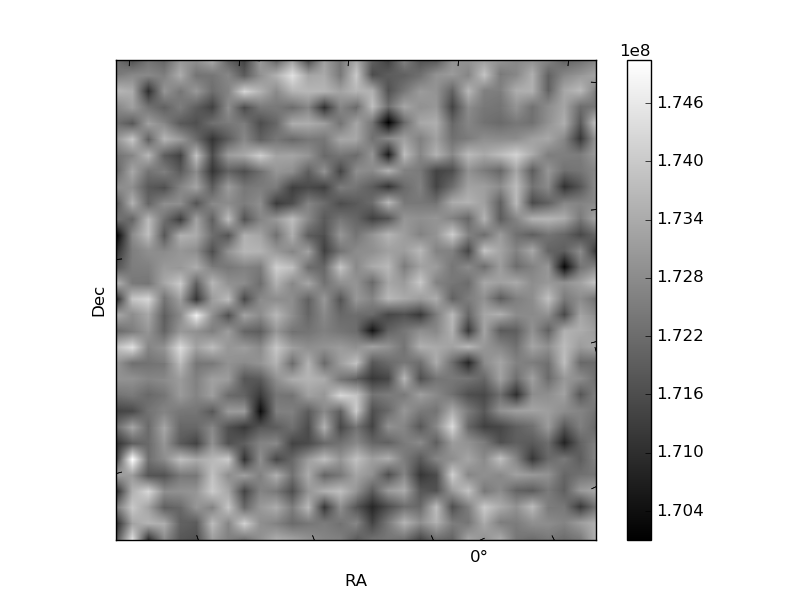
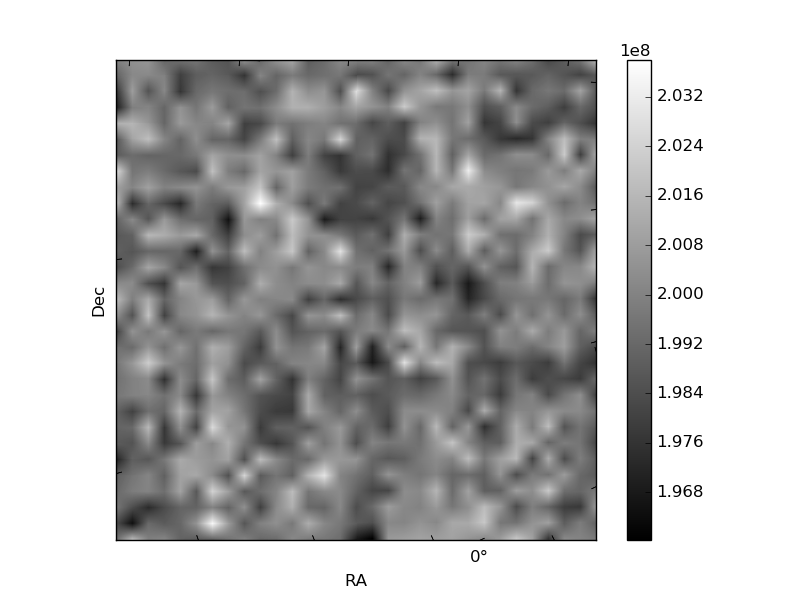
Histogram calculated using DETX and DETY for each event in the final _common_clean file
| Quadrant A | 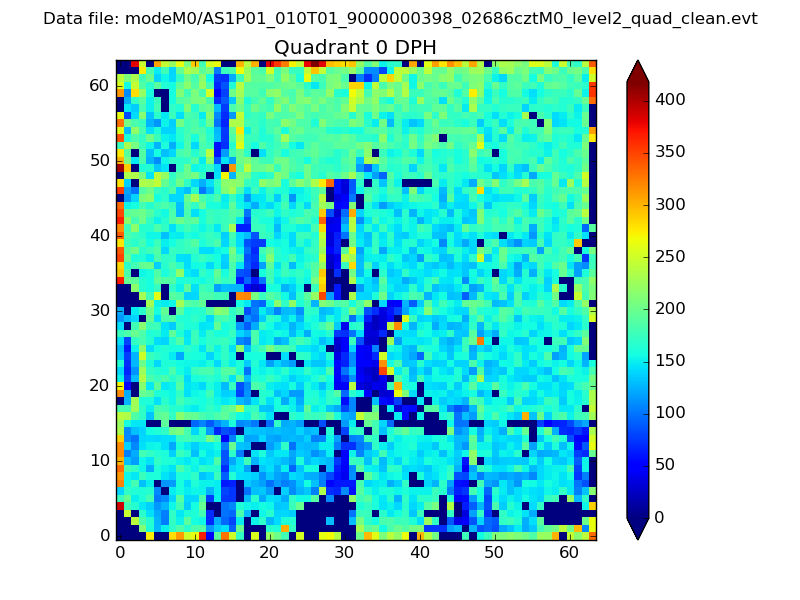 |
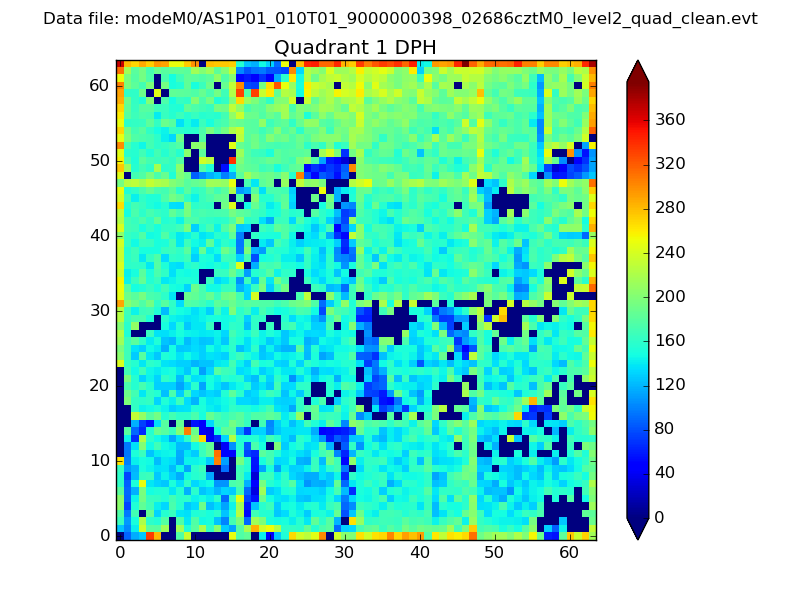 |
Quadrant B |
|---|---|---|---|
| Quadrant D | 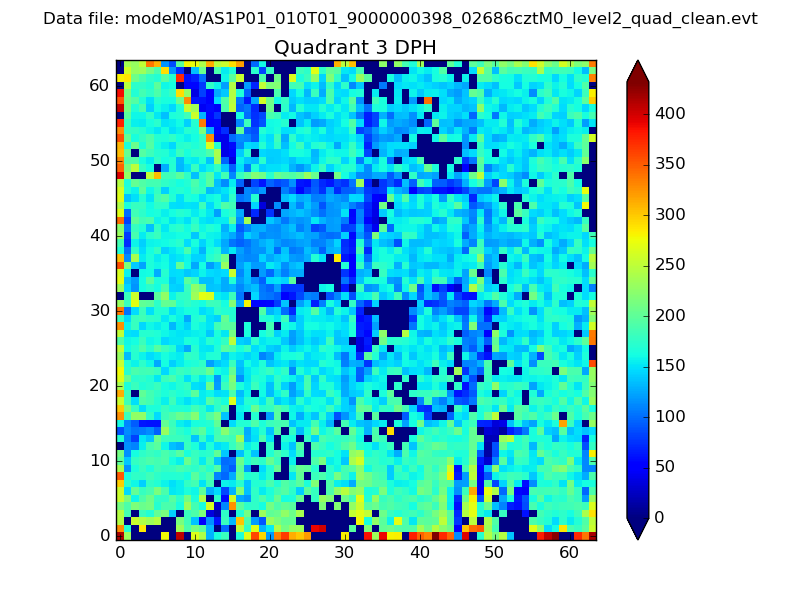 |
 |
Quadrant C |
| Plot type | Count rate plots | Images |
|---|---|---|
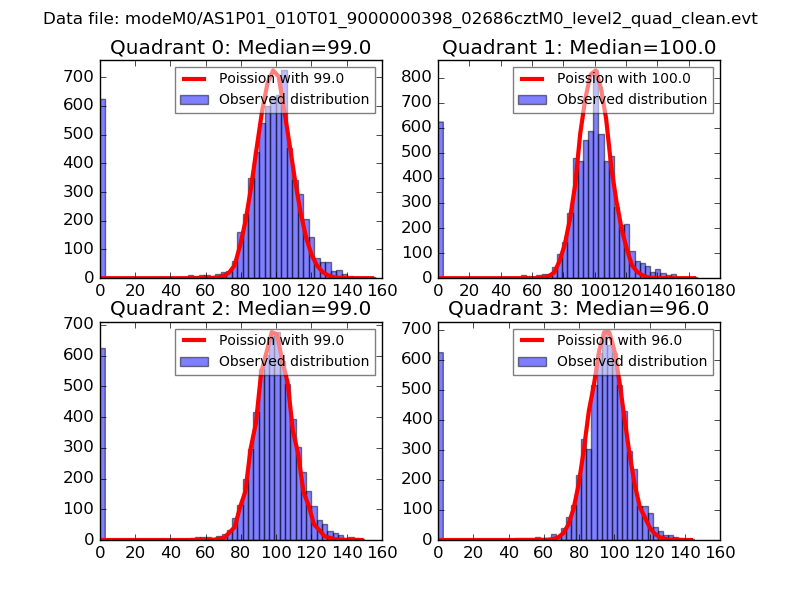
| Comparison with Poisson distribution Blue bars denote a histogram of data divided into 1 sec bins. Red curve is a Poisson curve with rate = median count rate of data. |
 |
 |
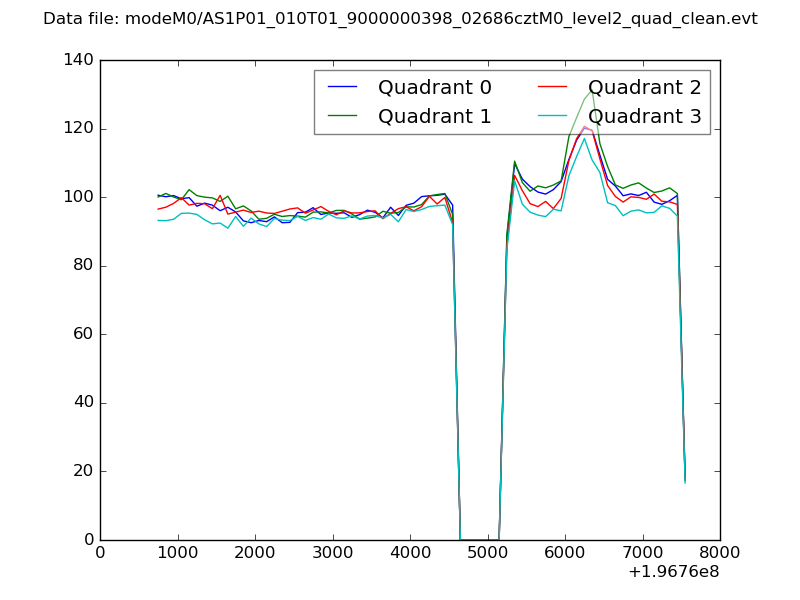
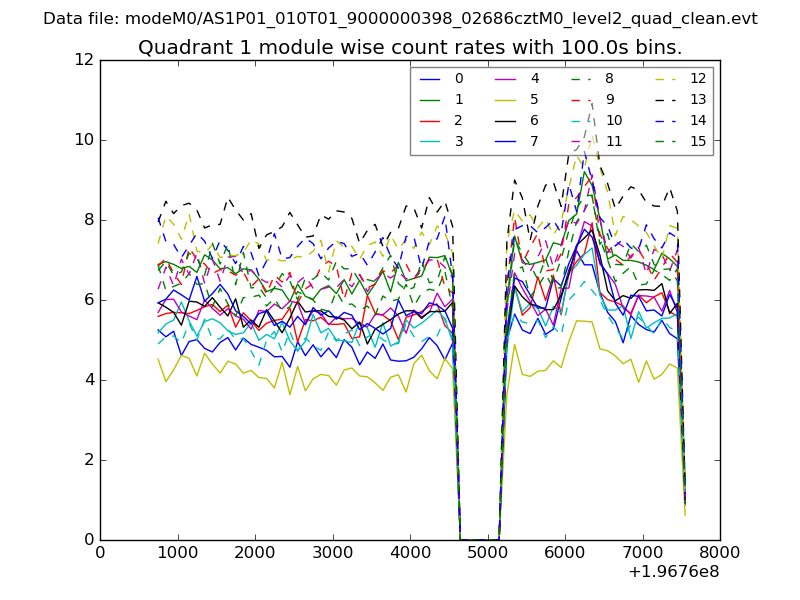
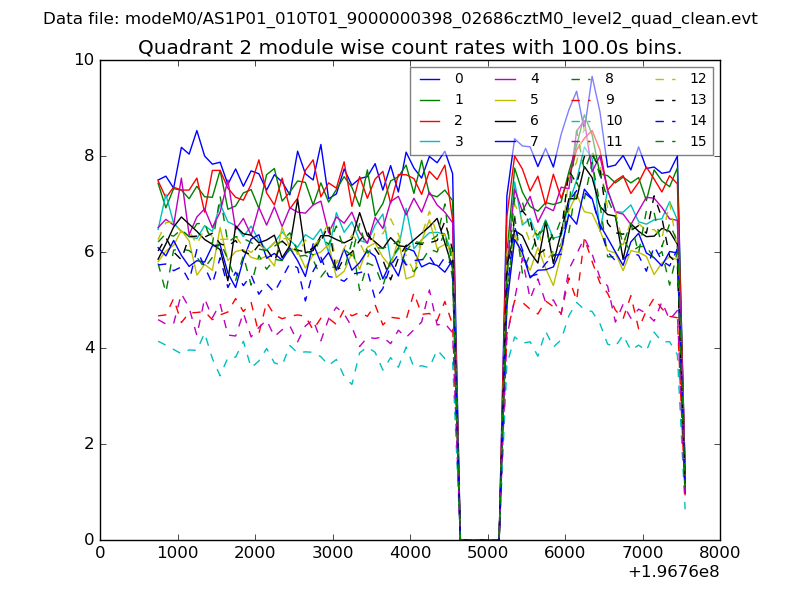
| Quadrant-wise count rates Data is divided into 100 sec bins |
 |
|
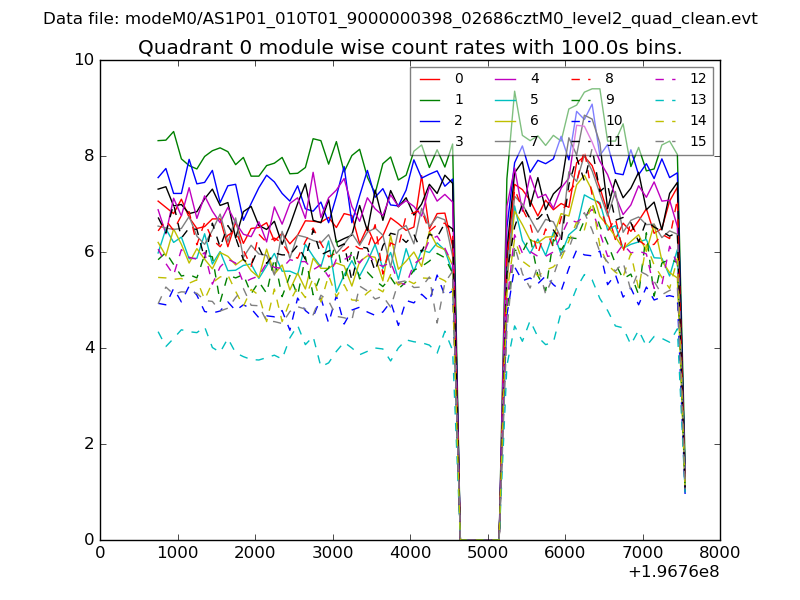
| Module-wise count rates for Quadrant A Data is divided into 100 sec bins |
 |
 |
| Module-wise count rates for Quadrant B Data is divided into 100 sec bins |
 |
 |
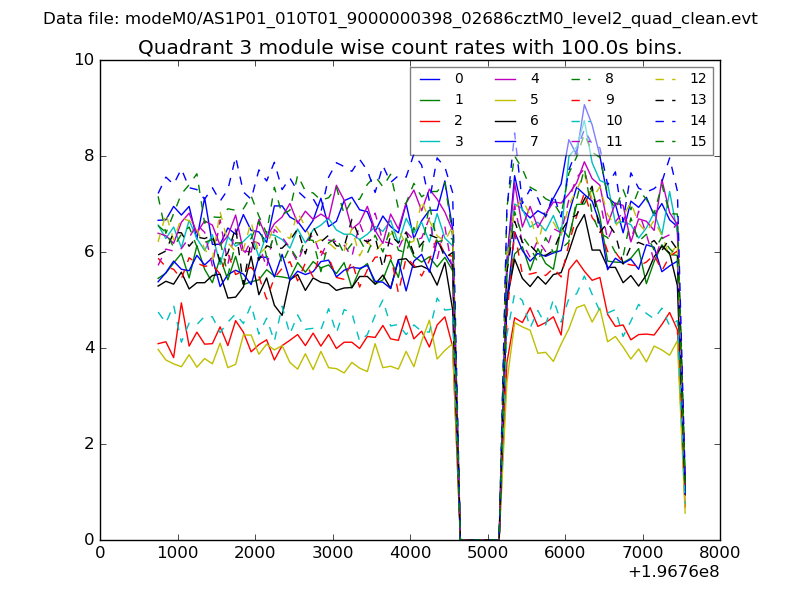
| Module-wise count rates for Quadrant C Data is divided into 100 sec bins |
 |
 |
| Module-wise count rates for Quadrant D Data is divided into 100 sec bins |
 |
 |
| Parameter | Plot |
|---|---|
| CZT HV Monitor | 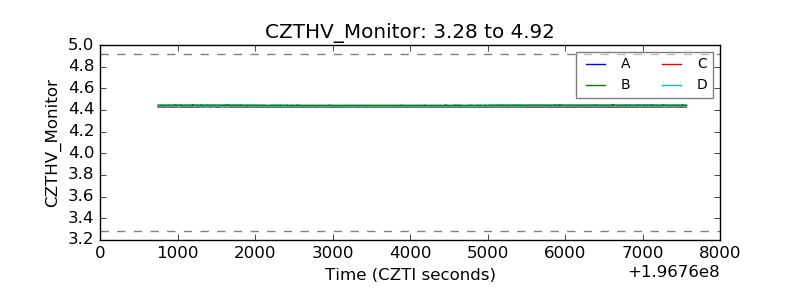 |
| D_VDD | 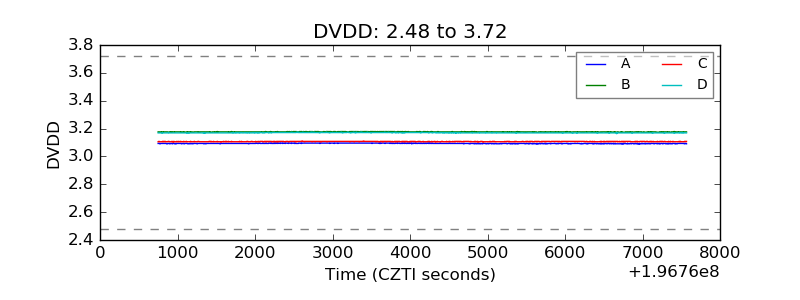 |
| Temperature 1 | 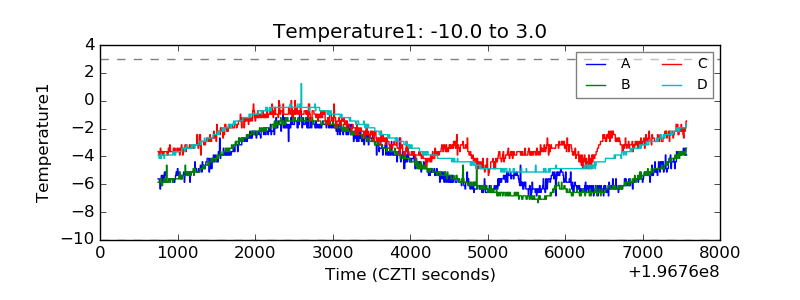 |
| Veto HV Monitor | 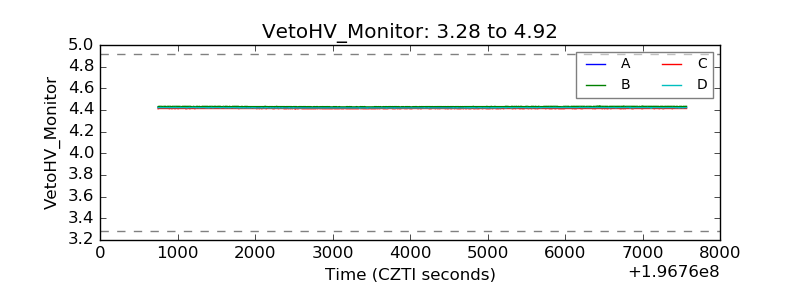 |
| Veto LLD | 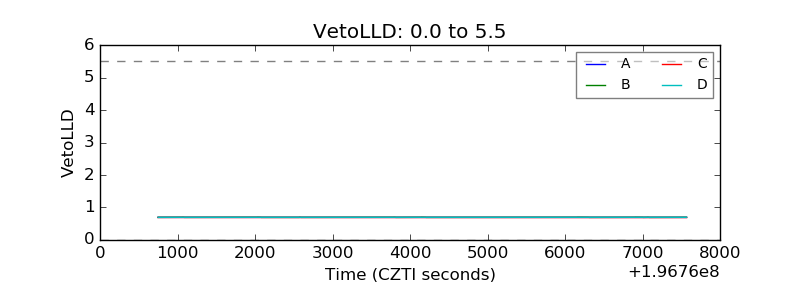 |
| Alpha Counter | 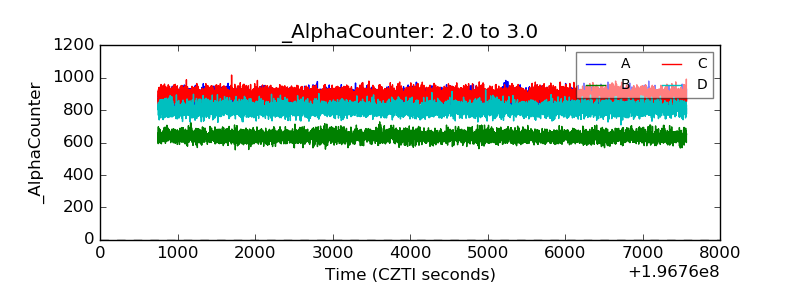 |
| _CPM_Rate | 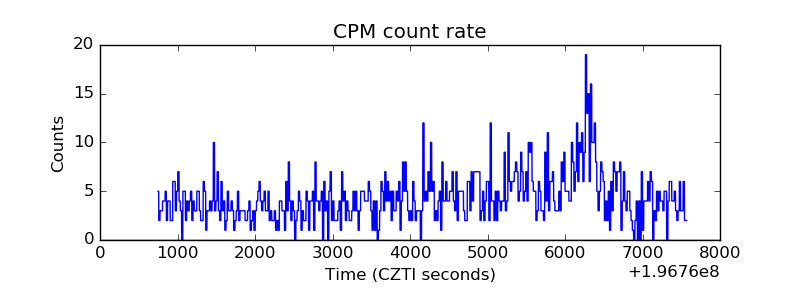 |
| CZT Counter | 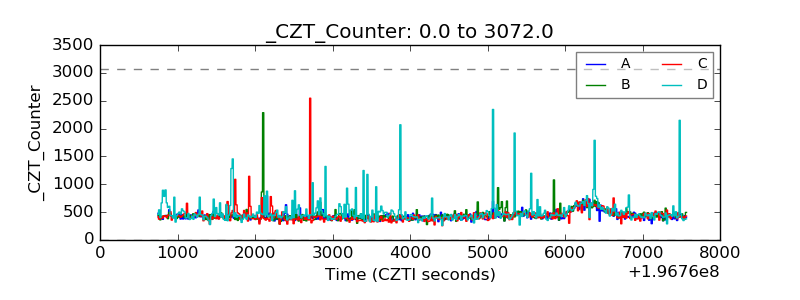 |
| +2.5 Volts monitor |  |
| +5 Volts monitor |  |
| Veto Counter | 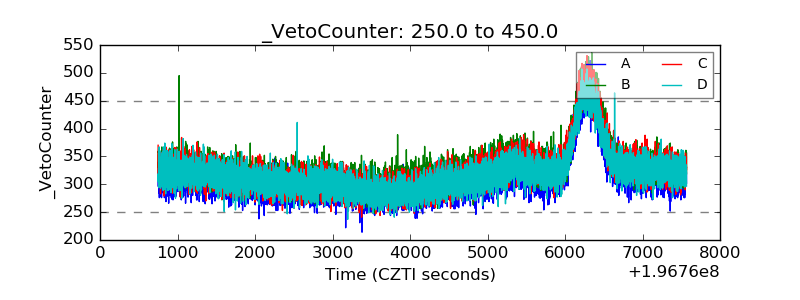 |