| Param | Original file | Final file |
|---|---|---|
| Filename | modeM0/AS1T01_113T01_9000000400cztM0_level2.fits | modeM0/AS1T01_113T01_9000000400cztM0_level2_quad_clean.evt |
| Size (bytes) | 913,656,960 | 1,033,044,480 |
| Size | 871.3 MB | 985.2 MB |
| Events in quadrant A | 5,472,610 | 6,418,828 |
| Events in quadrant B | 5,306,604 | 6,412,687 |
| Events in quadrant C | 5,421,932 | 6,079,430 |
| Events in quadrant D | 4,596,164 | 5,505,588 |
| Mode M9 | |||
|---|---|---|---|
| Quadrant | BADHDUFLAG | Total packets | Discarded packets |
| A | 0 | 159 | 0 |
| B | 0 | 159 | 0 |
| C | 0 | 159 | 0 |
| D | 0 | 160 | 0 |
| Mode M0 | |||
|---|---|---|---|
| Quadrant | BADHDUFLAG | Total packets | Discarded packets |
| A | 0 | 205722 | 0 |
| B | 0 | 219230 | 0 |
| C | 0 | 205743 | 0 |
| D | 0 | 221293 | 0 |
| Mode SS | |||
|---|---|---|---|
| Quadrant | BADHDUFLAG | Total packets | Discarded packets |
| A | 0 | 2038 | 0 |
| B | 0 | 2038 | 0 |
| C | 0 | 2038 | 0 |
| D | 0 | 2038 | 0 |
| Quadrant | Total seconds | Saturated seconds | Saturation percentage |
|---|---|---|---|
| A | 100266 | 1099 | 1.096084% |
| B | 100266 | 1863 | 1.858058% |
| C | 100266 | 729 | 0.727066% |
| D | 100266 | 1470 | 1.466100% |
Noise dominated data is calculated using 1-second bins in cleaned event files. If a bin has >2000 counts, and if more than 50% of those come from <1% of pixels, then it is considered to be noise-dominated and hence unusable.
| Quadrant | # 1 sec bins | Bins with >0 counts | Bins with >2000 counts | High rate bins dominated by noise | Noise dominated (total time) | Noise dominated (detector-on time) | Marked lightcurve |
|---|---|---|---|---|---|---|---|
| A | 116030 | 100259 | 0 | 0 | 0.00% | 0.00% | 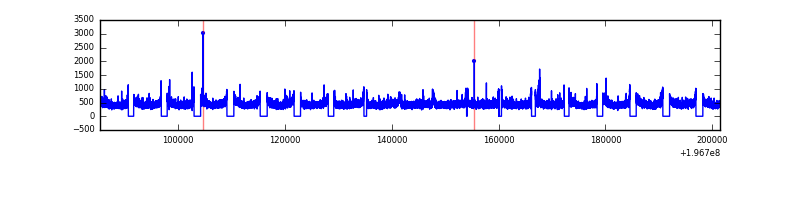 |
| B | 116030 | 100263 | 0 | 0 | 0.00% | 0.00% | 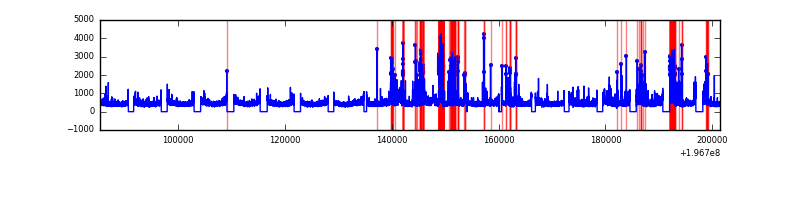 |
| C | 116030 | 100263 | 0 | 0 | 0.00% | 0.00% |  |
| D | 116030 | 100262 | 0 | 0 | 0.00% | 0.00% | 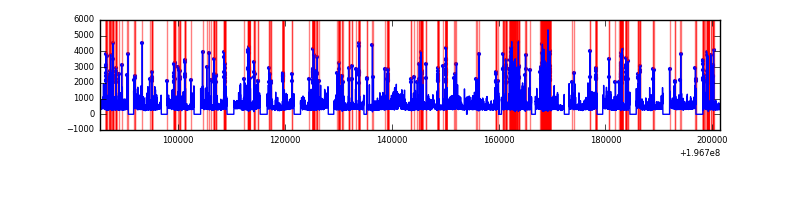 |
Top three noisy pixels from each quadrant. If the there are fewer than three noisy pixels in the level2.evt file, extra rows are filled as -1
| Pixel properties | Quadrant properties | ||||||
|---|---|---|---|---|---|---|---|
| Quadrant | DetID | PixID | Counts | Sigma | Mean | Median | Sigma |
| A | 0 | 29 | 5194 | 10.32 | 1420 | 1317 | 375.5 |
| A | 7 | 110 | 4712 | 9.04 | 1420 | 1317 | 375.5 |
| A | 9 | 19 | 4156 | 7.56 | 1420 | 1317 | 375.5 |
| B | 2 | 9 | 4579 | 11.77 | 1397 | 1328 | 276.3 |
| B | 12 | 226 | 4001 | 9.67 | 1397 | 1328 | 276.3 |
| B | 5 | 128 | 3758 | 8.79 | 1397 | 1328 | 276.3 |
| C | 12 | 241 | 3894 | 6.63 | 1431 | 1313 | 389.5 |
| C | 7 | 111 | 3889 | 6.61 | 1431 | 1313 | 389.5 |
| C | 2 | 127 | 3801 | 6.39 | 1431 | 1313 | 389.5 |
| D | 3 | 14 | 3516 | 6.35 | 1309 | 1183 | 367.3 |
| D | 11 | 82 | 3376 | 5.97 | 1309 | 1183 | 367.3 |
| D | 1 | 19 | 3372 | 5.96 | 1309 | 1183 | 367.3 |
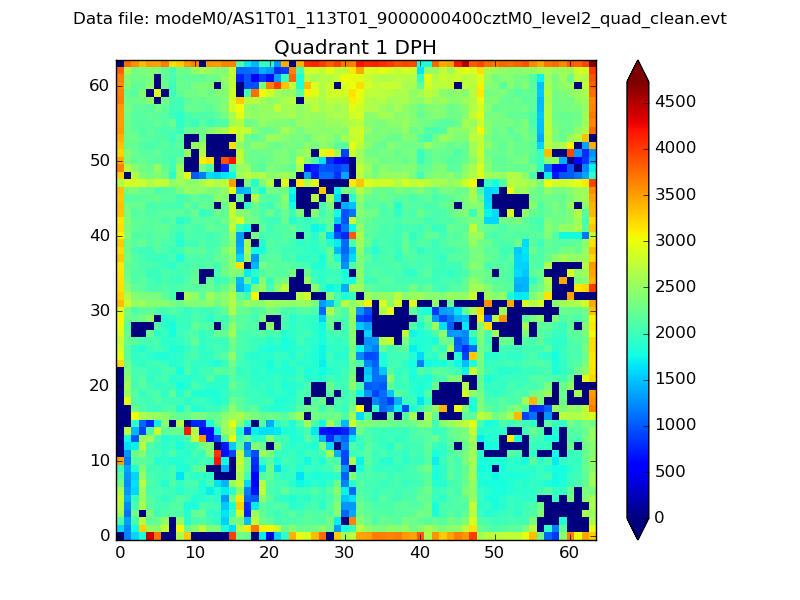
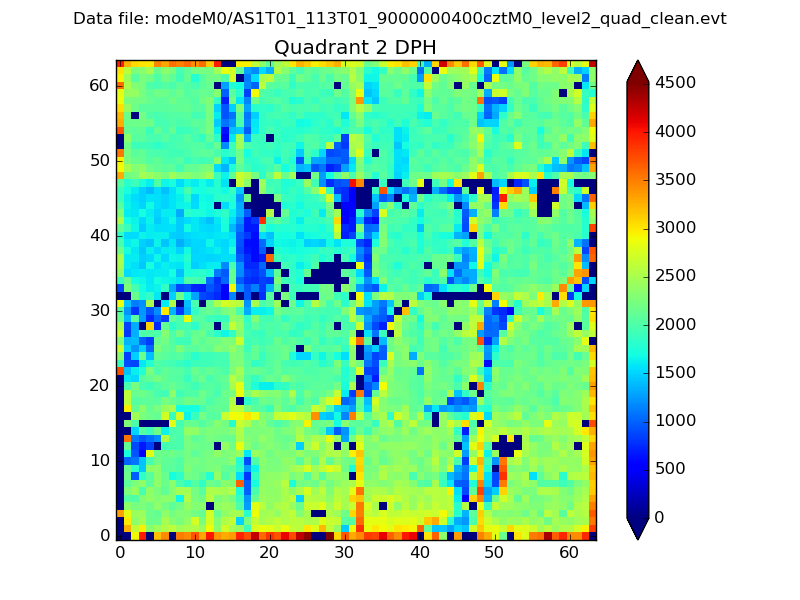
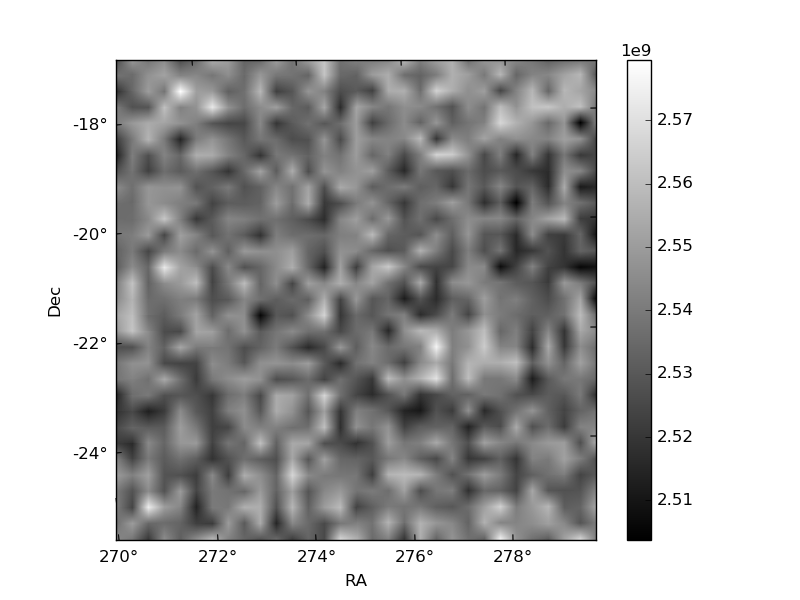
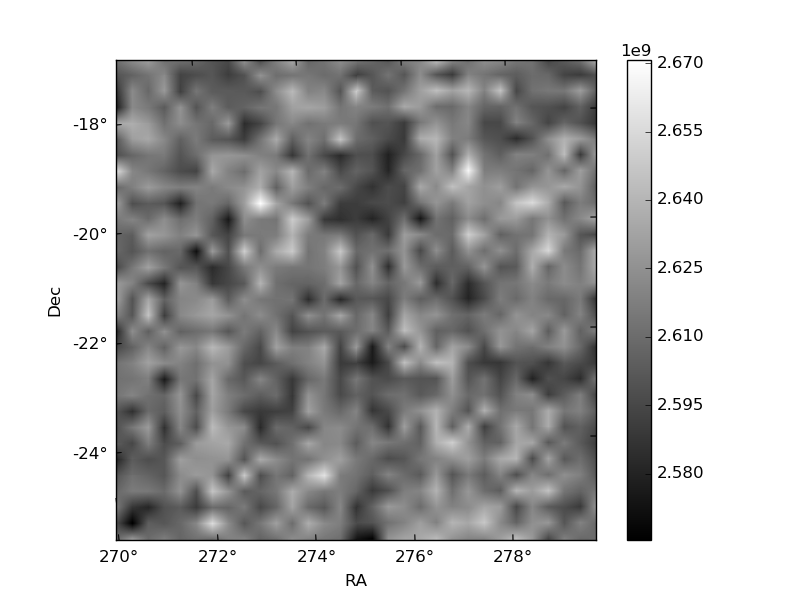
Histogram calculated using DETX and DETY for each event in the final _common_clean file
| Quadrant A | 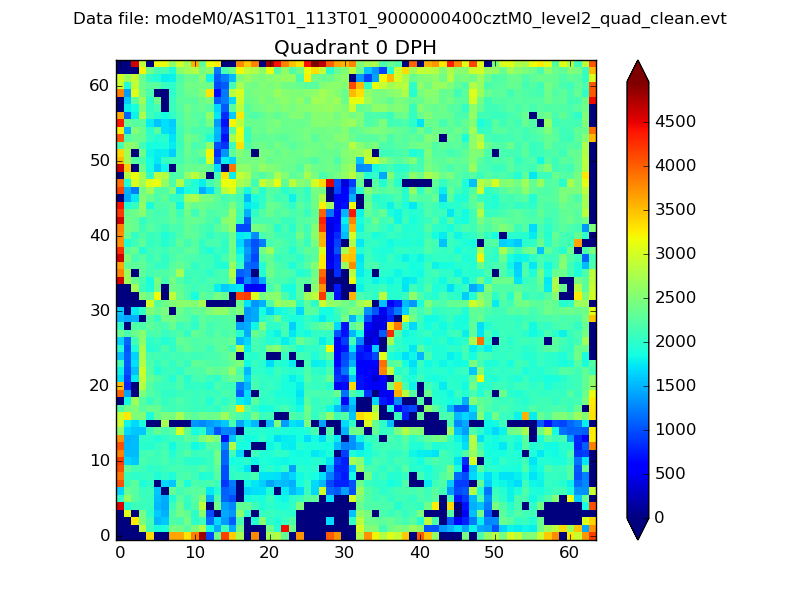 |
 |
Quadrant B |
|---|---|---|---|
| Quadrant D | 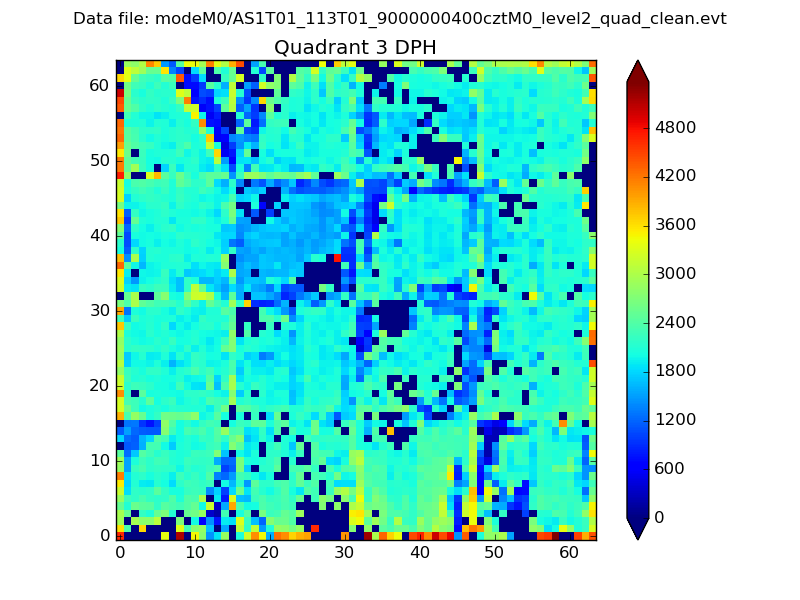 |
 |
Quadrant C |
| Plot type | Count rate plots | Images |
|---|---|---|
| Comparison with Poisson distribution Blue bars denote a histogram of data divided into 1 sec bins. Red curve is a Poisson curve with rate = median count rate of data. |
 |
 |
| Quadrant-wise count rates Data is divided into 100 sec bins |
 |
|
| Module-wise count rates for Quadrant A Data is divided into 100 sec bins |
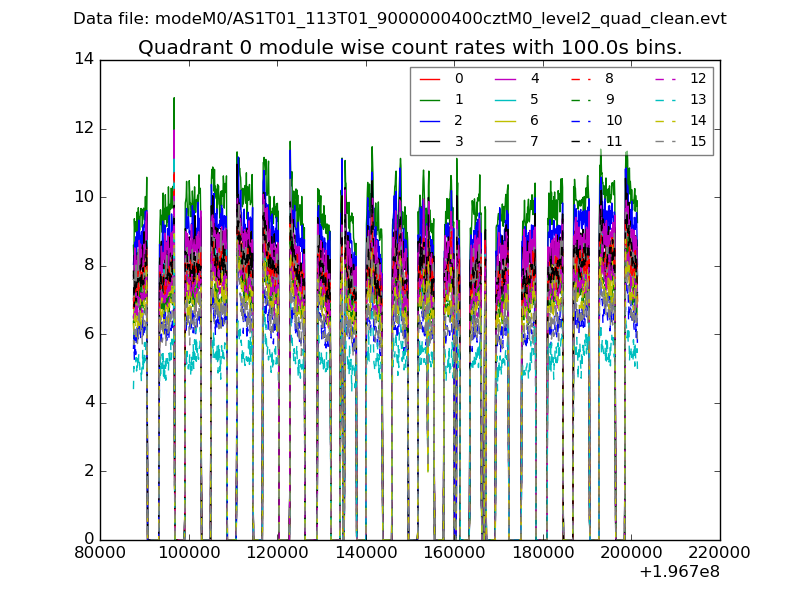 |
 |
| Module-wise count rates for Quadrant B Data is divided into 100 sec bins |
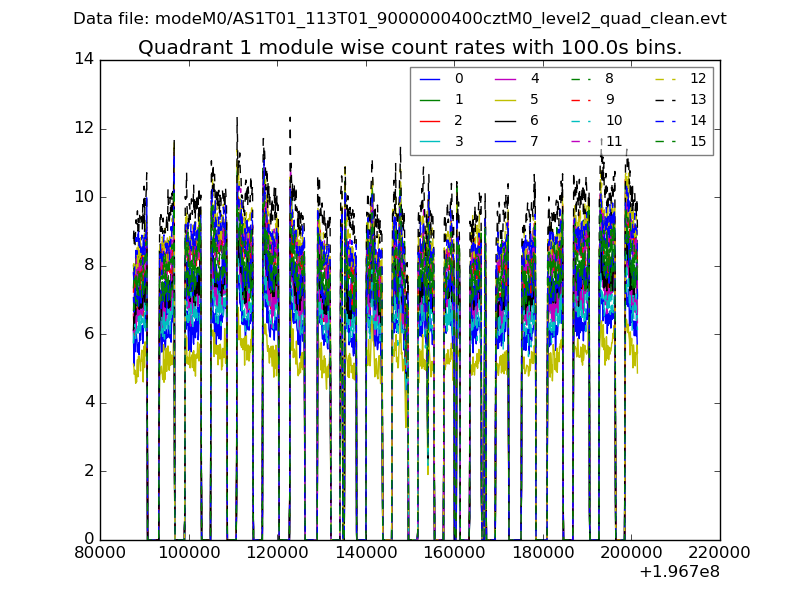 |
 |
| Module-wise count rates for Quadrant C Data is divided into 100 sec bins |
 |
 |
| Module-wise count rates for Quadrant D Data is divided into 100 sec bins |
 |
 |
| Parameter | Plot |
|---|---|
| CZT HV Monitor | 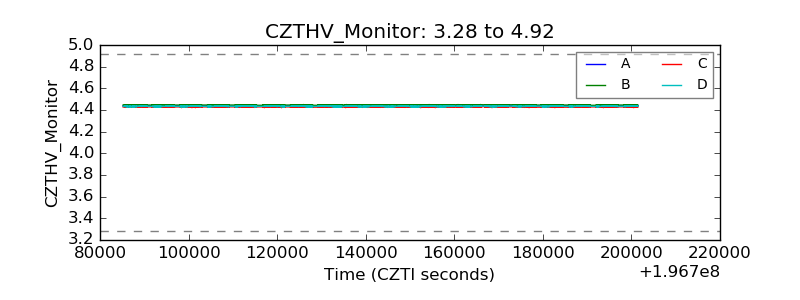 |
| D_VDD | 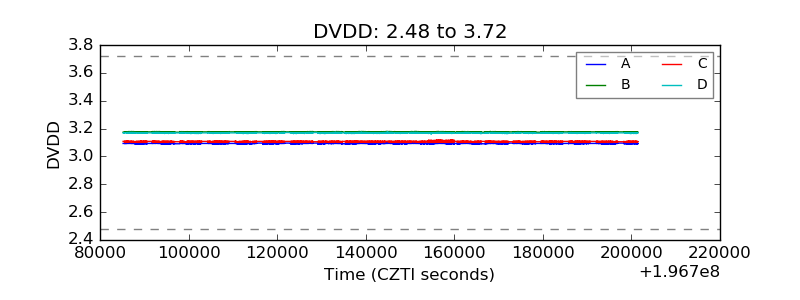 |
| Temperature 1 | 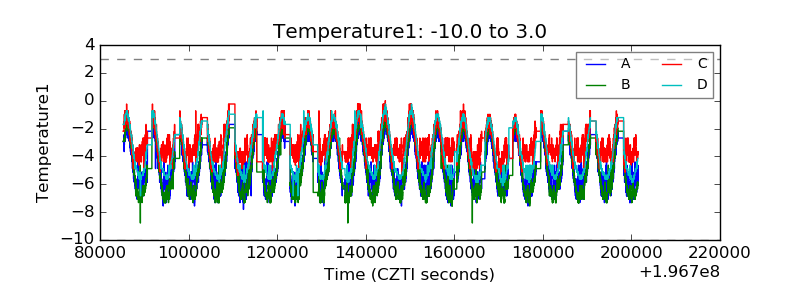 |
| Veto HV Monitor | 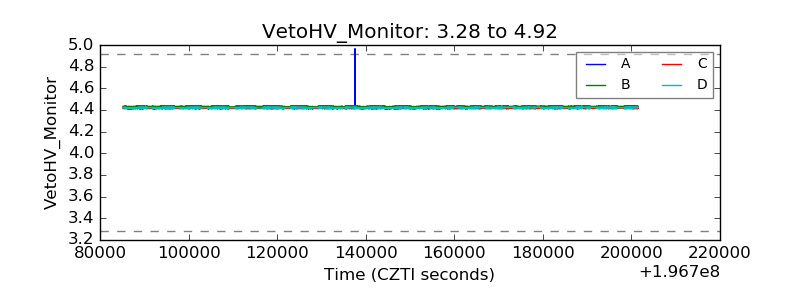 |
| Veto LLD | 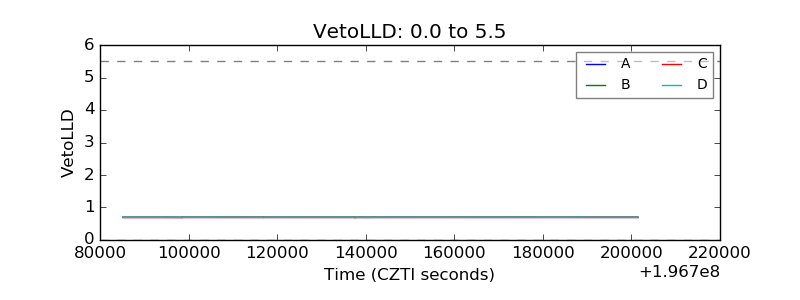 |
| Alpha Counter | 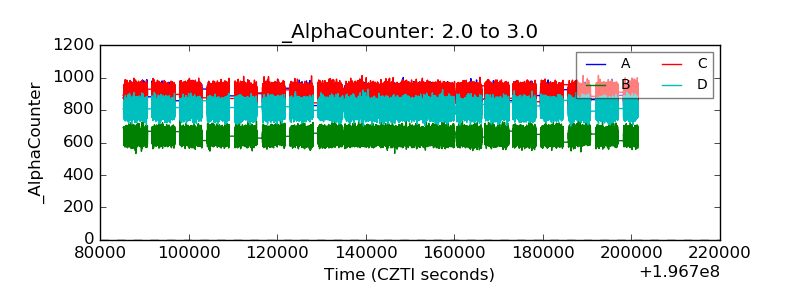 |
| _CPM_Rate | 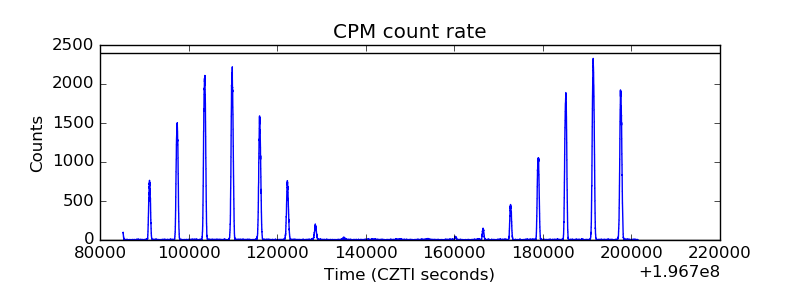 |
| CZT Counter | 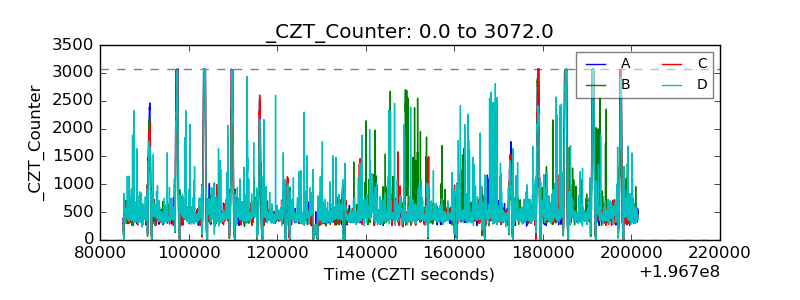 |
| +2.5 Volts monitor | 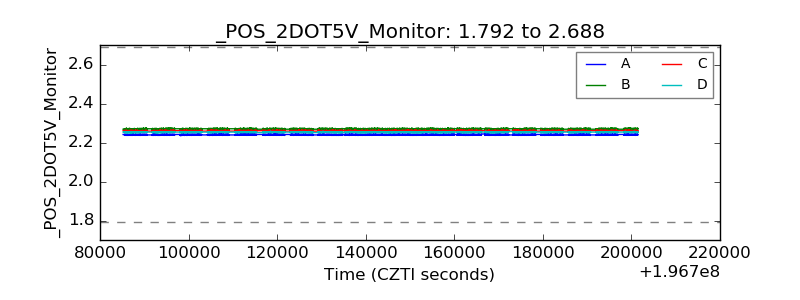 |
| +5 Volts monitor | 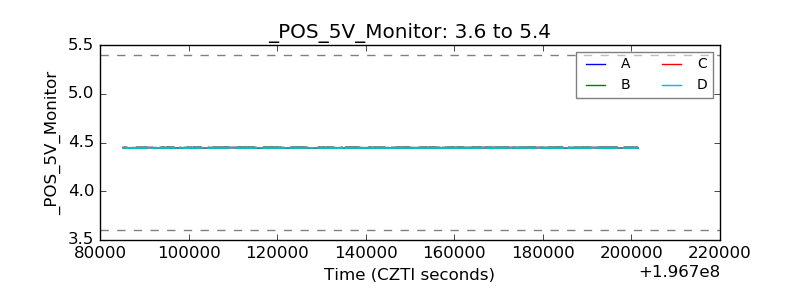 |
| _ROLL_ROT | 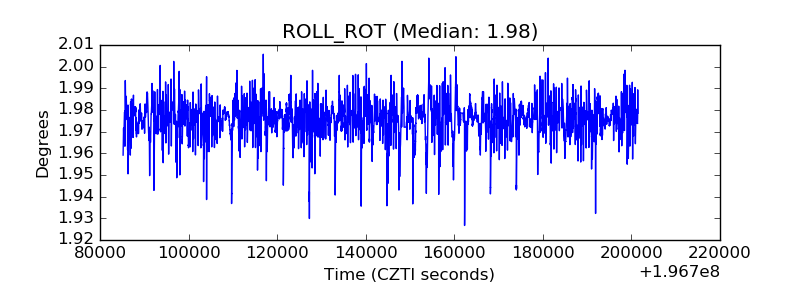 |
| _Roll_DEC | 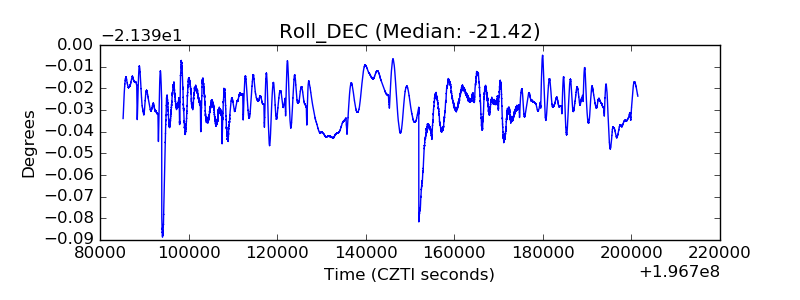 |
| _Roll_RA | 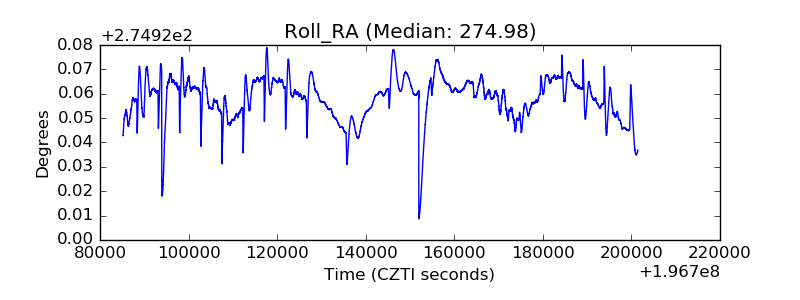 |
| Veto Counter | 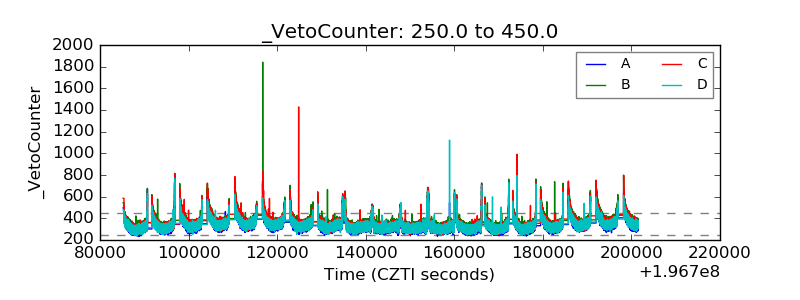 |