| Param | Original file | Final file |
|---|---|---|
| Filename | modeM0/AS1T01_105T01_9000000402cztM0_level2.fits | modeM0/AS1T01_105T01_9000000402cztM0_level2_quad_clean.evt |
| Size (bytes) | 257,918,400 | 253,676,160 |
| Size | 246.0 MB | 241.9 MB |
| Events in quadrant A | 1,534,218 | 1,466,434 |
| Events in quadrant B | 1,482,318 | 1,487,387 |
| Events in quadrant C | 1,529,866 | 1,453,000 |
| Events in quadrant D | 1,296,762 | 1,307,961 |
| Mode M9 | |||
|---|---|---|---|
| Quadrant | BADHDUFLAG | Total packets | Discarded packets |
| A | 0 | 24 | 0 |
| B | 0 | 24 | 0 |
| C | 0 | 24 | 0 |
| D | 0 | 25 | 0 |
| Mode SS | |||
|---|---|---|---|
| Quadrant | BADHDUFLAG | Total packets | Discarded packets |
| A | 0 | 576 | 0 |
| B | 0 | 576 | 0 |
| C | 0 | 576 | 0 |
| D | 0 | 576 | 0 |
| Mode M0 | |||
|---|---|---|---|
| Quadrant | BADHDUFLAG | Total packets | Discarded packets |
| A | 0 | 59309 | 0 |
| B | 0 | 71441 | 0 |
| C | 0 | 59699 | 0 |
| D | 0 | 65663 | 0 |
| Quadrant | Total seconds | Saturated seconds | Saturation percentage |
|---|---|---|---|
| A | 28617 | 586 | 2.047734% |
| B | 28617 | 1094 | 3.822902% |
| C | 28617 | 372 | 1.299927% |
| D | 28617 | 729 | 2.547437% |
Noise dominated data is calculated using 1-second bins in cleaned event files. If a bin has >2000 counts, and if more than 50% of those come from <1% of pixels, then it is considered to be noise-dominated and hence unusable.
| Quadrant | # 1 sec bins | Bins with >0 counts | Bins with >2000 counts | High rate bins dominated by noise | Noise dominated (total time) | Noise dominated (detector-on time) | Marked lightcurve |
|---|---|---|---|---|---|---|---|
| A | 34937 | 28618 | 0 | 0 | 0.00% | 0.00% |  |
| B | 34937 | 28618 | 0 | 0 | 0.00% | 0.00% |  |
| C | 34937 | 28618 | 0 | 0 | 0.00% | 0.00% |  |
| D | 34937 | 28612 | 0 | 0 | 0.00% | 0.00% | 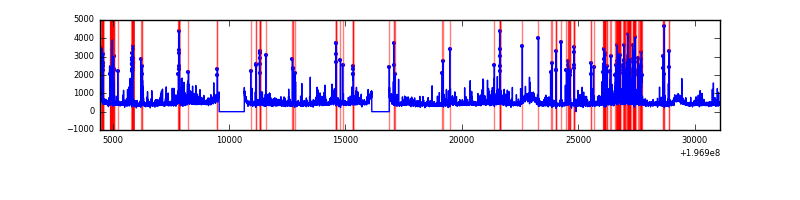 |
Top three noisy pixels from each quadrant. If the there are fewer than three noisy pixels in the level2.evt file, extra rows are filled as -1
| Pixel properties | Quadrant properties | ||||||
|---|---|---|---|---|---|---|---|
| Quadrant | DetID | PixID | Counts | Sigma | Mean | Median | Sigma |
| A | 0 | 29 | 1364 | 9.35 | 397 | 368 | 106.5 |
| A | 7 | 110 | 1319 | 8.93 | 397 | 368 | 106.5 |
| A | 9 | 19 | 1147 | 7.31 | 397 | 368 | 106.5 |
| B | 2 | 9 | 1263 | 11.23 | 389 | 368 | 79.7 |
| B | 12 | 226 | 1143 | 9.72 | 389 | 368 | 79.7 |
| B | 14 | 254 | 1023 | 8.22 | 389 | 368 | 79.7 |
| C | 7 | 111 | 1104 | 6.63 | 404 | 371 | 110.6 |
| C | 3 | 63 | 1053 | 6.17 | 404 | 371 | 110.6 |
| C | 3 | 158 | 1020 | 5.87 | 404 | 371 | 110.6 |
| D | 3 | 14 | 960 | 5.99 | 370 | 335 | 104.3 |
| D | 7 | 3 | 940 | 5.8 | 370 | 335 | 104.3 |
| D | 7 | 5 | 935 | 5.75 | 370 | 335 | 104.3 |
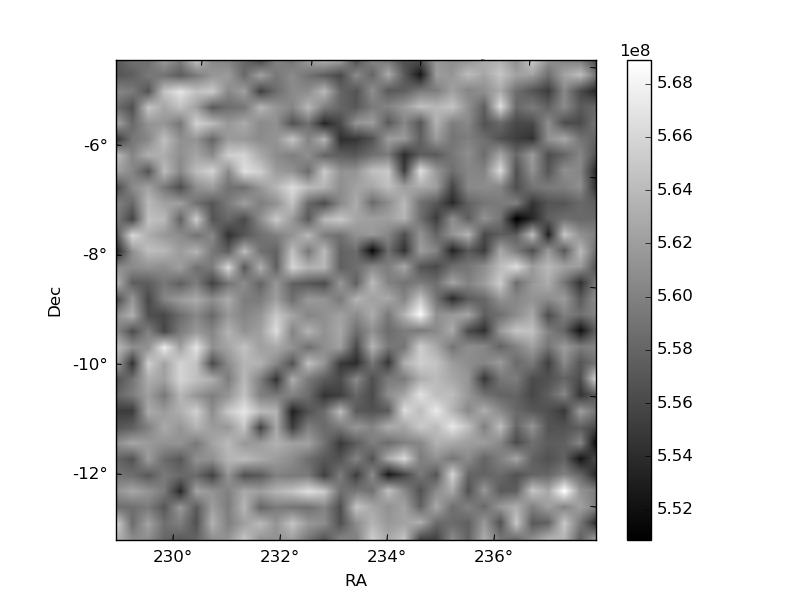
Histogram calculated using DETX and DETY for each event in the final _common_clean file
| Quadrant A | 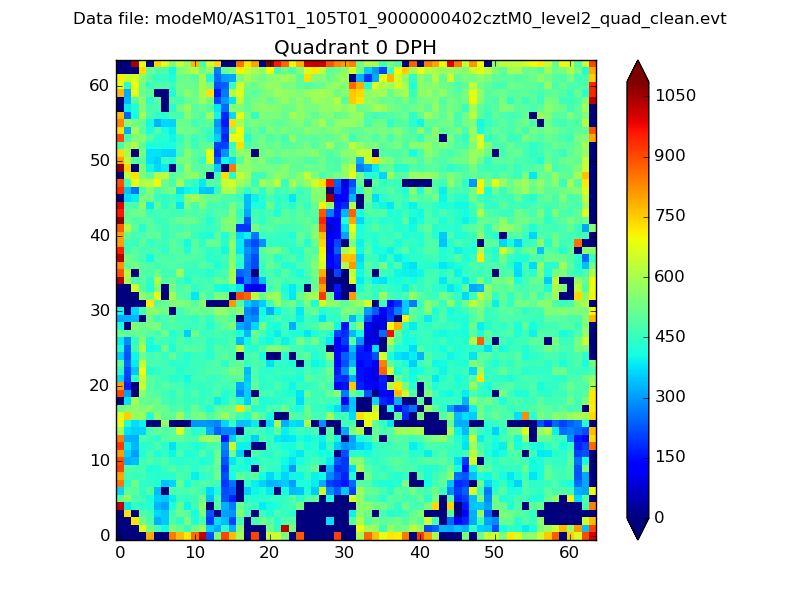 |
 |
Quadrant B |
|---|---|---|---|
| Quadrant D | 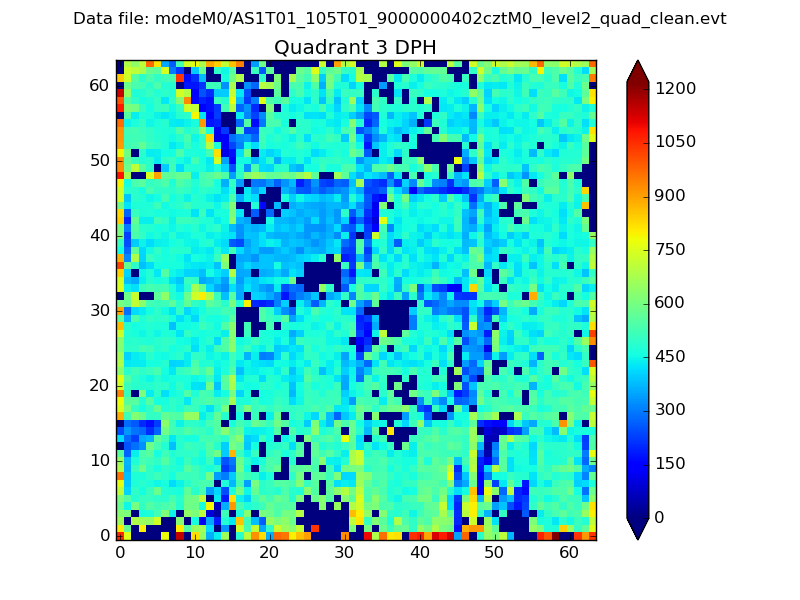 |
 |
Quadrant C |
| Plot type | Count rate plots | Images |
|---|---|---|
| Comparison with Poisson distribution Blue bars denote a histogram of data divided into 1 sec bins. Red curve is a Poisson curve with rate = median count rate of data. |
 |
 |
| Quadrant-wise count rates Data is divided into 100 sec bins |
 |
|
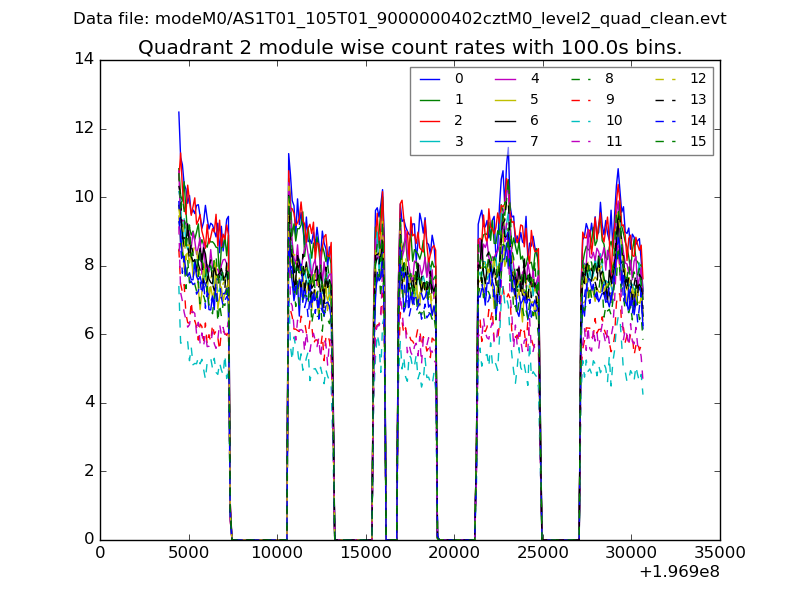
| Module-wise count rates for Quadrant A Data is divided into 100 sec bins |
 |
 |
| Module-wise count rates for Quadrant B Data is divided into 100 sec bins |
 |
 |
| Module-wise count rates for Quadrant C Data is divided into 100 sec bins |
 |
 |
| Module-wise count rates for Quadrant D Data is divided into 100 sec bins |
 |
 |
| Parameter | Plot |
|---|---|
| CZT HV Monitor | 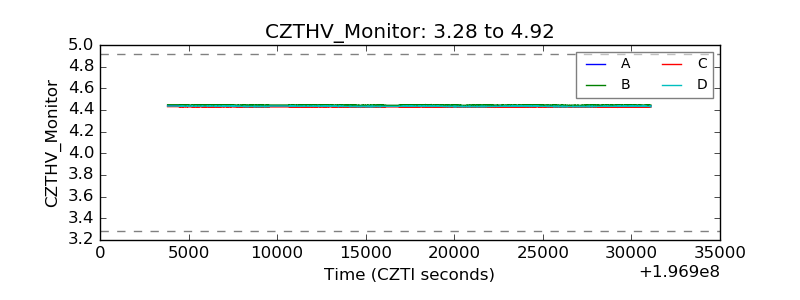 |
| D_VDD |  |
| Temperature 1 |  |
| Veto HV Monitor |  |
| Veto LLD | 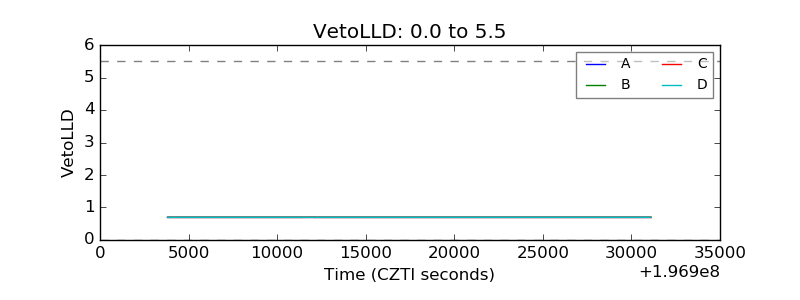 |
| Alpha Counter |  |
| _CPM_Rate |  |
| CZT Counter |  |
| +2.5 Volts monitor |  |
| +5 Volts monitor |  |
| _ROLL_ROT |  |
| _Roll_DEC |  |
| _Roll_RA |  |
| Veto Counter | 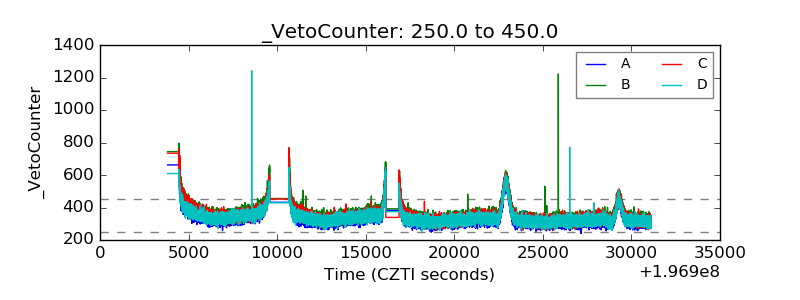 |