| Param | Original file | Final file |
|---|---|---|
| Filename | modeM0/AS1T01_106T01_9000000404cztM0_level2.fits | modeM0/AS1T01_106T01_9000000404cztM0_level2_quad_clean.evt |
| Size (bytes) | 856,733,760 | 972,936,000 |
| Size | 817.0 MB | 927.9 MB |
| Events in quadrant A | 5,090,312 | 5,891,762 |
| Events in quadrant B | 4,980,966 | 5,999,491 |
| Events in quadrant C | 5,039,898 | 5,784,947 |
| Events in quadrant D | 4,301,590 | 5,260,059 |
| Mode M0 | |||
|---|---|---|---|
| Quadrant | BADHDUFLAG | Total packets | Discarded packets |
| A | 0 | 197171 | 0 |
| B | 0 | 199584 | 0 |
| C | 0 | 204480 | 0 |
| D | 0 | 216516 | 0 |
| Mode SS | |||
|---|---|---|---|
| Quadrant | BADHDUFLAG | Total packets | Discarded packets |
| A | 0 | 1934 | 0 |
| B | 0 | 1934 | 0 |
| C | 0 | 1934 | 0 |
| D | 0 | 1934 | 0 |
| Mode M9 | |||
|---|---|---|---|
| Quadrant | BADHDUFLAG | Total packets | Discarded packets |
| A | 0 | 130 | 0 |
| B | 0 | 130 | 0 |
| C | 0 | 130 | 0 |
| D | 0 | 131 | 0 |
| Quadrant | Total seconds | Saturated seconds | Saturation percentage |
|---|---|---|---|
| A | 95293 | 1279 | 1.342176% |
| B | 95294 | 1333 | 1.398829% |
| C | 95294 | 1593 | 1.671669% |
| D | 95294 | 2221 | 2.330682% |
Noise dominated data is calculated using 1-second bins in cleaned event files. If a bin has >2000 counts, and if more than 50% of those come from <1% of pixels, then it is considered to be noise-dominated and hence unusable.
| Quadrant | # 1 sec bins | Bins with >0 counts | Bins with >2000 counts | High rate bins dominated by noise | Noise dominated (total time) | Noise dominated (detector-on time) | Marked lightcurve |
|---|---|---|---|---|---|---|---|
| A | 131435 | 95293 | 0 | 0 | 0.00% | 0.00% | 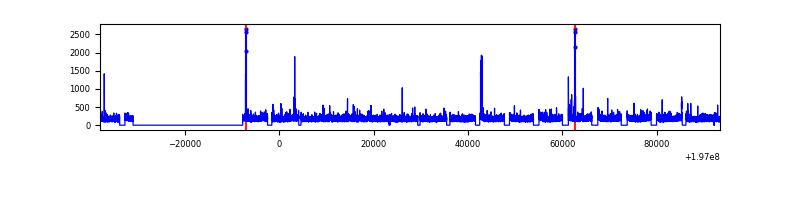 |
| B | 131435 | 95292 | 0 | 0 | 0.00% | 0.00% | 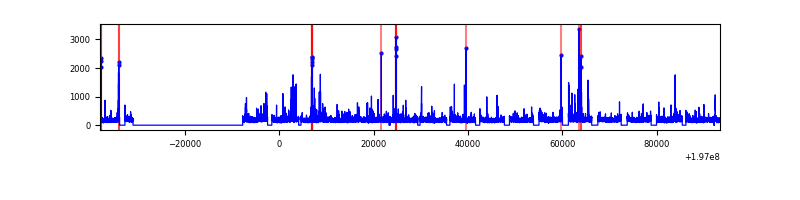 |
| C | 131435 | 95272 | 0 | 0 | 0.00% | 0.00% |  |
| D | 131435 | 95275 | 0 | 0 | 0.00% | 0.00% | 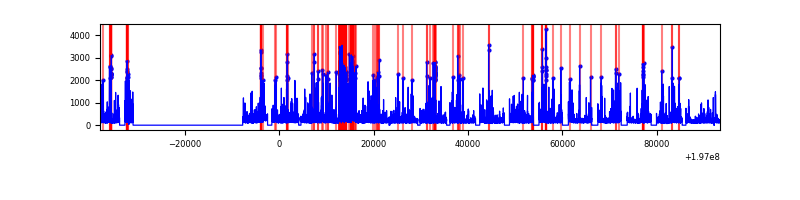 |
Top three noisy pixels from each quadrant. If the there are fewer than three noisy pixels in the level2.evt file, extra rows are filled as -1
| Pixel properties | Quadrant properties | ||||||
|---|---|---|---|---|---|---|---|
| Quadrant | DetID | PixID | Counts | Sigma | Mean | Median | Sigma |
| A | 14 | 188 | 4797 | 10.42 | 1319 | 1224 | 343.0 |
| A | 0 | 29 | 4658 | 10.01 | 1319 | 1224 | 343.0 |
| A | 7 | 110 | 4367 | 9.16 | 1319 | 1224 | 343.0 |
| B | 2 | 9 | 4478 | 12.7 | 1308 | 1242 | 254.7 |
| B | 12 | 226 | 3680 | 9.57 | 1308 | 1242 | 254.7 |
| B | 14 | 254 | 3454 | 8.68 | 1308 | 1242 | 254.7 |
| C | 2 | 191 | 3397 | 6.04 | 1334 | 1227 | 359.3 |
| C | 9 | 188 | 3391 | 6.02 | 1334 | 1227 | 359.3 |
| C | 3 | 158 | 3374 | 5.98 | 1334 | 1227 | 359.3 |
| D | 11 | 82 | 3263 | 6.3 | 1227 | 1109 | 342.0 |
| D | 1 | 19 | 3226 | 6.19 | 1227 | 1109 | 342.0 |
| D | 3 | 14 | 3178 | 6.05 | 1227 | 1109 | 342.0 |
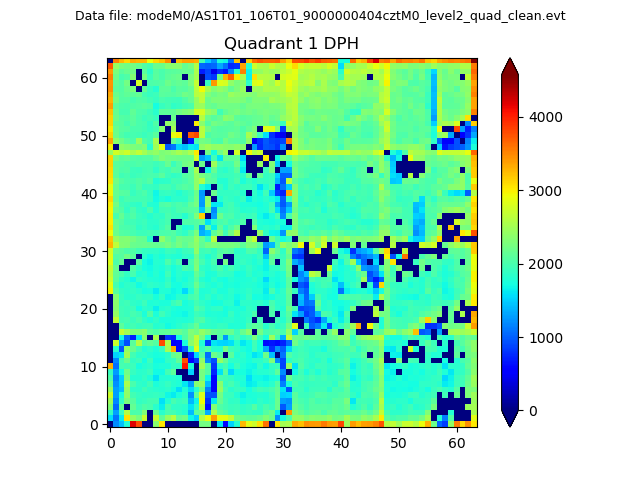
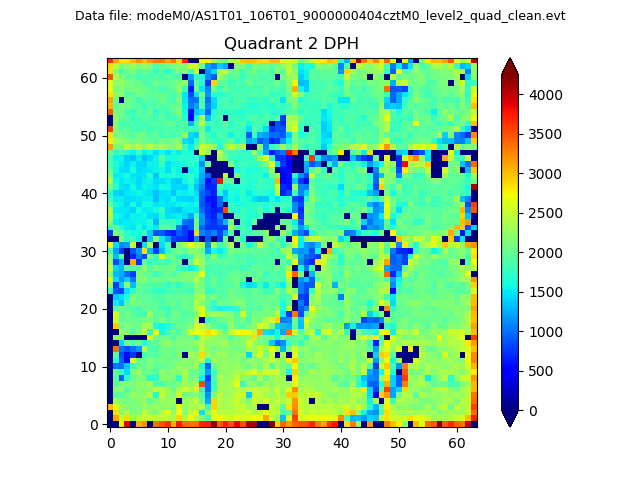
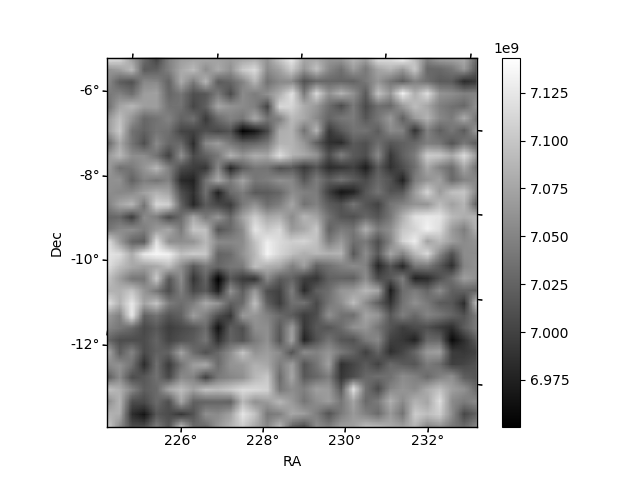
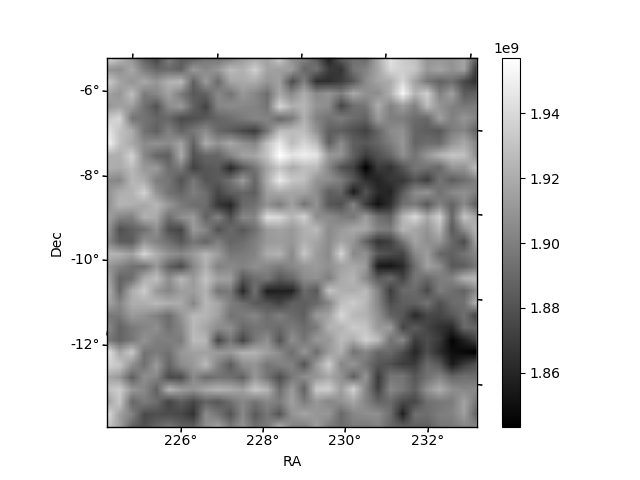
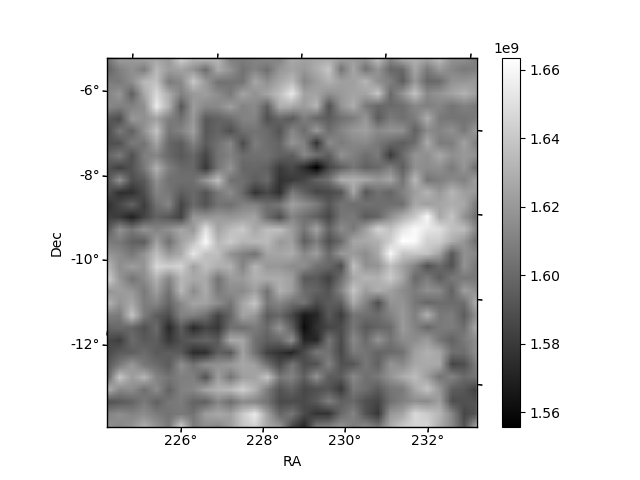
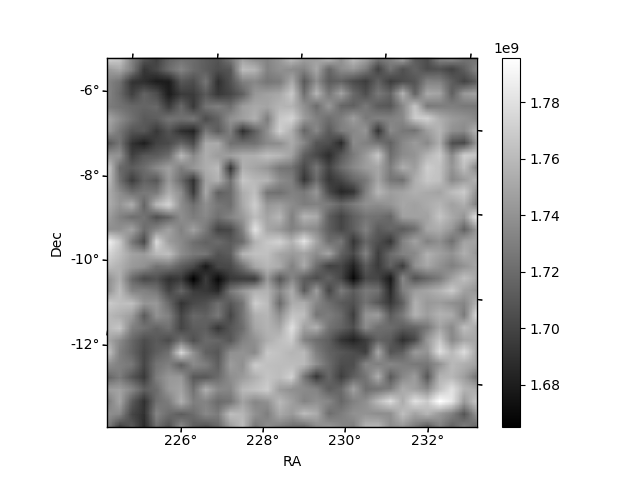
Histogram calculated using DETX and DETY for each event in the final _common_clean file
| Quadrant A | 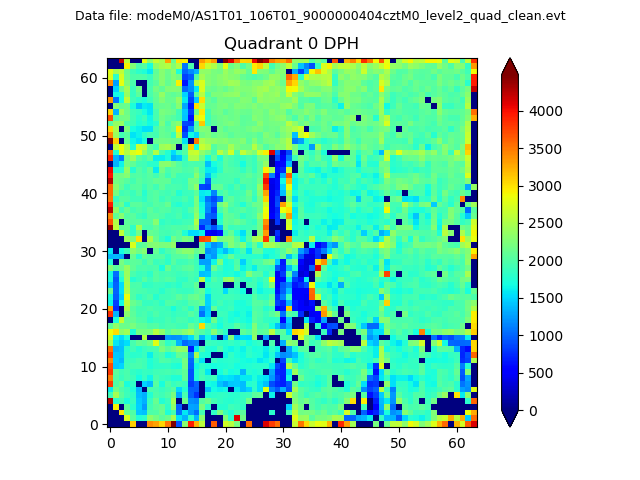 |
 |
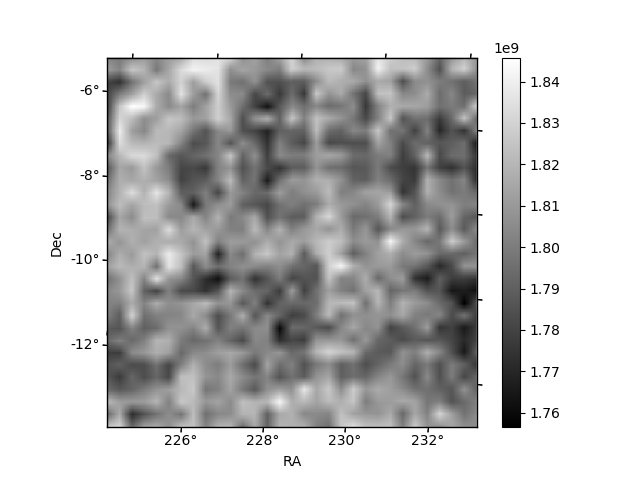
Quadrant B |
|---|---|---|---|
| Quadrant D | 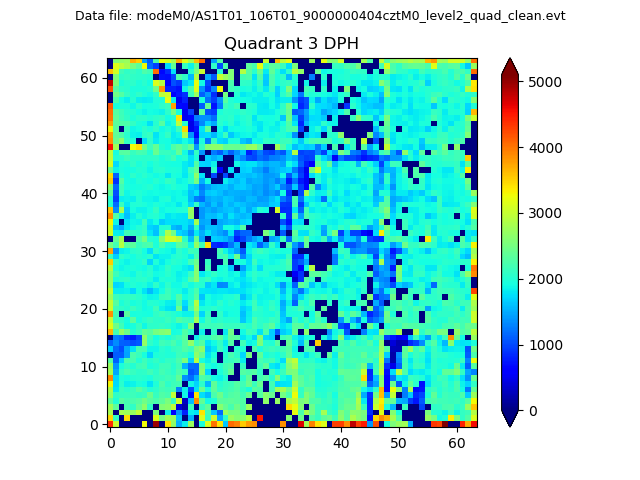 |
 |
Quadrant C |
| Plot type | Count rate plots | Images |
|---|---|---|
| Comparison with Poisson distribution Blue bars denote a histogram of data divided into 1 sec bins. Red curve is a Poisson curve with rate = median count rate of data. |
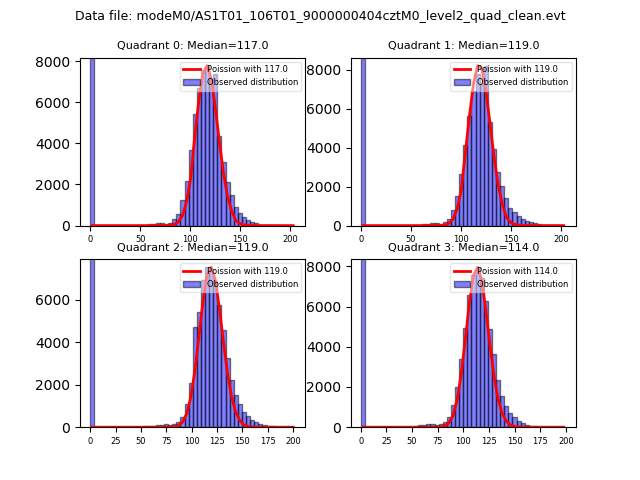 |
 |
| Quadrant-wise count rates Data is divided into 100 sec bins |
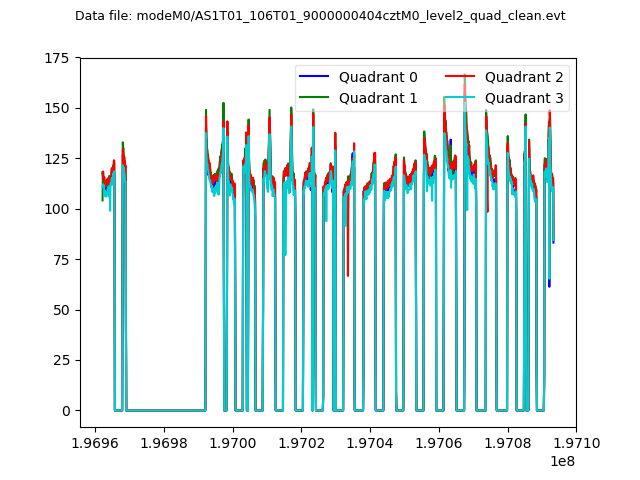 |
|
| Module-wise count rates for Quadrant A Data is divided into 100 sec bins |
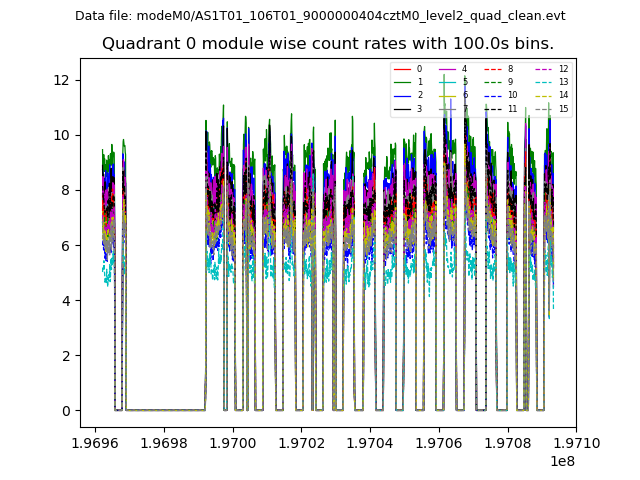 |
 |
| Module-wise count rates for Quadrant B Data is divided into 100 sec bins |
 |
 |
| Module-wise count rates for Quadrant C Data is divided into 100 sec bins |
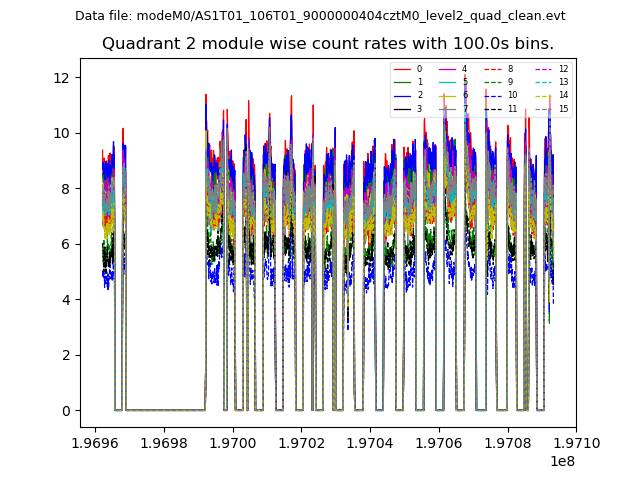 |
 |
| Module-wise count rates for Quadrant D Data is divided into 100 sec bins |
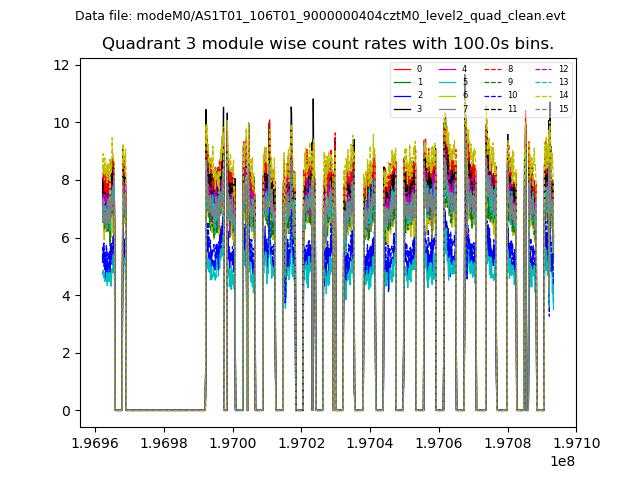 |
 |
| Parameter | Plot |
|---|---|
| CZT HV Monitor | 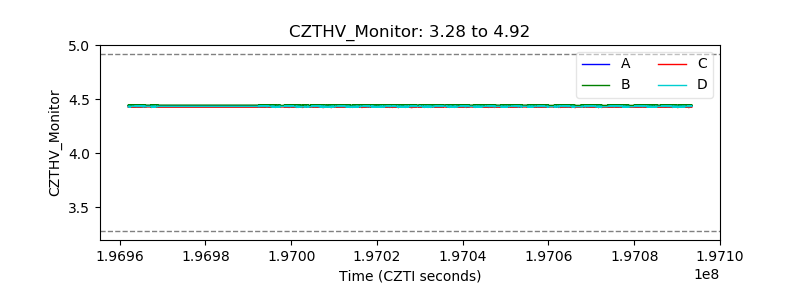 |
| D_VDD | 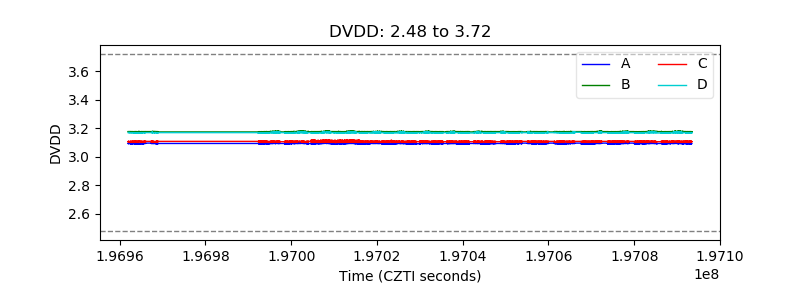 |
| Temperature 1 | 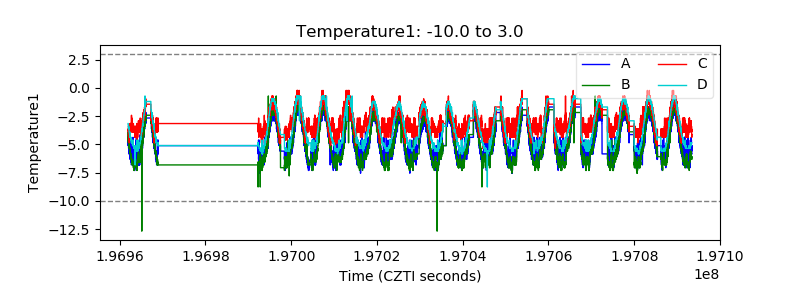 |
| Veto HV Monitor |  |
| Veto LLD | 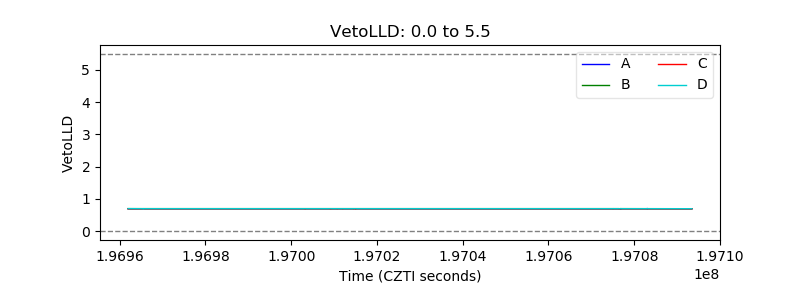 |
| Alpha Counter |  |
| _CPM_Rate | 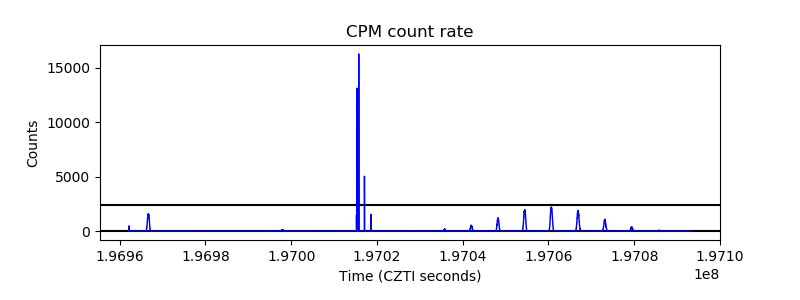 |
| CZT Counter | 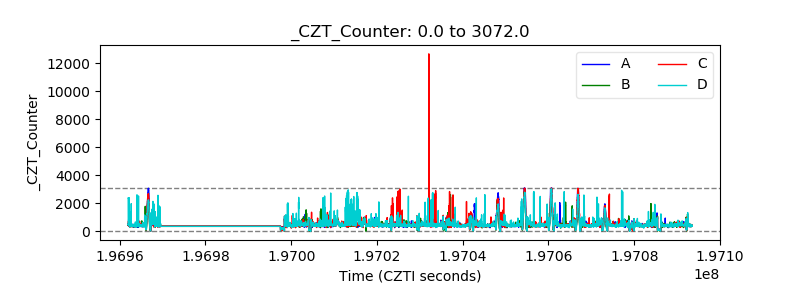 |
| +2.5 Volts monitor | 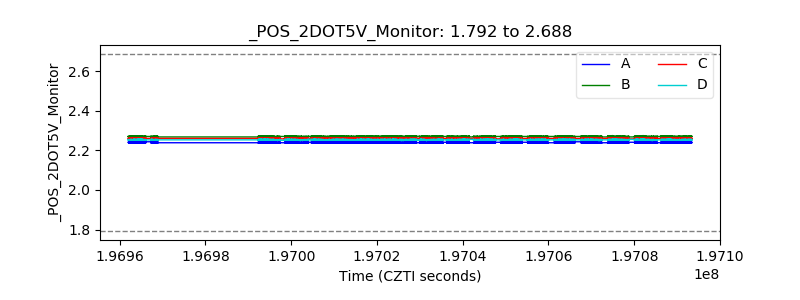 |
| +5 Volts monitor |  |
| _ROLL_ROT | 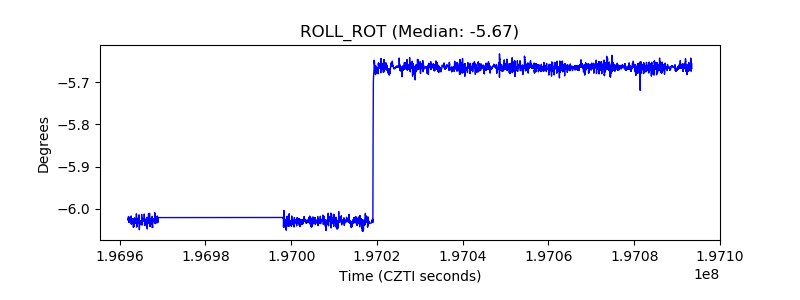 |
| _Roll_DEC |  |
| _Roll_RA | 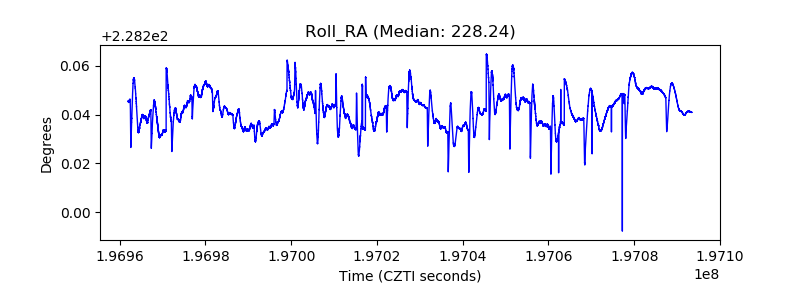 |
| Veto Counter | 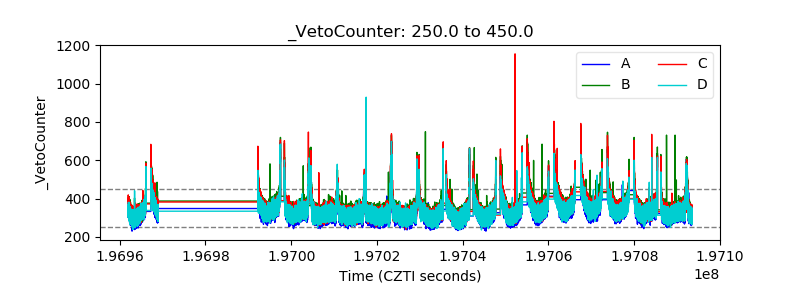 |