| Param | Original file | Final file |
|---|---|---|
| Filename | modeM0/AS1T01_112T01_9000000406cztM0_level2.fits | modeM0/AS1T01_112T01_9000000406cztM0_level2_quad_clean.evt |
| Size (bytes) | 1,851,445,440 | 537,361,920 |
| Size | 1.7 GB | 512.5 MB |
| Events in quadrant A | 11,055,600 | 573,737 |
| Events in quadrant B | 10,825,020 | 563,920 |
| Events in quadrant C | 10,922,080 | 559,906 |
| Events in quadrant D | 9,208,132 | 502,703 |
| Mode M0 | |||
|---|---|---|---|
| Quadrant | BADHDUFLAG | Total packets | Discarded packets |
| A | 0 | 437967 | 0 |
| B | 0 | 443130 | 0 |
| C | 0 | 441032 | 0 |
| D | 0 | 476423 | 0 |
| Mode SS | |||
|---|---|---|---|
| Quadrant | BADHDUFLAG | Total packets | Discarded packets |
| A | 0 | 4172 | 0 |
| B | 0 | 4172 | 0 |
| C | 0 | 4172 | 0 |
| D | 0 | 4172 | 0 |
| Mode M9 | |||
|---|---|---|---|
| Quadrant | BADHDUFLAG | Total packets | Discarded packets |
| A | 0 | 295 | 0 |
| B | 0 | 295 | 0 |
| C | 0 | 295 | 0 |
| D | 0 | 295 | 0 |
| Quadrant | Total seconds | Saturated seconds | Saturation percentage |
|---|---|---|---|
| A | 205192 | 3771 | 1.837791% |
| B | 205192 | 3784 | 1.844126% |
| C | 205192 | 3174 | 1.546844% |
| D | 205192 | 5111 | 2.490838% |
Noise dominated data is calculated using 1-second bins in cleaned event files. If a bin has >2000 counts, and if more than 50% of those come from <1% of pixels, then it is considered to be noise-dominated and hence unusable.
| Quadrant | # 1 sec bins | Bins with >0 counts | Bins with >2000 counts | High rate bins dominated by noise | Noise dominated (total time) | Noise dominated (detector-on time) | Marked lightcurve |
|---|---|---|---|---|---|---|---|
| A | 252952 | 205181 | 0 | 0 | 0.00% | 0.00% | 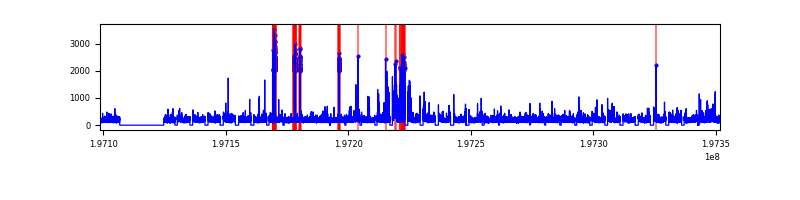 |
| B | 252952 | 205185 | 0 | 0 | 0.00% | 0.00% |  |
| C | 252952 | 205182 | 0 | 0 | 0.00% | 0.00% |  |
| D | 252952 | 205120 | 0 | 0 | 0.00% | 0.00% |  |
Top three noisy pixels from each quadrant. If the there are fewer than three noisy pixels in the level2.evt file, extra rows are filled as -1
| Pixel properties | Quadrant properties | ||||||
|---|---|---|---|---|---|---|---|
| Quadrant | DetID | PixID | Counts | Sigma | Mean | Median | Sigma |
| A | 14 | 188 | 10867 | 11.12 | 2862 | 2666 | 737.3 |
| A | 0 | 29 | 10421 | 10.52 | 2862 | 2666 | 737.3 |
| A | 7 | 110 | 10086 | 10.06 | 2862 | 2666 | 737.3 |
| B | 2 | 9 | 9234 | 11.57 | 2852 | 2704 | 564.5 |
| B | 12 | 226 | 8729 | 10.67 | 2852 | 2704 | 564.5 |
| B | 14 | 254 | 7605 | 8.68 | 2852 | 2704 | 564.5 |
| C | 12 | 241 | 7819 | 6.56 | 2886 | 2656 | 786.7 |
| C | 7 | 111 | 7787 | 6.52 | 2886 | 2656 | 786.7 |
| C | 2 | 127 | 7759 | 6.49 | 2886 | 2656 | 786.7 |
| D | 4 | 160 | 6889 | 6.08 | 2631 | 2379 | 741.8 |
| D | 1 | 19 | 6775 | 5.93 | 2631 | 2379 | 741.8 |
| D | 1 | 3 | 6755 | 5.9 | 2631 | 2379 | 741.8 |
Histogram calculated using DETX and DETY for each event in the final _common_clean file
| Quadrant A |  |
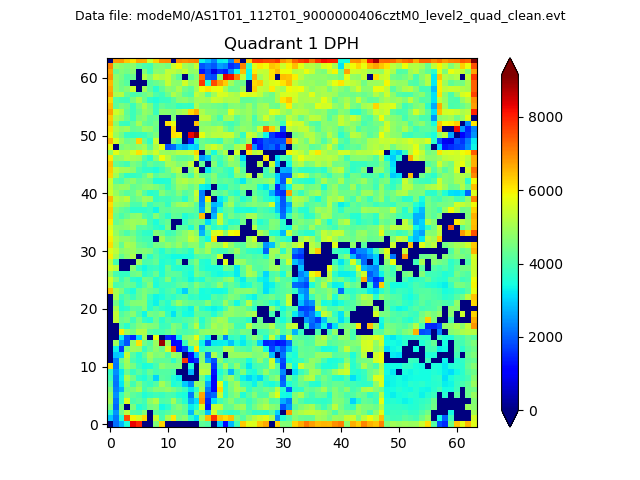 |
Quadrant B |
|---|---|---|---|
| Quadrant D |  |
 |
Quadrant C |
| Plot type | Count rate plots | Images |
|---|---|---|
| Comparison with Poisson distribution Blue bars denote a histogram of data divided into 1 sec bins. Red curve is a Poisson curve with rate = median count rate of data. |
 |
 |
| Quadrant-wise count rates Data is divided into 100 sec bins |
 |
|
| Module-wise count rates for Quadrant A Data is divided into 100 sec bins |
 |
 |
| Module-wise count rates for Quadrant B Data is divided into 100 sec bins |
 |
 |
| Module-wise count rates for Quadrant C Data is divided into 100 sec bins |
 |
 |
| Module-wise count rates for Quadrant D Data is divided into 100 sec bins |
 |
 |
| Parameter | Plot |
|---|---|
| CZT HV Monitor |  |
| D_VDD | 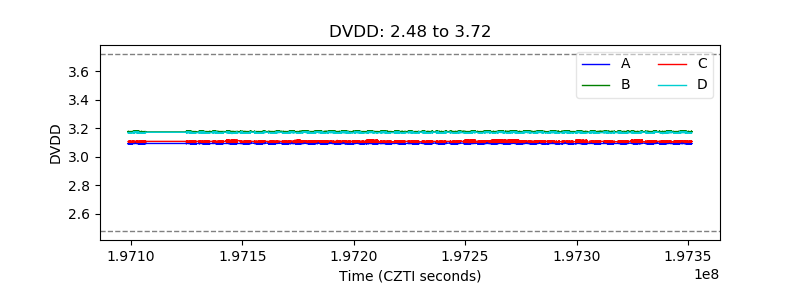 |
| Temperature 1 |  |
| Veto HV Monitor |  |
| Veto LLD |  |
| Alpha Counter |  |
| _CPM_Rate | 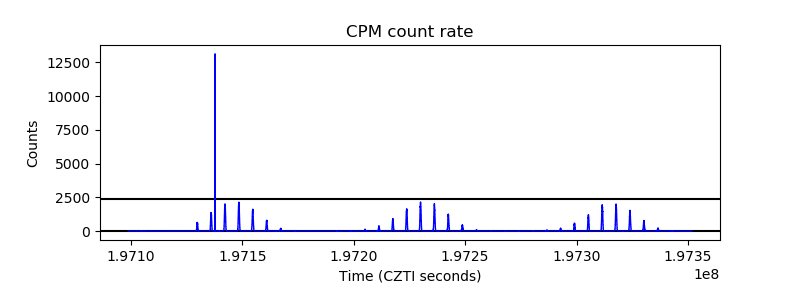 |
| CZT Counter |  |
| +2.5 Volts monitor |  |
| +5 Volts monitor |  |
| _ROLL_ROT |  |
| _Roll_DEC |  |
| _Roll_RA |  |
| Veto Counter |  |