| Param | Original file | Final file |
|---|---|---|
| Filename | modeM0/AS1T01_112T01_9000000406_02741cztM0_level2.fits | modeM0/AS1T01_112T01_9000000406_02741cztM0_level2_quad_clean.evt |
| Size (bytes) | 477,264,960 | 134,055,360 |
| Size | 455.2 MB | 127.8 MB |
| Events in quadrant A | 3,672,145 | 891,725 |
| Events in quadrant B | 5,692,530 | 879,620 |
| Events in quadrant C | 3,666,095 | 908,512 |
| Events in quadrant D | 4,013,174 | 822,520 |
| Mode M0 | |||
|---|---|---|---|
| Quadrant | BADHDUFLAG | Total packets | Discarded packets |
| A | 0 | 16462 | 1 |
| B | 0 | 22407 | 0 |
| C | 0 | 16481 | 0 |
| D | 0 | 17600 | 0 |
| Mode SS | |||
|---|---|---|---|
| Quadrant | BADHDUFLAG | Total packets | Discarded packets |
| A | 0 | 160 | 0 |
| B | 0 | 160 | 0 |
| C | 0 | 160 | 0 |
| D | 0 | 160 | 0 |
| Quadrant | Total seconds | Saturated seconds | Saturation percentage |
|---|---|---|---|
| A | 8006 | 205 | 2.560580% |
| B | 8006 | 694 | 8.668499% |
| C | 8006 | 84 | 1.049213% |
| D | 8006 | 133 | 1.661254% |
Noise dominated data is calculated using 1-second bins in cleaned event files. If a bin has >2000 counts, and if more than 50% of those come from <1% of pixels, then it is considered to be noise-dominated and hence unusable.
| Quadrant | # 1 sec bins | Bins with >0 counts | Bins with >2000 counts | High rate bins dominated by noise | Noise dominated (total time) | Noise dominated (detector-on time) | Marked lightcurve |
|---|---|---|---|---|---|---|---|
| A | 8006 | 8006 | 0 | 0 | 0.00% | 0.00% | 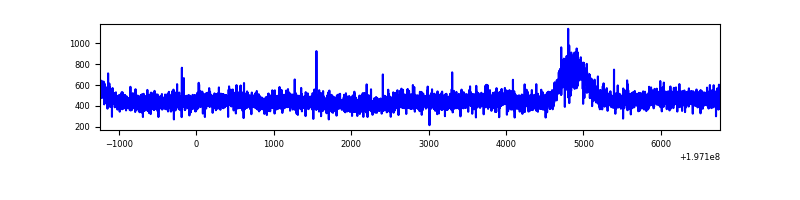 |
| B | 8006 | 8006 | 213 | 213 | 2.66% | 2.66% | 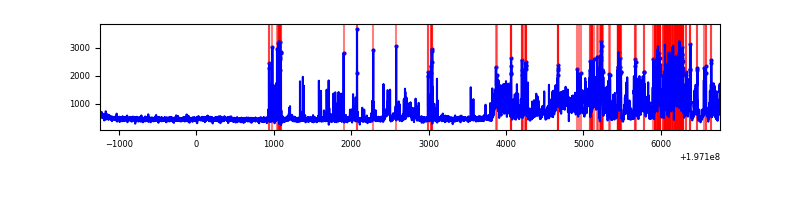 |
| C | 8006 | 8006 | 1 | 1 | 0.01% | 0.01% | 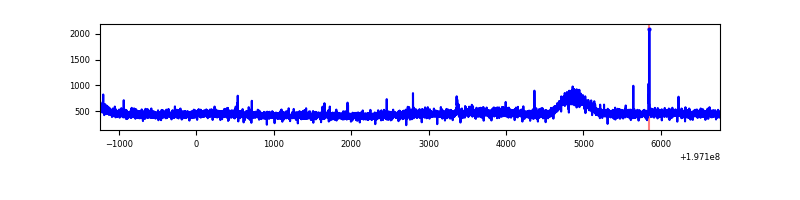 |
| D | 8006 | 8006 | 19 | 19 | 0.24% | 0.24% | 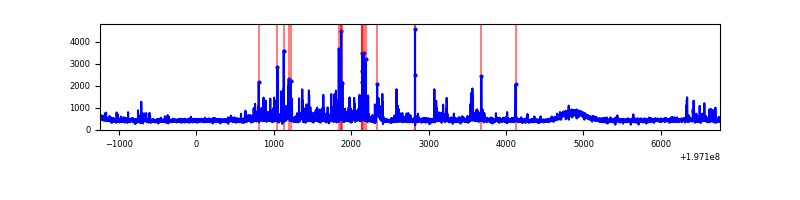 |
Top three noisy pixels from each quadrant. If the there are fewer than three noisy pixels in the level2.evt file, extra rows are filled as -1
| Pixel properties | Quadrant properties | ||||||
|---|---|---|---|---|---|---|---|
| Quadrant | DetID | PixID | Counts | Sigma | Mean | Median | Sigma |
| A | 8 | 15 | 21218 | 102.32 | 949 | 926 | 198.3 |
| A | 12 | 194 | 10445 | 48.0 | 949 | 926 | 198.3 |
| A | 0 | 226 | 9708 | 44.28 | 949 | 926 | 198.3 |
| B | 14 | 167 | 1818622 | 9937.1 | 947 | 924 | 182.9 |
| B | 6 | 36 | 158419 | 861.0 | 947 | 924 | 182.9 |
| B | 10 | 244 | 36391 | 193.89 | 947 | 924 | 182.9 |
| C | 5 | 172 | 9904 | 41.21 | 929 | 934 | 217.7 |
| C | 13 | 61 | 8285 | 33.77 | 929 | 934 | 217.7 |
| C | 12 | 4 | 6322 | 24.75 | 929 | 934 | 217.7 |
| D | 7 | 67 | 260125 | 1181.69 | 916 | 893 | 219.4 |
| D | 9 | 64 | 70853 | 318.91 | 916 | 893 | 219.4 |
| D | 5 | 172 | 48908 | 218.87 | 916 | 893 | 219.4 |
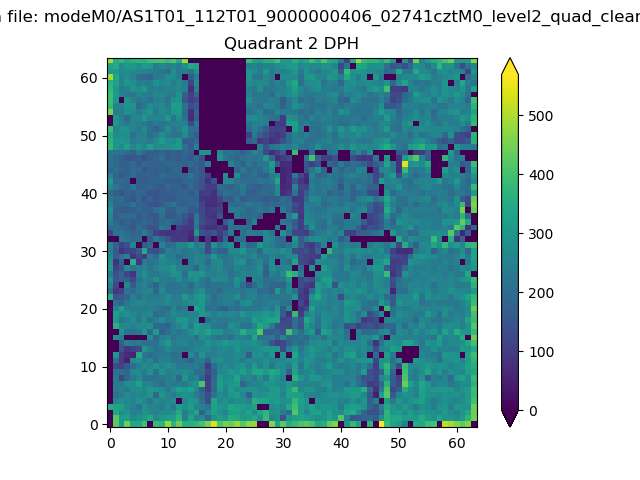
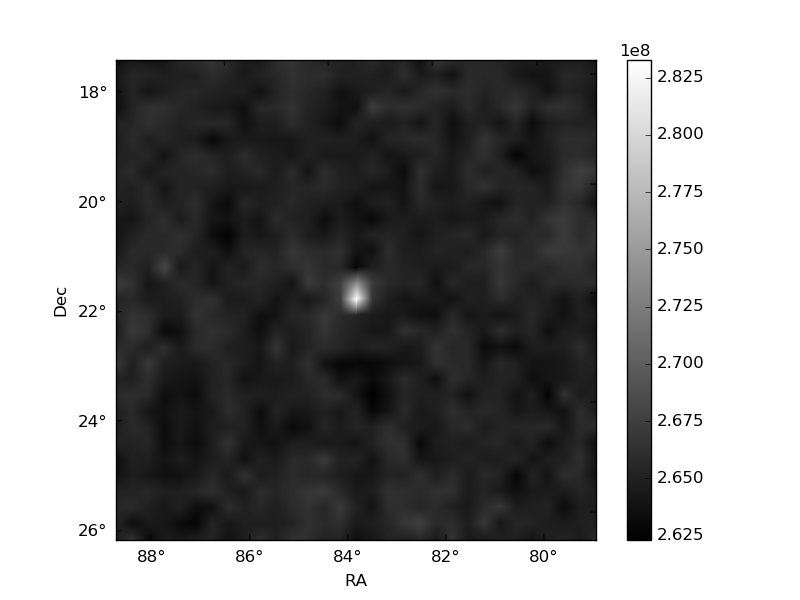
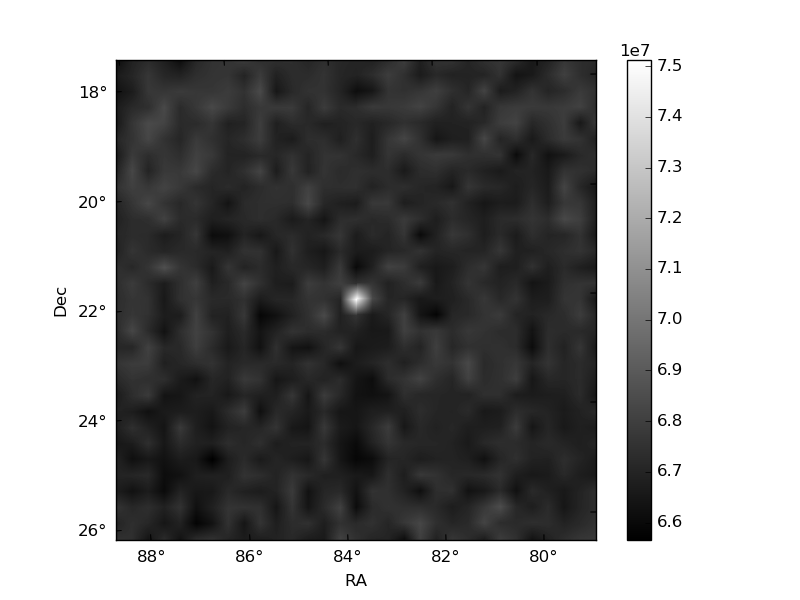
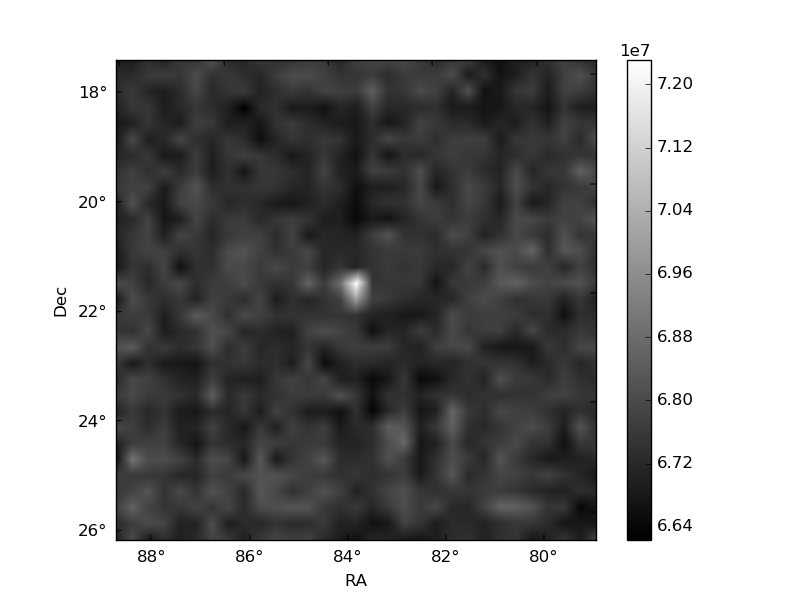
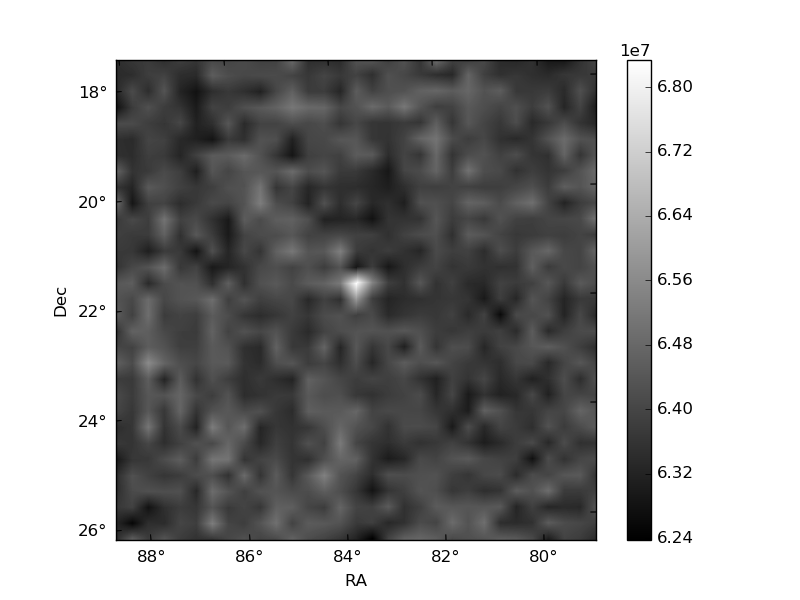
Histogram calculated using DETX and DETY for each event in the final _common_clean file
| Quadrant A | 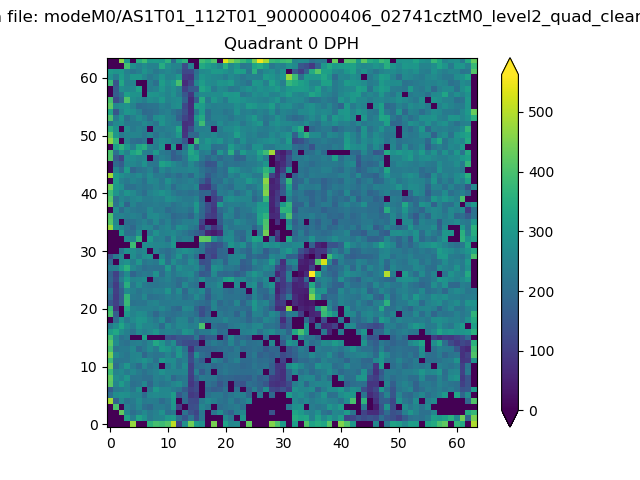 |
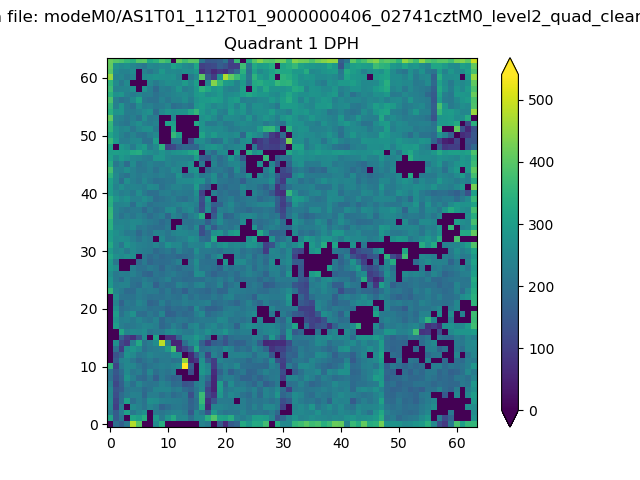 |
Quadrant B |
|---|---|---|---|
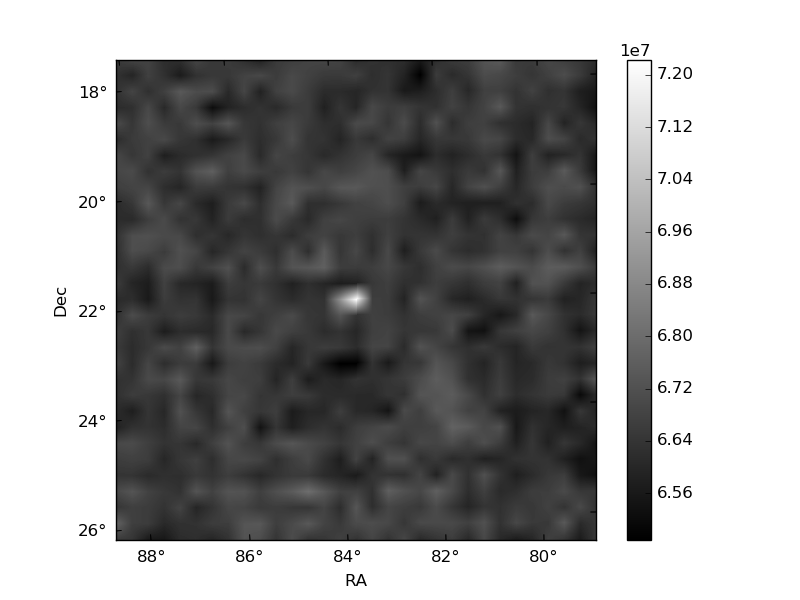
| Quadrant D | 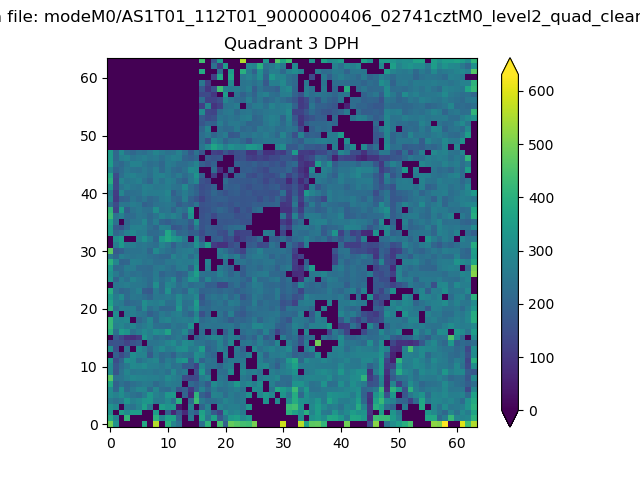 |
 |
Quadrant C |
| Plot type | Count rate plots | Images |
|---|---|---|
| Comparison with Poisson distribution Blue bars denote a histogram of data divided into 1 sec bins. Red curve is a Poisson curve with rate = median count rate of data. |
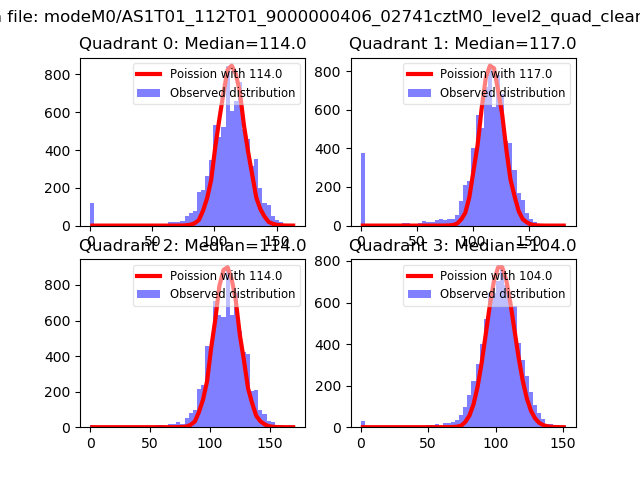 |
 |
| Quadrant-wise count rates Data is divided into 100 sec bins |
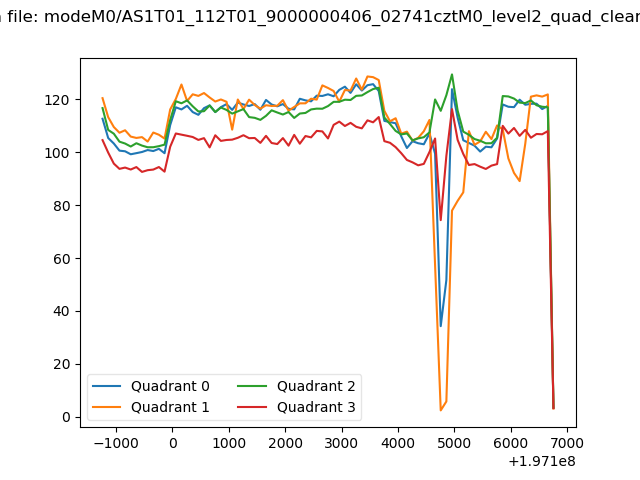 |
|
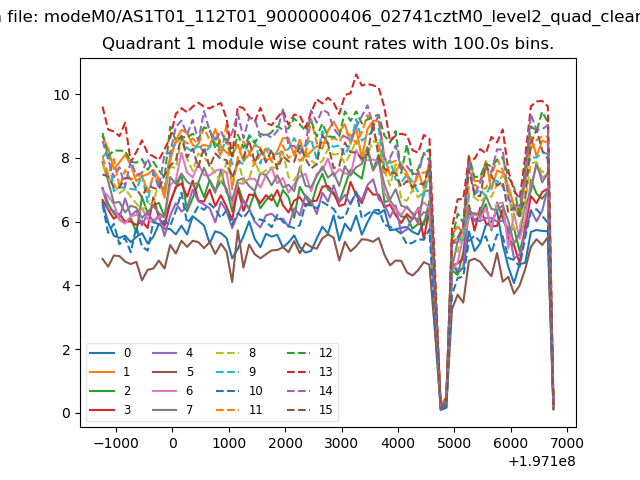
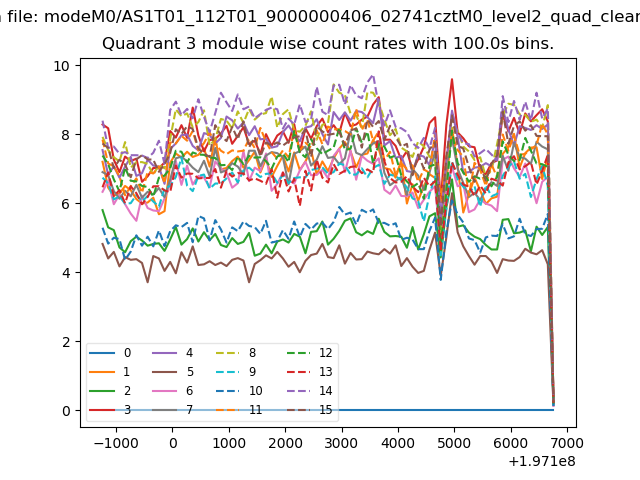
| Module-wise count rates for Quadrant A Data is divided into 100 sec bins |
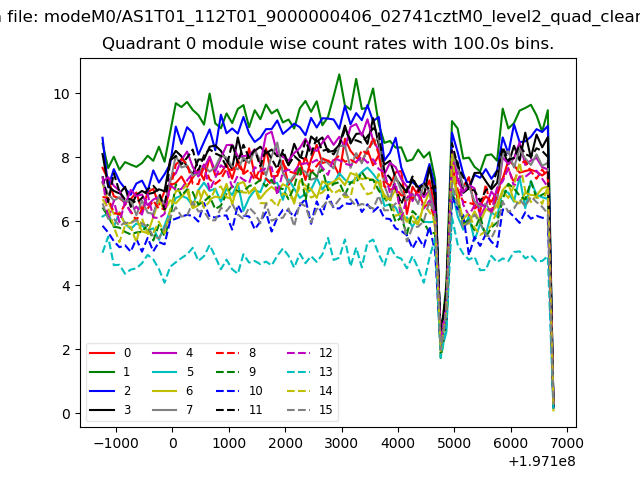 |
 |
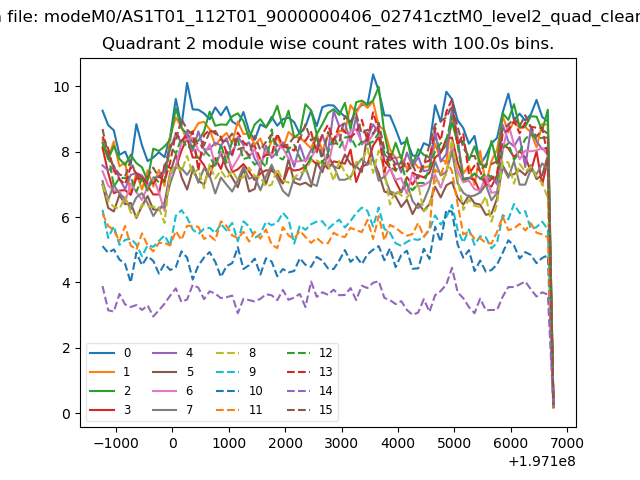
| Module-wise count rates for Quadrant B Data is divided into 100 sec bins |
 |
 |
| Module-wise count rates for Quadrant C Data is divided into 100 sec bins |
 |
 |
| Module-wise count rates for Quadrant D Data is divided into 100 sec bins |
 |
 |
| Parameter | Plot |
|---|---|
| CZT HV Monitor | 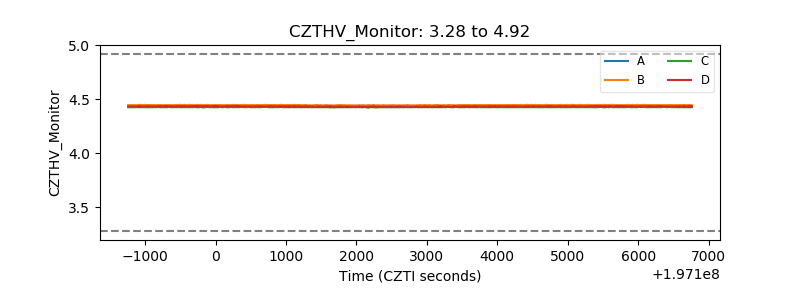 |
| D_VDD | 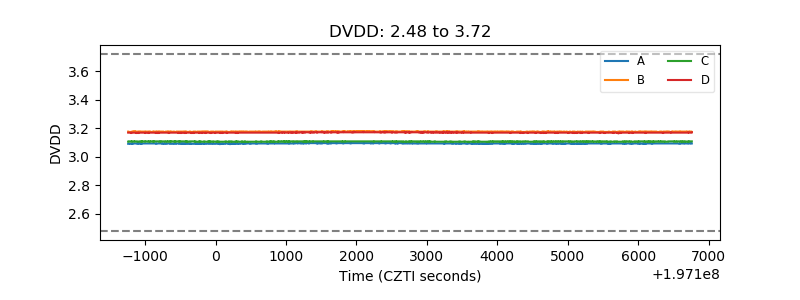 |
| Temperature 1 | 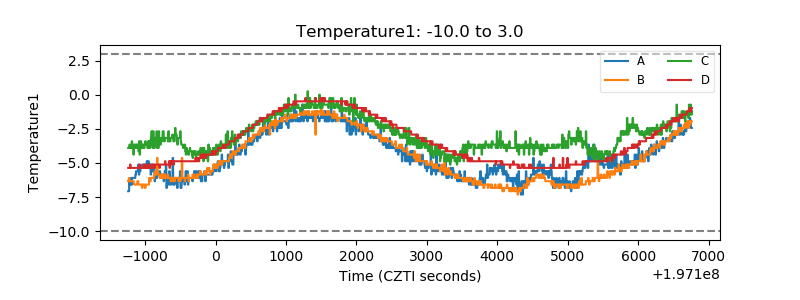 |
| Veto HV Monitor | 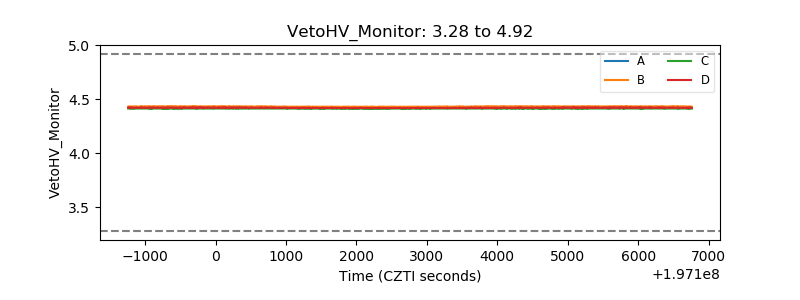 |
| Veto LLD | 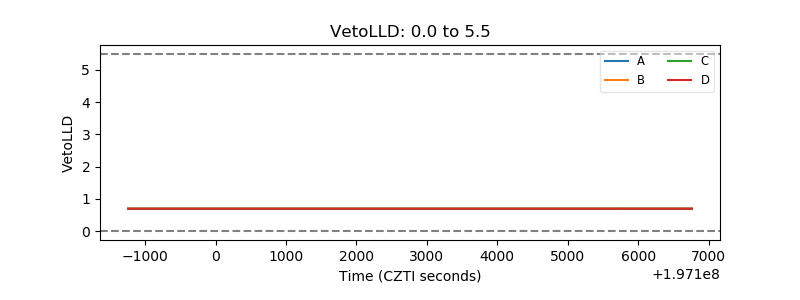 |
| Alpha Counter | 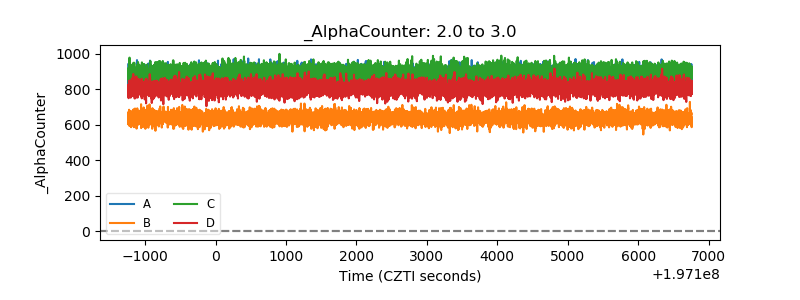 |
| _CPM_Rate | 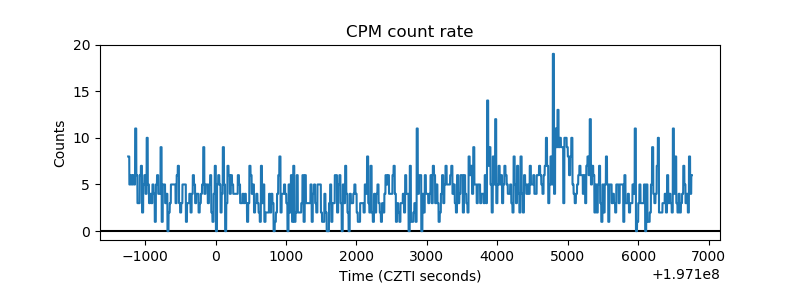 |
| CZT Counter | 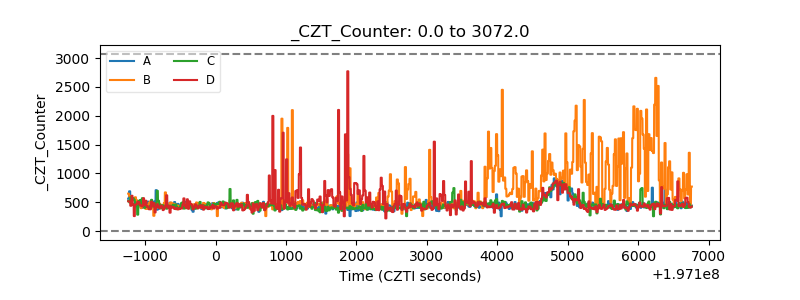 |
| +2.5 Volts monitor |  |
| +5 Volts monitor |  |
| _ROLL_ROT | 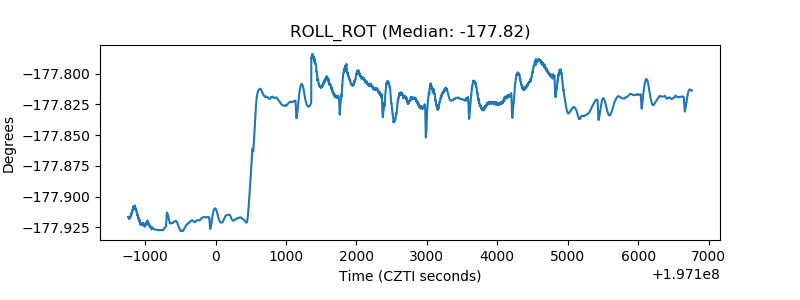 |
| _Roll_DEC | 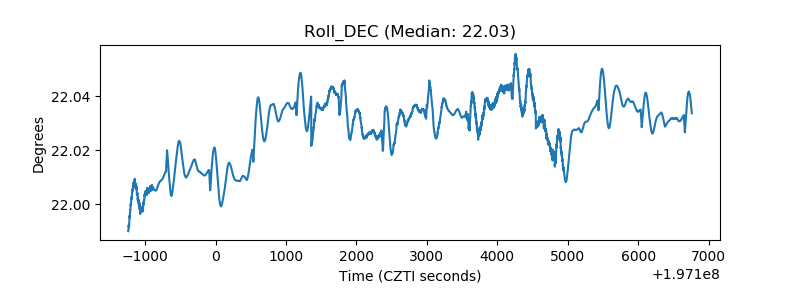 |
| _Roll_RA | 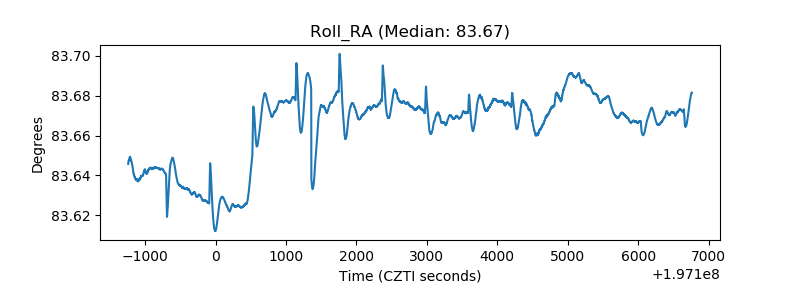 |
| Veto Counter | 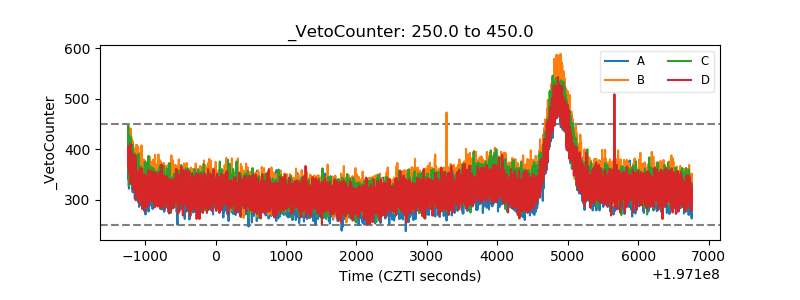 |