| Param | Original file | Final file |
|---|---|---|
| Filename | modeM0/AS1T01_112T01_9000000406_02753cztM0_level2.fits | modeM0/AS1T01_112T01_9000000406_02753cztM0_level2_quad_clean.evt |
| Size (bytes) | 399,435,840 | 118,350,720 |
| Size | 380.9 MB | 112.9 MB |
| Events in quadrant A | 3,700,841 | 778,897 |
| Events in quadrant B | 3,313,926 | 819,788 |
| Events in quadrant C | 3,821,696 | 768,586 |
| Events in quadrant D | 3,395,957 | 721,285 |
| Mode M0 | |||
|---|---|---|---|
| Quadrant | BADHDUFLAG | Total packets | Discarded packets |
| A | 0 | 15963 | 2 |
| B | 0 | 14690 | 1 |
| C | 0 | 16260 | 1 |
| D | 0 | 15384 | 1 |
| Mode SS | |||
|---|---|---|---|
| Quadrant | BADHDUFLAG | Total packets | Discarded packets |
| A | 0 | 146 | 0 |
| B | 0 | 146 | 0 |
| C | 0 | 146 | 0 |
| D | 0 | 146 | 0 |
| Mode M9 | |||
|---|---|---|---|
| Quadrant | BADHDUFLAG | Total packets | Discarded packets |
| A | 0 | 5 | 0 |
| B | 0 | 5 | 0 |
| C | 0 | 5 | 0 |
| D | 0 | 5 | 0 |
| Quadrant | Total seconds | Saturated seconds | Saturation percentage |
|---|---|---|---|
| A | 7100 | 302 | 4.253521% |
| B | 7100 | 148 | 2.084507% |
| C | 7100 | 296 | 4.169014% |
| D | 7100 | 118 | 1.661972% |
Noise dominated data is calculated using 1-second bins in cleaned event files. If a bin has >2000 counts, and if more than 50% of those come from <1% of pixels, then it is considered to be noise-dominated and hence unusable.
| Quadrant | # 1 sec bins | Bins with >0 counts | Bins with >2000 counts | High rate bins dominated by noise | Noise dominated (total time) | Noise dominated (detector-on time) | Marked lightcurve |
|---|---|---|---|---|---|---|---|
| A | 7625 | 7101 | 156 | 156 | 2.05% | 2.20% | 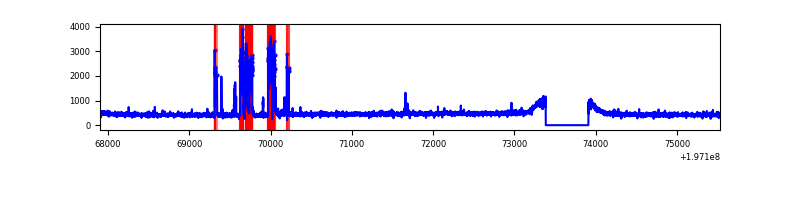 |
| B | 7625 | 7101 | 0 | 0 | 0.00% | 0.00% | 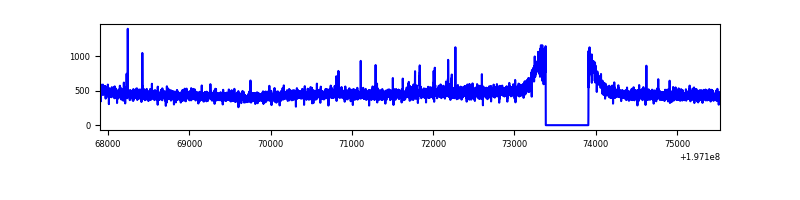 |
| C | 7625 | 7101 | 203 | 203 | 2.66% | 2.86% | 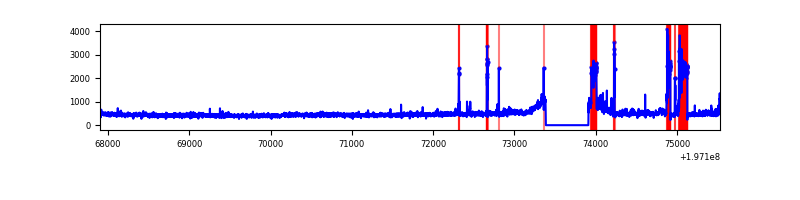 |
| D | 7625 | 7101 | 28 | 28 | 0.37% | 0.39% | 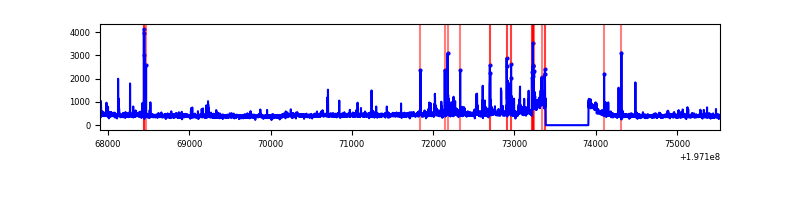 |
Top three noisy pixels from each quadrant. If the there are fewer than three noisy pixels in the level2.evt file, extra rows are filled as -1
| Pixel properties | Quadrant properties | ||||||
|---|---|---|---|---|---|---|---|
| Quadrant | DetID | PixID | Counts | Sigma | Mean | Median | Sigma |
| A | 0 | 128 | 507026 | 2944.34 | 830 | 809 | 171.9 |
| A | 0 | 226 | 8878 | 46.93 | 830 | 809 | 171.9 |
| A | 12 | 194 | 8790 | 46.42 | 830 | 809 | 171.9 |
| B | 15 | 85 | 23081 | 133.99 | 854 | 834 | 166.0 |
| B | 12 | 111 | 12483 | 70.16 | 854 | 834 | 166.0 |
| B | 11 | 111 | 10488 | 58.14 | 854 | 834 | 166.0 |
| C | 2 | 53 | 626907 | 3306.68 | 799 | 806 | 189.3 |
| C | 14 | 67 | 35510 | 183.29 | 799 | 806 | 189.3 |
| C | 10 | 65 | 9880 | 47.92 | 799 | 806 | 189.3 |
| D | 13 | 169 | 95943 | 494.45 | 800 | 782 | 192.5 |
| D | 7 | 237 | 71512 | 367.51 | 800 | 782 | 192.5 |
| D | 13 | 53 | 67545 | 346.9 | 800 | 782 | 192.5 |
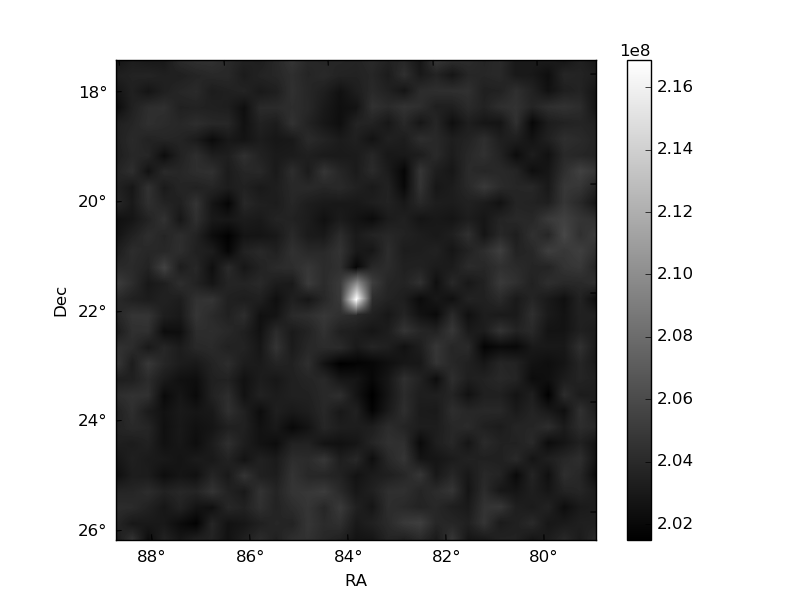
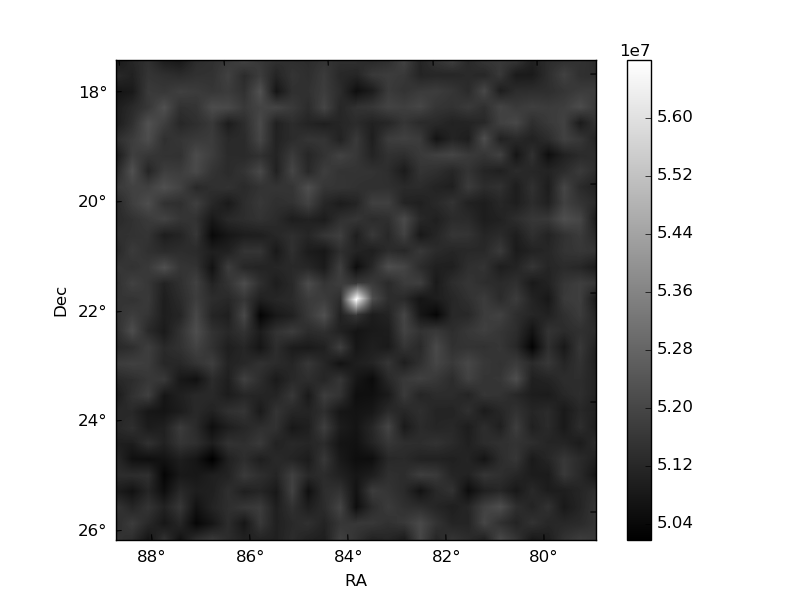
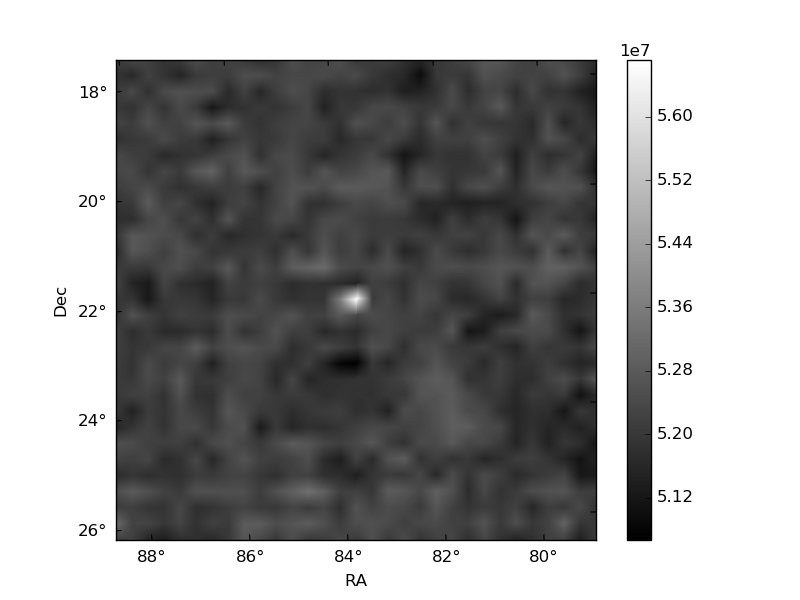
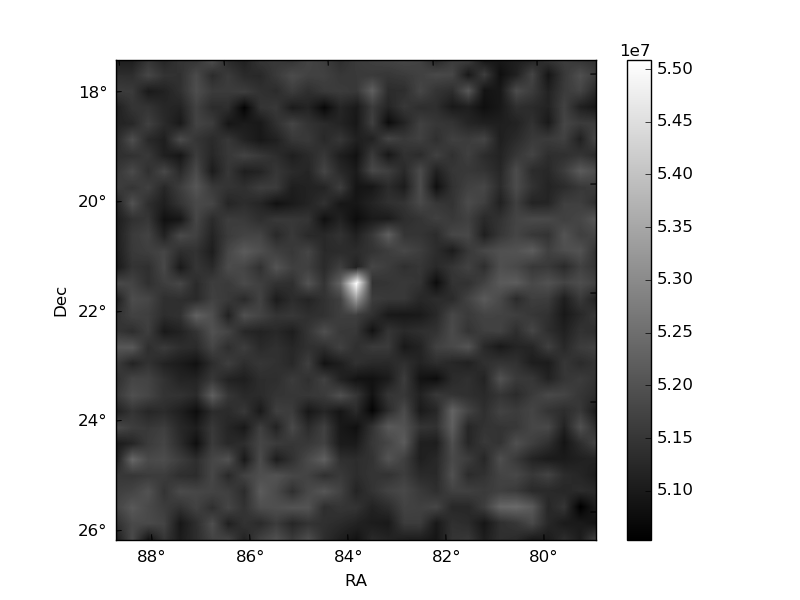
Histogram calculated using DETX and DETY for each event in the final _common_clean file
| Quadrant A | 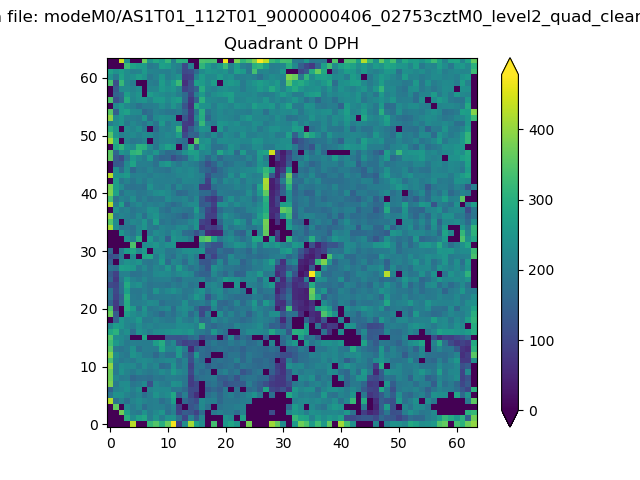 |
 |
Quadrant B |
|---|---|---|---|
| Quadrant D | 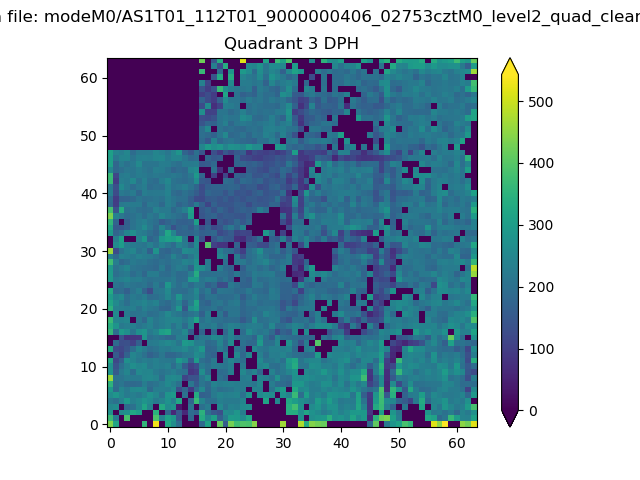 |
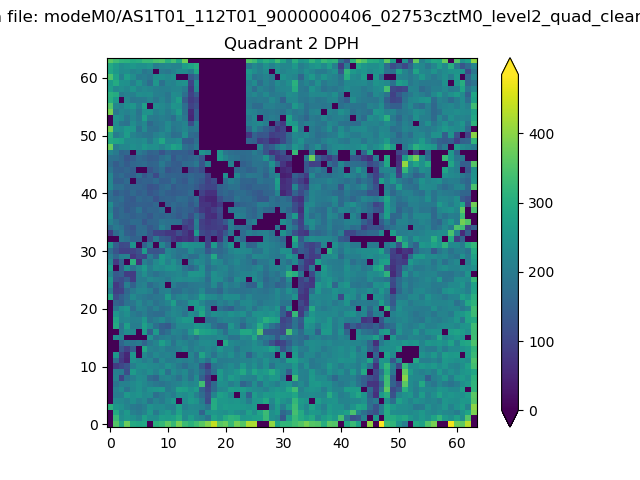 |
Quadrant C |
| Plot type | Count rate plots | Images |
|---|---|---|
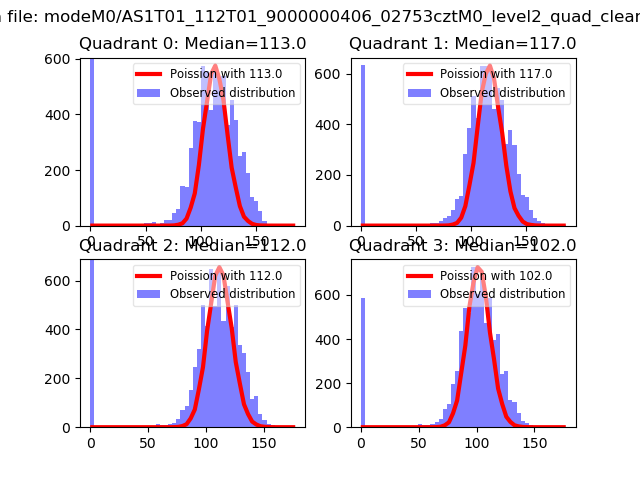
| Comparison with Poisson distribution Blue bars denote a histogram of data divided into 1 sec bins. Red curve is a Poisson curve with rate = median count rate of data. |
 |
 |
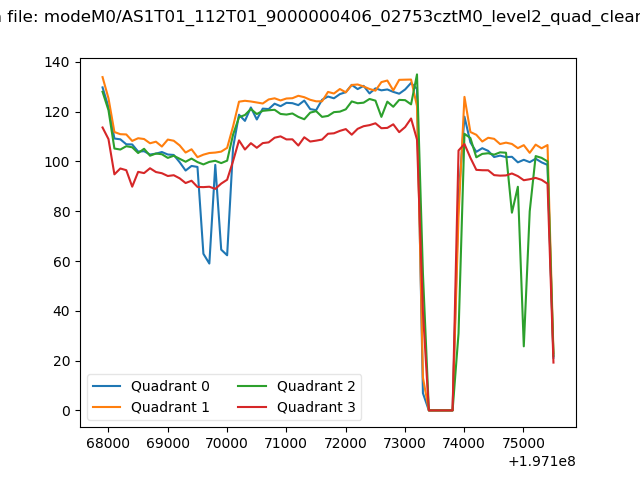
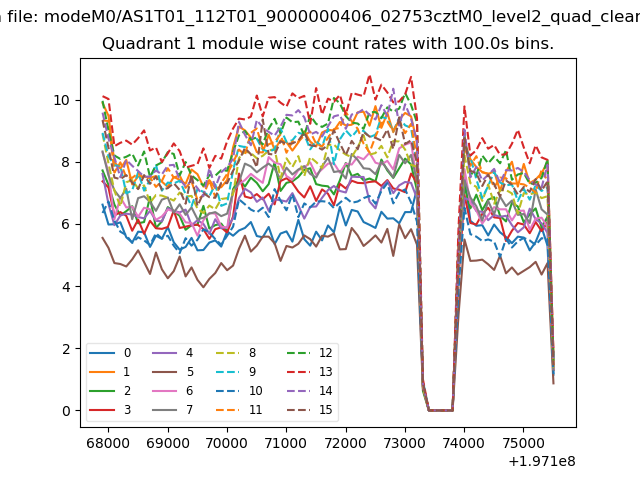
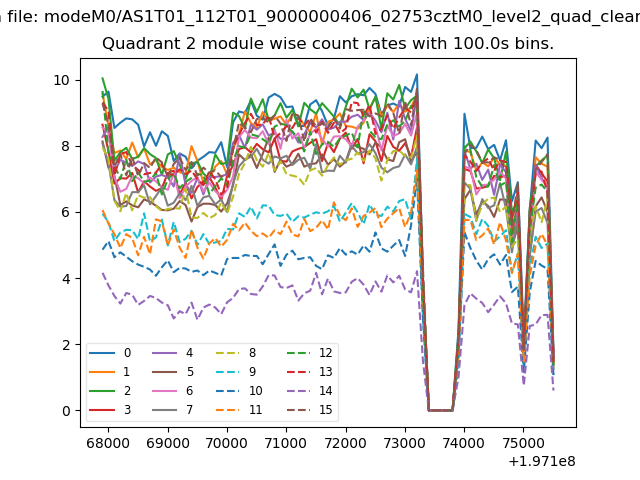
| Quadrant-wise count rates Data is divided into 100 sec bins |
 |
|
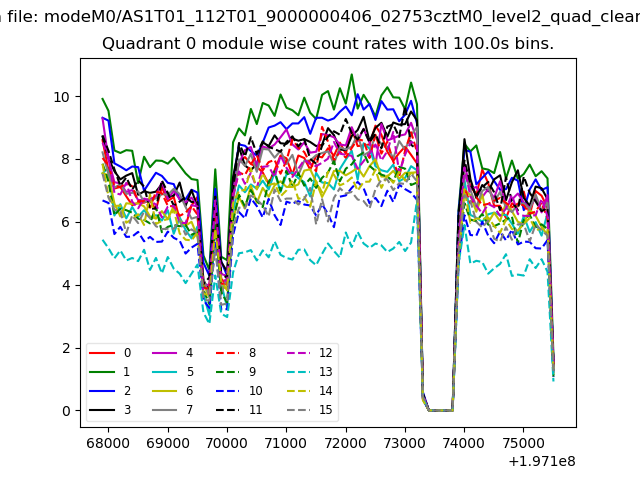
| Module-wise count rates for Quadrant A Data is divided into 100 sec bins |
 |
 |
| Module-wise count rates for Quadrant B Data is divided into 100 sec bins |
 |
 |
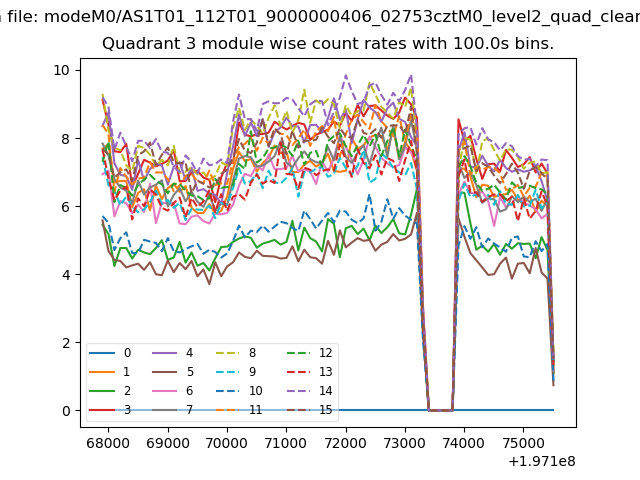
| Module-wise count rates for Quadrant C Data is divided into 100 sec bins |
 |
 |
| Module-wise count rates for Quadrant D Data is divided into 100 sec bins |
 |
 |
| Parameter | Plot |
|---|---|
| CZT HV Monitor | 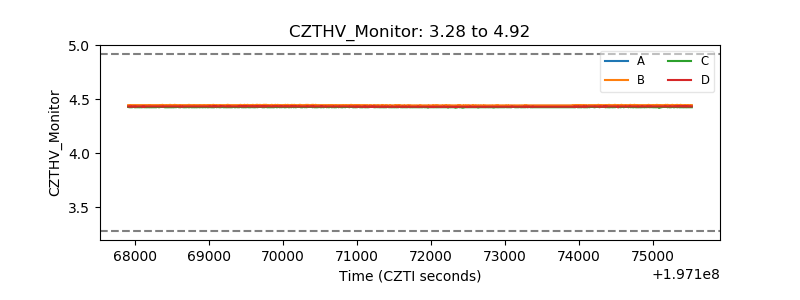 |
| D_VDD | 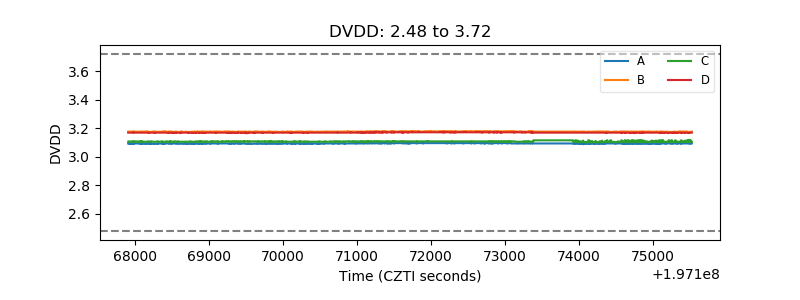 |
| Temperature 1 | 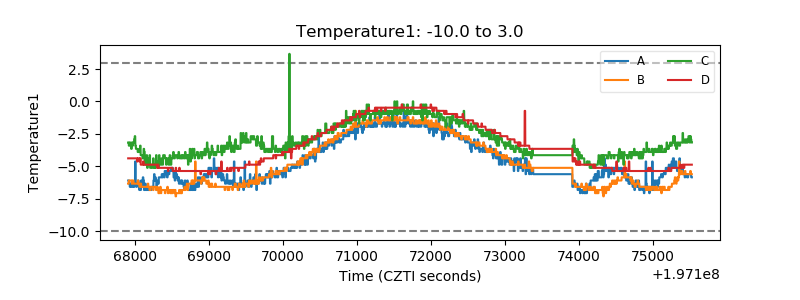 |
| Veto HV Monitor | 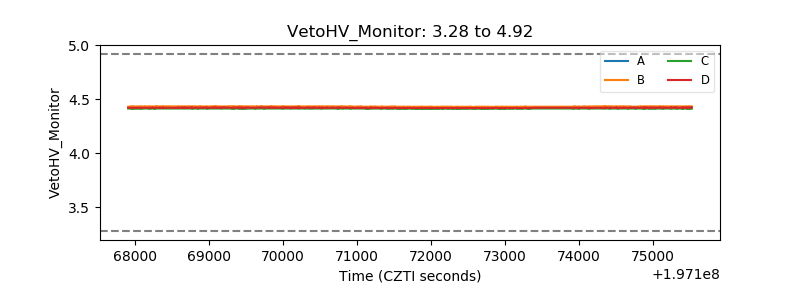 |
| Veto LLD | 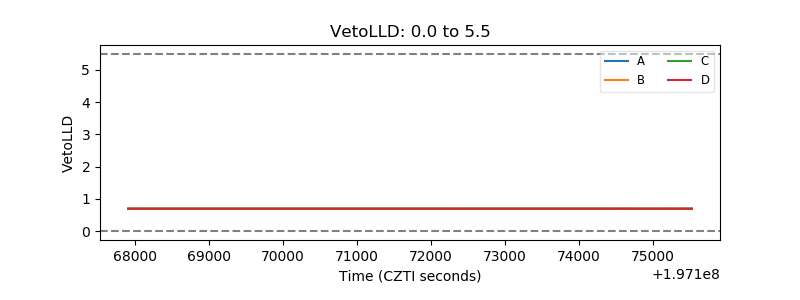 |
| Alpha Counter | 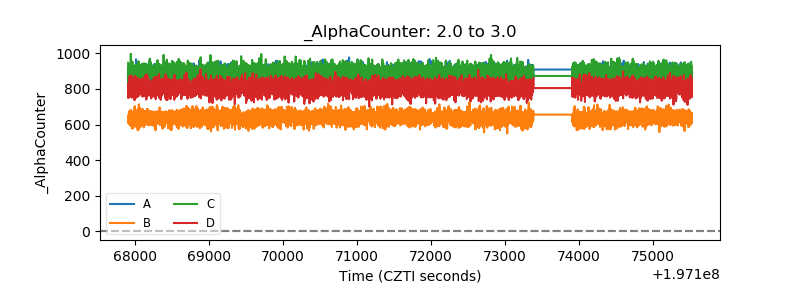 |
| _CPM_Rate | 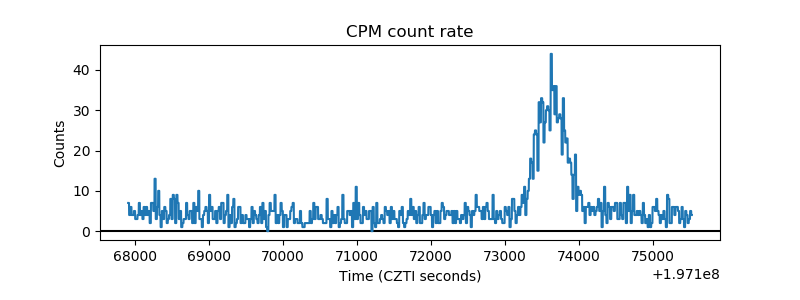 |
| CZT Counter | 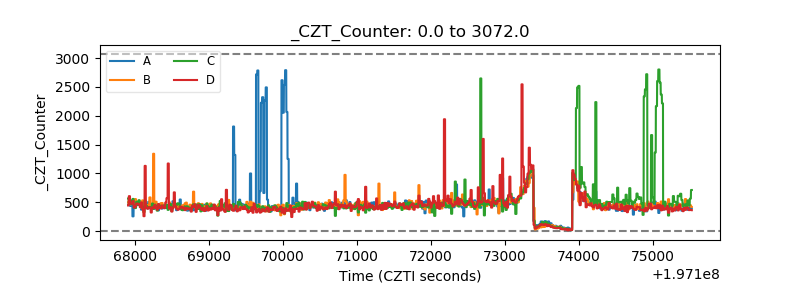 |
| +2.5 Volts monitor | 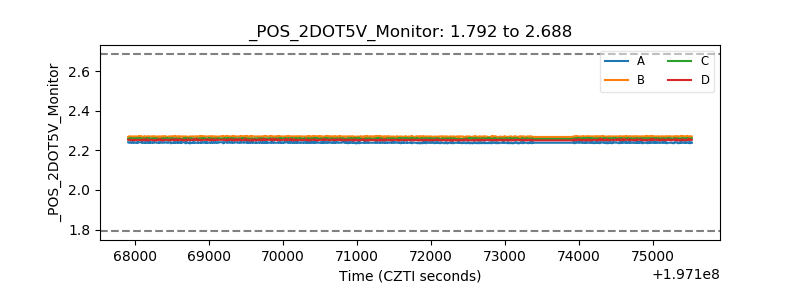 |
| +5 Volts monitor | 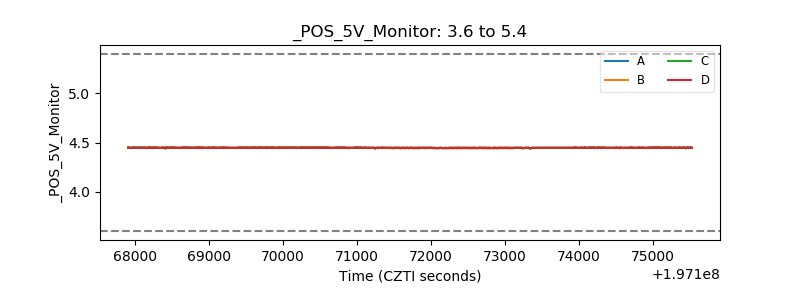 |
| _ROLL_ROT | 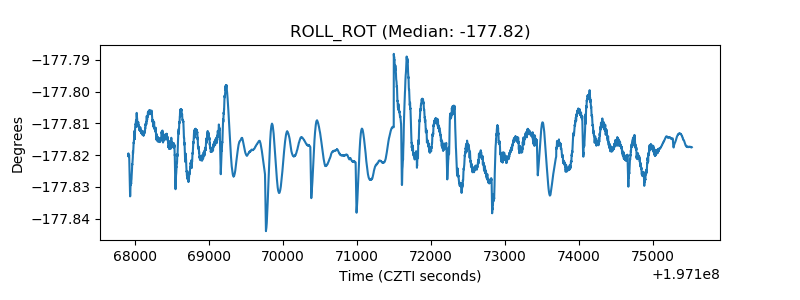 |
| _Roll_DEC | 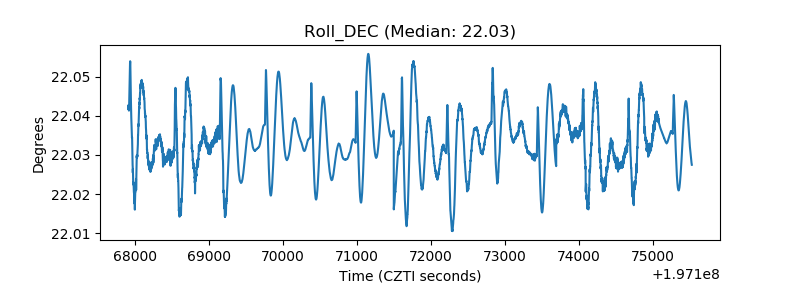 |
| _Roll_RA | 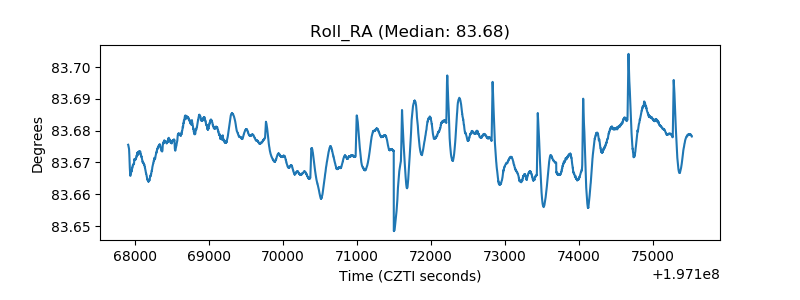 |
| Veto Counter |  |