| Param | Original file | Final file |
|---|---|---|
| Filename | modeM0/AS1P01_999T99_9000000410_02816cztM0_level2.evt | modeM0/AS1P01_999T99_9000000410_02816cztM0_level2_quad_clean.evt |
| Size (bytes) | 3,471,615,360 | 108,302,400 |
| Size | 3.2 GB | 103.3 MB |
| Events in quadrant A | 17,097,911 | 844,481 |
| Events in quadrant B | 24,539,990 | 789,329 |
| Events in quadrant C | 34,329,541 | 212,026 |
| Events in quadrant D | 28,434,522 | 640,150 |
| Mode SS | |||
|---|---|---|---|
| Quadrant | BADHDUFLAG | Total packets | Discarded packets |
| A | 0 | 234 | 0 |
| B | 0 | 234 | 0 |
| C | 0 | 234 | 0 |
| D | 0 | 234 | 0 |
| Mode M9 | |||
|---|---|---|---|
| Quadrant | BADHDUFLAG | Total packets | Discarded packets |
| A | 0 | 13 | 0 |
| B | 0 | 14 | 0 |
| C | 0 | 12 | 0 |
| D | 0 | 12 | 0 |
| Mode M0 | |||
|---|---|---|---|
| Quadrant | BADHDUFLAG | Total packets | Discarded packets |
| A | 0 | 58874 | 0 |
| B | 0 | 81144 | 0 |
| C | 0 | 111817 | 0 |
| D | 0 | 93247 | 0 |
| Quadrant | Total seconds | Saturated seconds | Saturation percentage |
|---|---|---|---|
| A | 11409 | 415 | 3.637479% |
| B | 11374 | 2094 | 18.410410% |
| C | 11355 | 10842 | 95.482166% |
| D | 11338 | 5337 | 47.071794% |
Noise dominated data is calculated using 1-second bins in cleaned event files. If a bin has >2000 counts, and if more than 50% of those come from <1% of pixels, then it is considered to be noise-dominated and hence unusable.
| Quadrant | # 1 sec bins | Bins with >0 counts | Bins with >2000 counts | High rate bins dominated by noise | Noise dominated (total time) | Noise dominated (detector-on time) | Marked lightcurve |
|---|---|---|---|---|---|---|---|
| A | 12603 | 11409 | 1335 | 1335 | 10.59% | 11.70% | 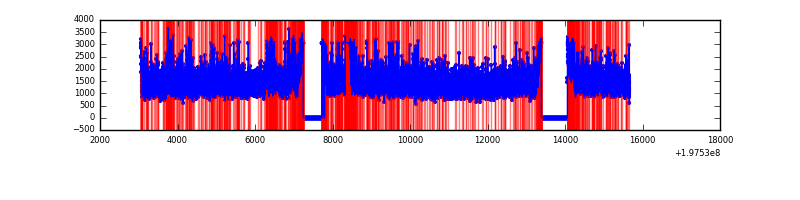 |
| B | 12568 | 11375 | 5960 | 5960 | 47.42% | 52.40% | 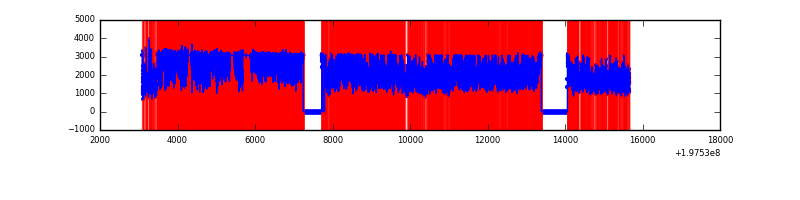 |
| C | 12549 | 11356 | 11101 | 11101 | 88.46% | 97.75% | 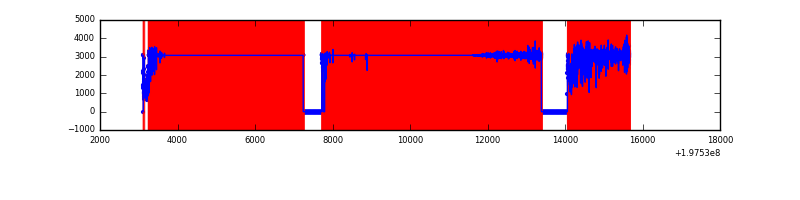 |
| D | 12532 | 11339 | 8223 | 8223 | 65.62% | 72.52% | 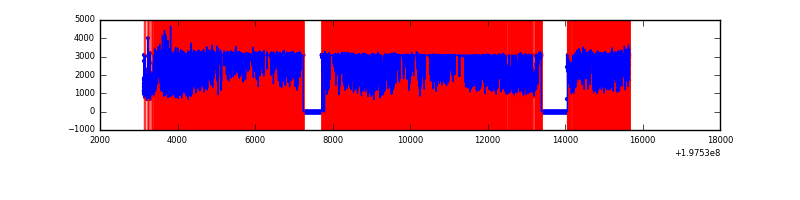 |
Top three noisy pixels from each quadrant. If the there are fewer than three noisy pixels in the level2.evt file, extra rows are filled as -1
| Pixel properties | Quadrant properties | ||||||
|---|---|---|---|---|---|---|---|
| Quadrant | DetID | PixID | Counts | Sigma | Mean | Median | Sigma |
| A | 0 | 13 | 680879 | 704.22 | 4093 | 4057 | 961.1 |
| A | 0 | 31 | 130209 | 131.26 | 4093 | 4057 | 961.1 |
| A | 0 | 50 | 111835 | 112.14 | 4093 | 4057 | 961.1 |
| B | 0 | 228 | 2888777 | 3075.76 | 4009 | 3976 | 937.9 |
| B | 1 | 158 | 1742465 | 1853.57 | 4009 | 3976 | 937.9 |
| B | 1 | 190 | 1414053 | 1503.42 | 4009 | 3976 | 937.9 |
| C | 0 | 219 | 12610806 | 35422.83 | 1182 | 1211 | 356.0 |
| C | 1 | 16 | 9957295 | 27968.6 | 1182 | 1211 | 356.0 |
| C | 1 | 192 | 2549072 | 7157.44 | 1182 | 1211 | 356.0 |
| D | 1 | 7 | 5069267 | 5276.66 | 3161 | 3213 | 960.1 |
| D | 1 | 31 | 4438077 | 4619.23 | 3161 | 3213 | 960.1 |
| D | 1 | 159 | 3232126 | 3363.14 | 3161 | 3213 | 960.1 |
Histogram calculated using DETX and DETY for each event in the final _common_clean file
| Quadrant A | 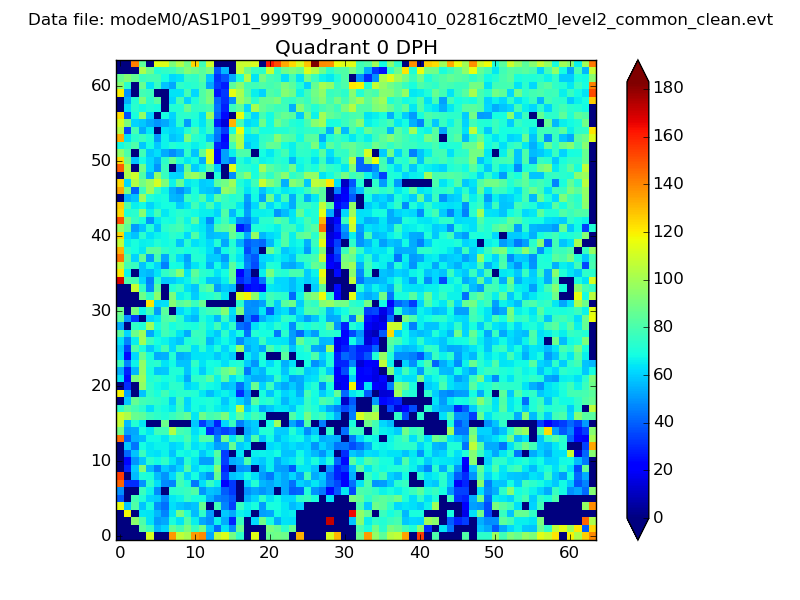 |
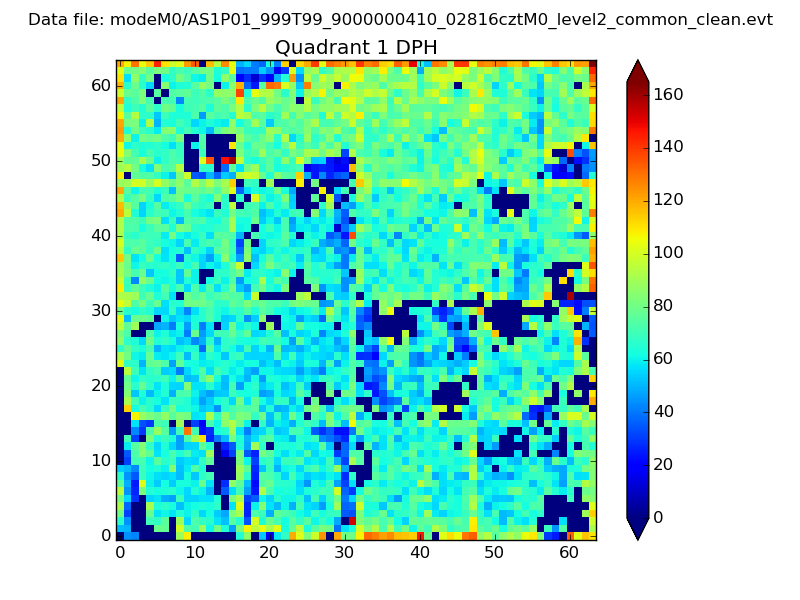 |
Quadrant B |
|---|---|---|---|
| Quadrant D | 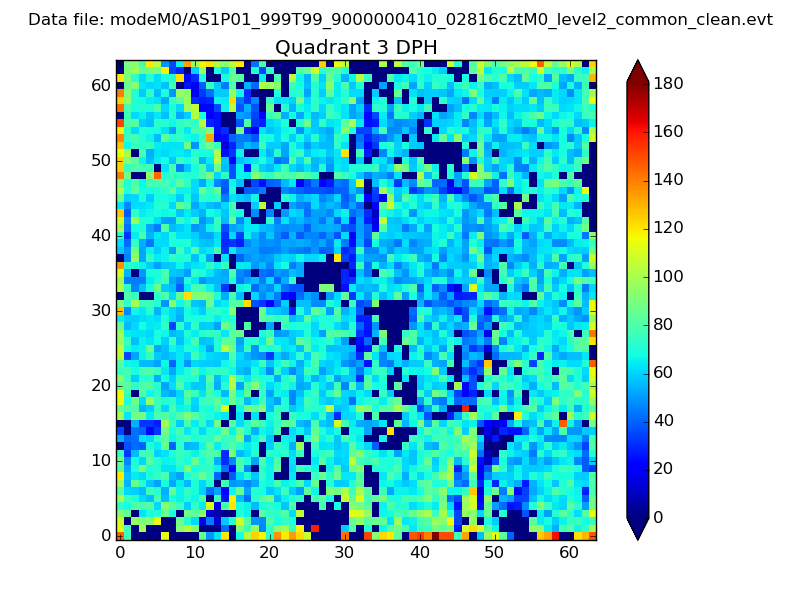 |
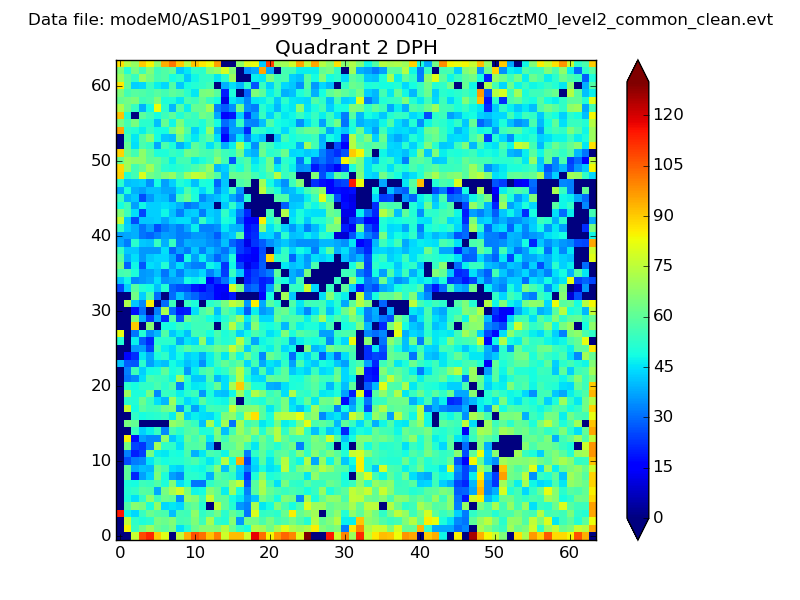 |
Quadrant C |
| Plot type | Count rate plots | Images |
|---|---|---|
| Comparison with Poisson distribution Blue bars denote a histogram of data divided into 1 sec bins. Red curve is a Poisson curve with rate = median count rate of data. |
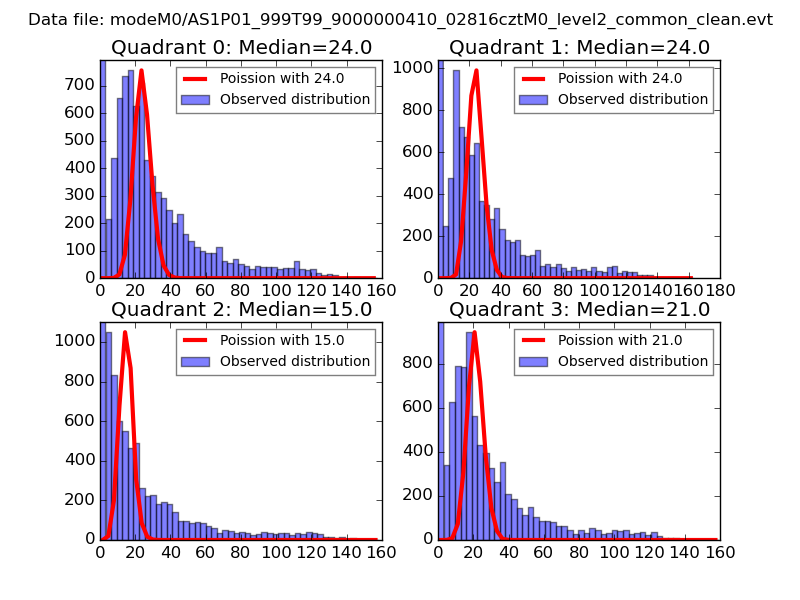 |
 |
| Quadrant-wise count rates Data is divided into 100 sec bins |
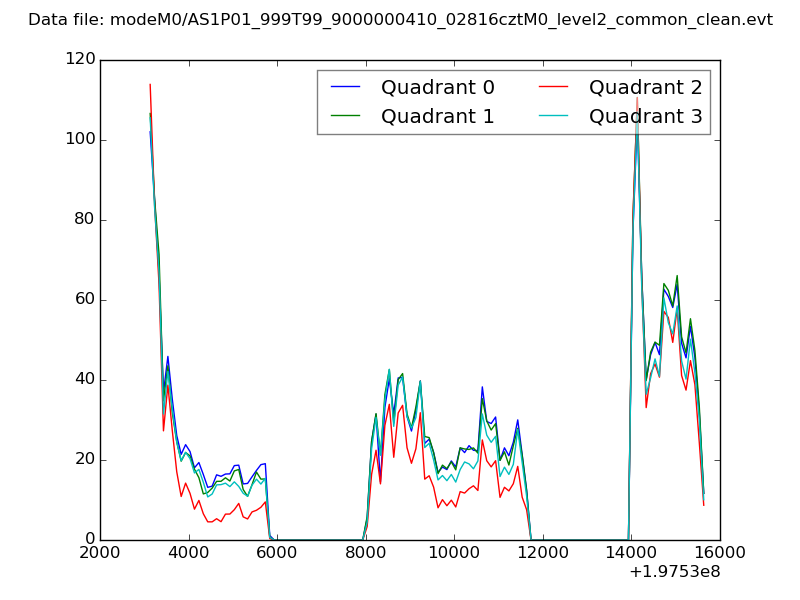 |
|
| Module-wise count rates for Quadrant A Data is divided into 100 sec bins |
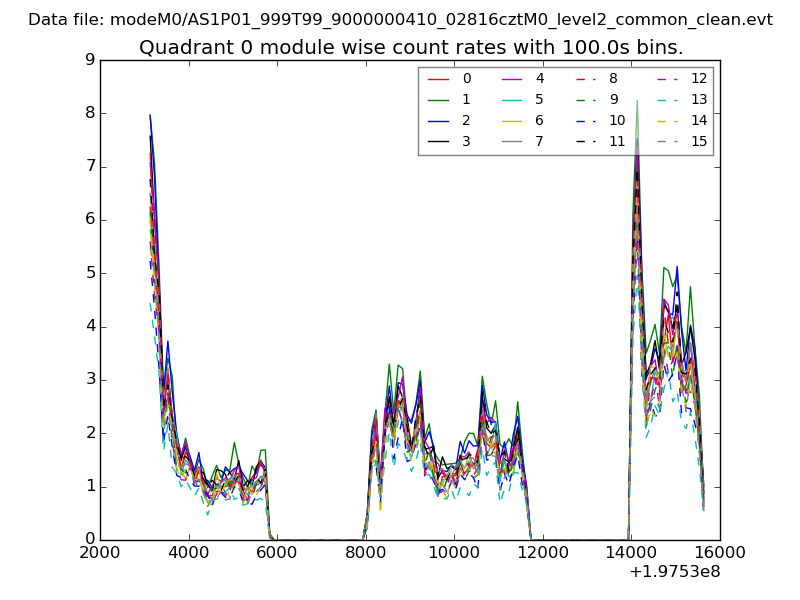 |
 |
| Module-wise count rates for Quadrant B Data is divided into 100 sec bins |
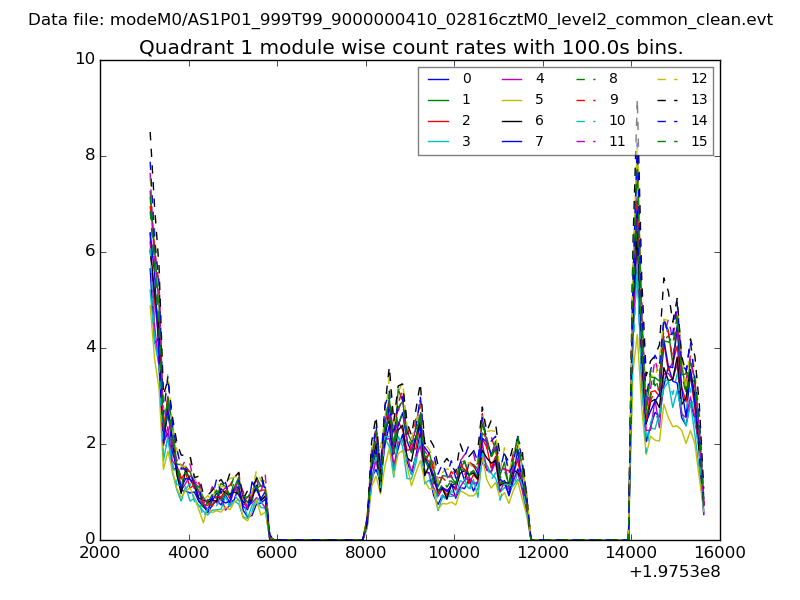 |
 |
| Module-wise count rates for Quadrant C Data is divided into 100 sec bins |
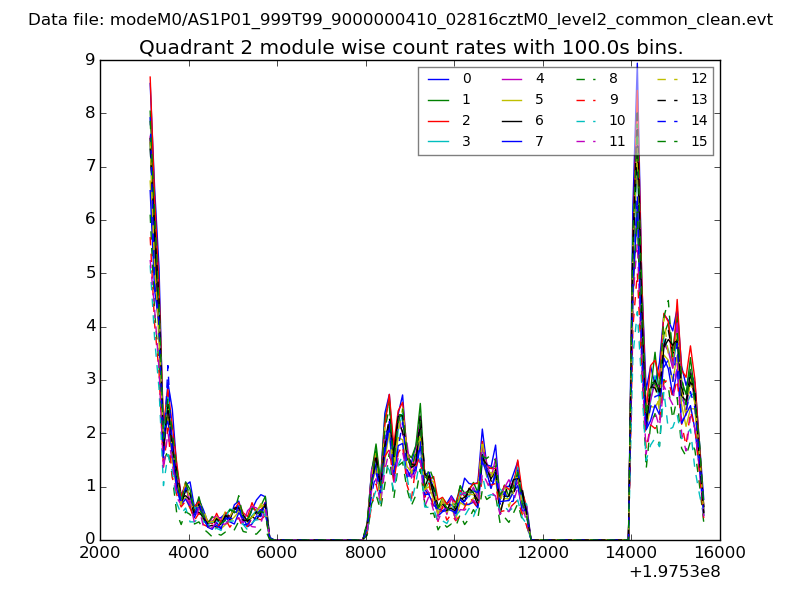 |
 |
| Module-wise count rates for Quadrant D Data is divided into 100 sec bins |
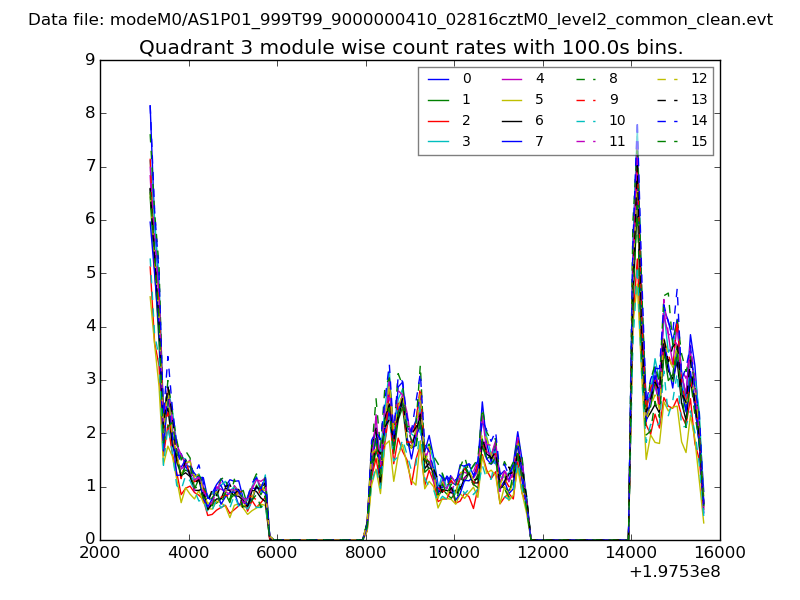 |
 |
| Parameter | Plot |
|---|---|
| CZT HV Monitor | 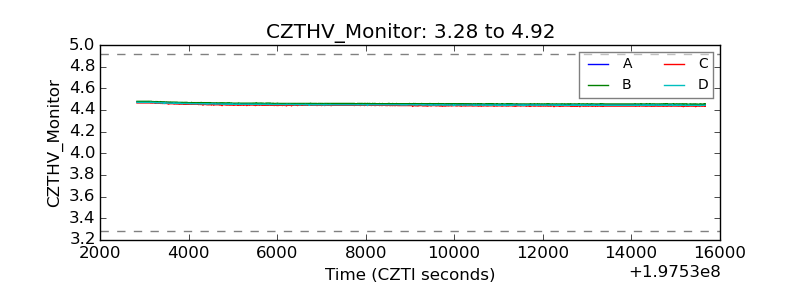 |
| D_VDD | 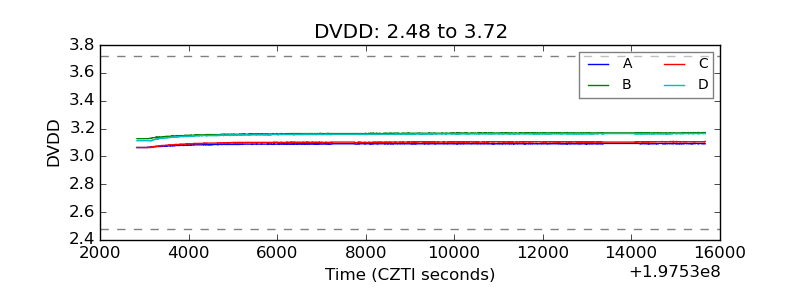 |
| Temperature 1 | 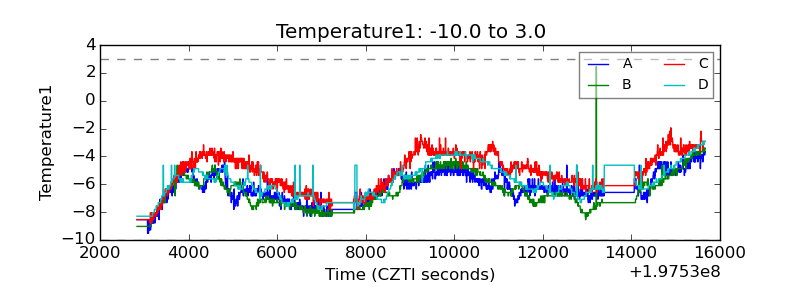 |
| Veto HV Monitor | 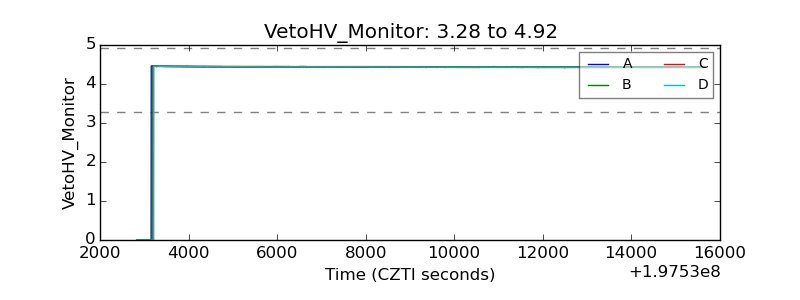 |
| Veto LLD | 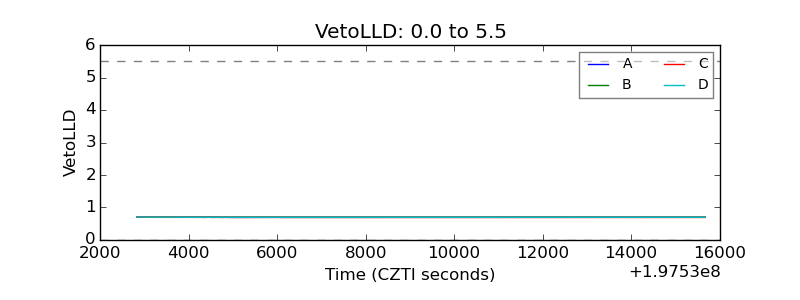 |
| Alpha Counter | 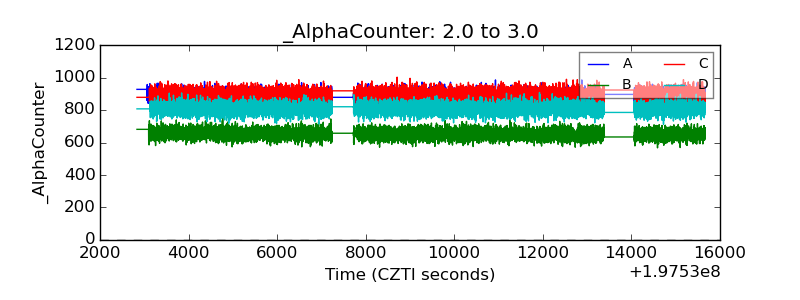 |
| _CPM_Rate | 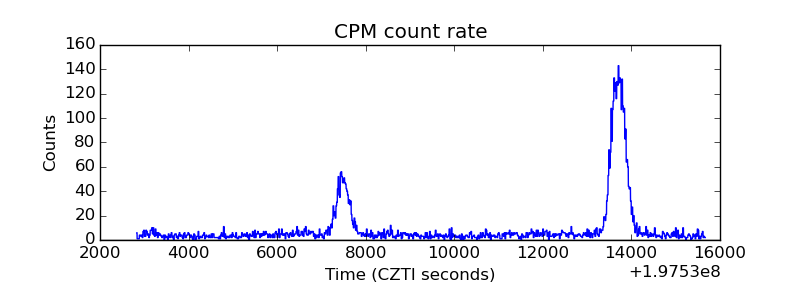 |
| CZT Counter | 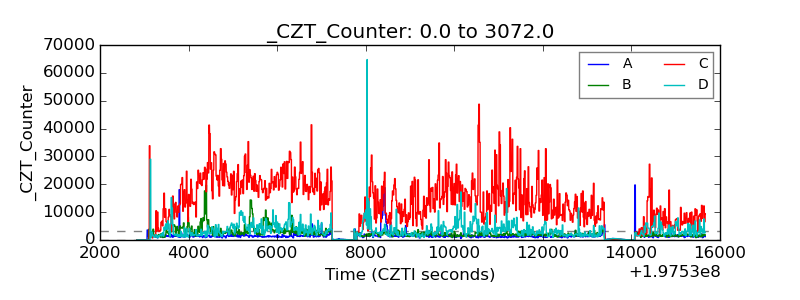 |
| +2.5 Volts monitor |  |
| +5 Volts monitor | 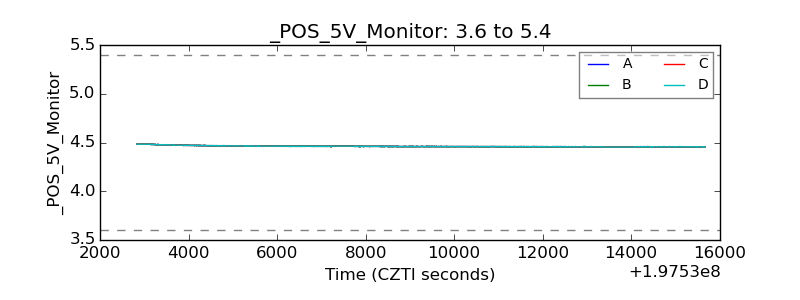 |
| Veto Counter | 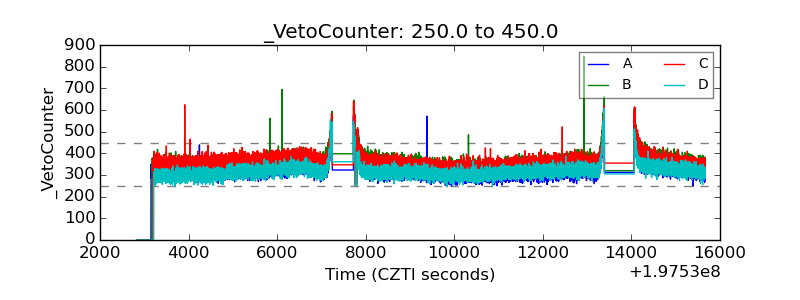 |