| Param | Original file | Final file |
|---|---|---|
| Filename | modeM0/AS1P01_999T99_9000000410_02817cztM0_level2.evt | modeM0/AS1P01_999T99_9000000410_02817cztM0_level2_quad_clean.evt |
| Size (bytes) | 1,671,690,240 | 61,148,160 |
| Size | 1.6 GB | 58.3 MB |
| Events in quadrant A | 8,514,993 | 431,289 |
| Events in quadrant B | 10,099,450 | 437,401 |
| Events in quadrant C | 17,233,330 | 222,318 |
| Events in quadrant D | 14,396,976 | 347,979 |
| Mode SS | |||
|---|---|---|---|
| Quadrant | BADHDUFLAG | Total packets | Discarded packets |
| A | 0 | 118 | 0 |
| B | 0 | 118 | 0 |
| C | 0 | 118 | 0 |
| D | 0 | 118 | 0 |
| Mode M9 | |||
|---|---|---|---|
| Quadrant | BADHDUFLAG | Total packets | Discarded packets |
| A | 0 | 9 | 0 |
| B | 0 | 9 | 0 |
| C | 0 | 9 | 0 |
| D | 0 | 9 | 0 |
| Mode M0 | |||
|---|---|---|---|
| Quadrant | BADHDUFLAG | Total packets | Discarded packets |
| A | 0 | 29461 | 2 |
| B | 0 | 34109 | 1 |
| C | 0 | 56160 | 1 |
| D | 0 | 47216 | 1 |
| Quadrant | Total seconds | Saturated seconds | Saturation percentage |
|---|---|---|---|
| A | 5874 | 126 | 2.145046% |
| B | 5874 | 123 | 2.093973% |
| C | 5874 | 4901 | 83.435478% |
| D | 5874 | 2289 | 38.968335% |
Noise dominated data is calculated using 1-second bins in cleaned event files. If a bin has >2000 counts, and if more than 50% of those come from <1% of pixels, then it is considered to be noise-dominated and hence unusable.
| Quadrant | # 1 sec bins | Bins with >0 counts | Bins with >2000 counts | High rate bins dominated by noise | Noise dominated (total time) | Noise dominated (detector-on time) | Marked lightcurve |
|---|---|---|---|---|---|---|---|
| A | 6734 | 5875 | 585 | 585 | 8.69% | 9.96% | 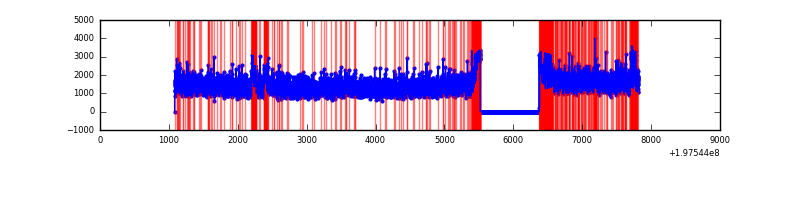 |
| B | 6734 | 5875 | 1352 | 1352 | 20.08% | 23.01% |  |
| C | 6734 | 5875 | 5496 | 5496 | 81.62% | 93.55% | 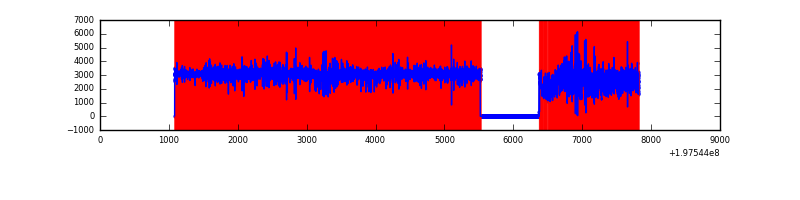 |
| D | 6734 | 5875 | 4132 | 4132 | 61.36% | 70.33% | 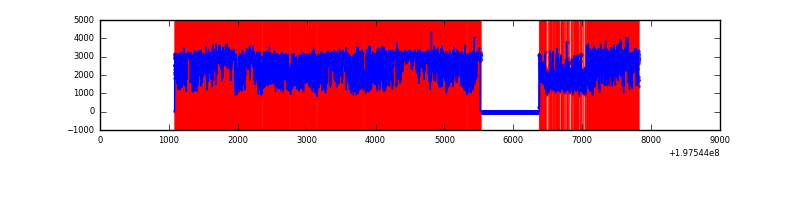 |
Top three noisy pixels from each quadrant. If the there are fewer than three noisy pixels in the level2.evt file, extra rows are filled as -1
| Pixel properties | Quadrant properties | ||||||
|---|---|---|---|---|---|---|---|
| Quadrant | DetID | PixID | Counts | Sigma | Mean | Median | Sigma |
| A | 14 | 238 | 138981 | 277.12 | 2115 | 2101 | 493.9 |
| A | 0 | 50 | 94434 | 186.93 | 2115 | 2101 | 493.9 |
| A | 12 | 32 | 81764 | 161.28 | 2115 | 2101 | 493.9 |
| B | 3 | 28 | 784570 | 1558.01 | 2148 | 2133 | 502.2 |
| B | 3 | 11 | 471071 | 933.76 | 2148 | 2133 | 502.2 |
| B | 3 | 44 | 167741 | 329.76 | 2148 | 2133 | 502.2 |
| C | 8 | 146 | 4178065 | 12756.5 | 1115 | 1151 | 327.4 |
| C | 8 | 162 | 3888221 | 11871.31 | 1115 | 1151 | 327.4 |
| C | 8 | 81 | 1770554 | 5403.84 | 1115 | 1151 | 327.4 |
| D | 15 | 50 | 3461784 | 6653.19 | 1718 | 1744 | 520.1 |
| D | 15 | 194 | 2101879 | 4038.28 | 1718 | 1744 | 520.1 |
| D | 15 | 35 | 1174113 | 2254.31 | 1718 | 1744 | 520.1 |
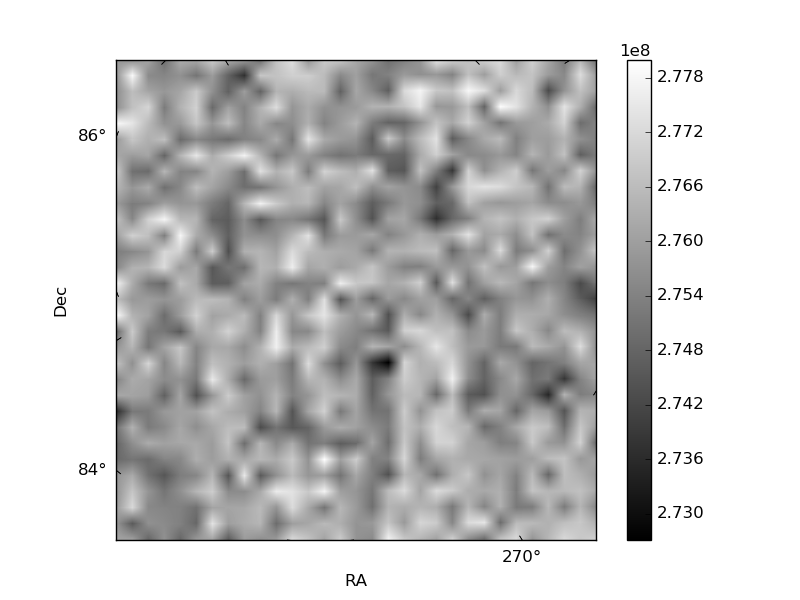
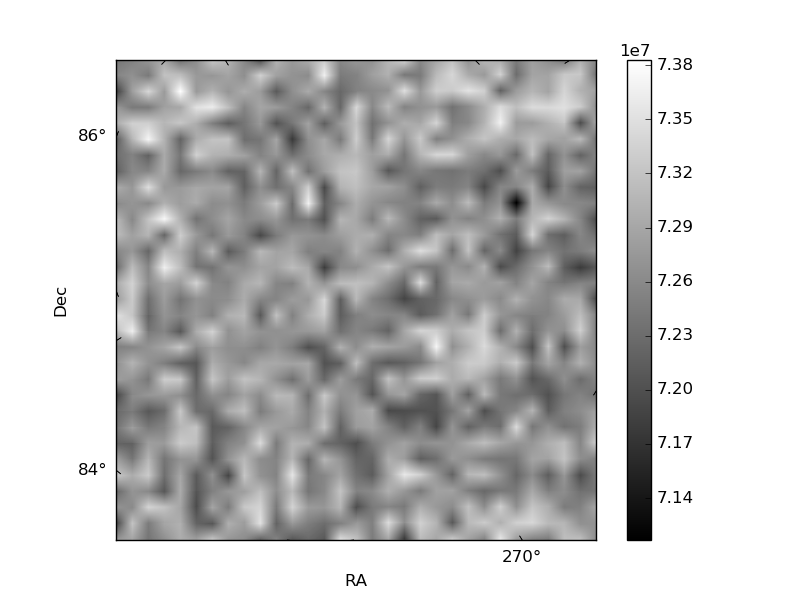
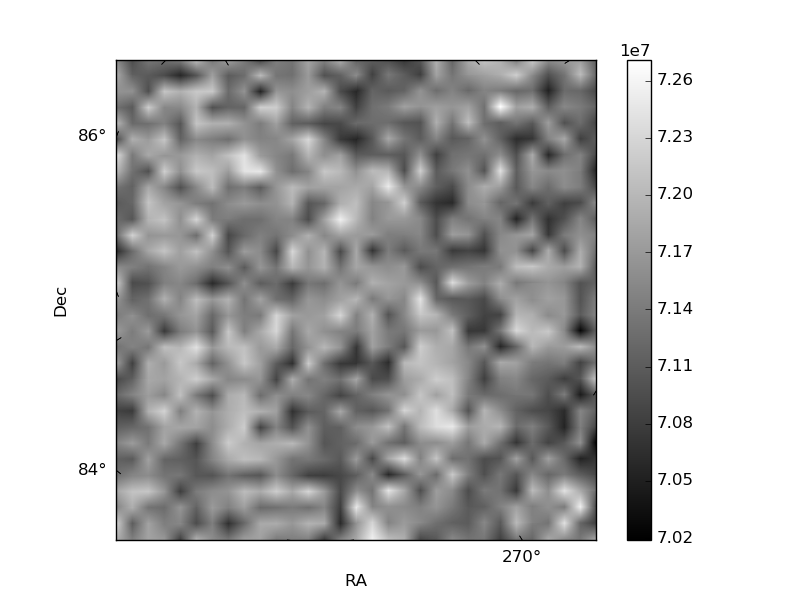
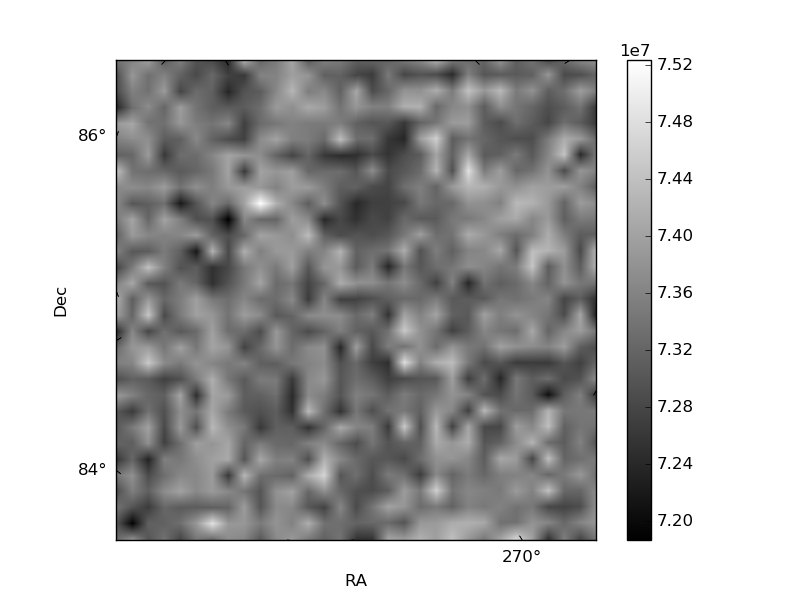
Histogram calculated using DETX and DETY for each event in the final _common_clean file
| Quadrant A |  |
 |
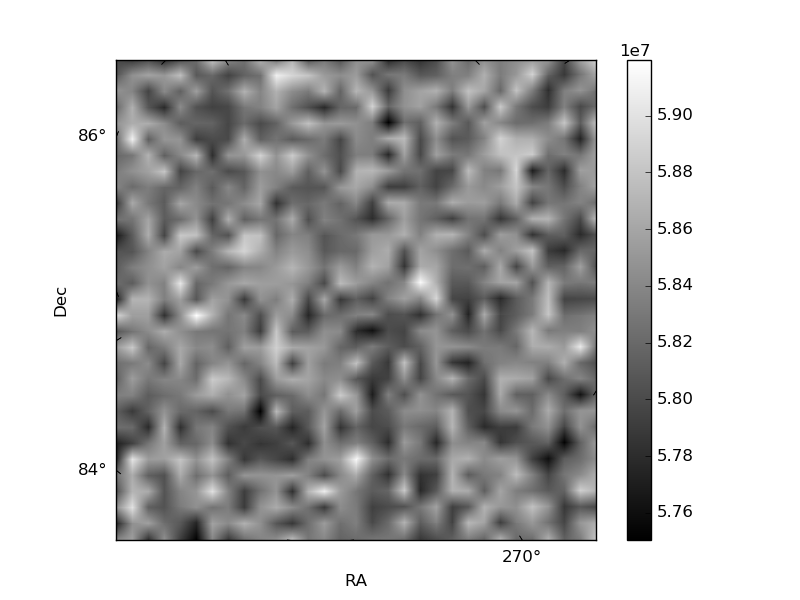
Quadrant B |
|---|---|---|---|
| Quadrant D |  |
 |
Quadrant C |
| Plot type | Count rate plots | Images |
|---|---|---|
| Comparison with Poisson distribution Blue bars denote a histogram of data divided into 1 sec bins. Red curve is a Poisson curve with rate = median count rate of data. |
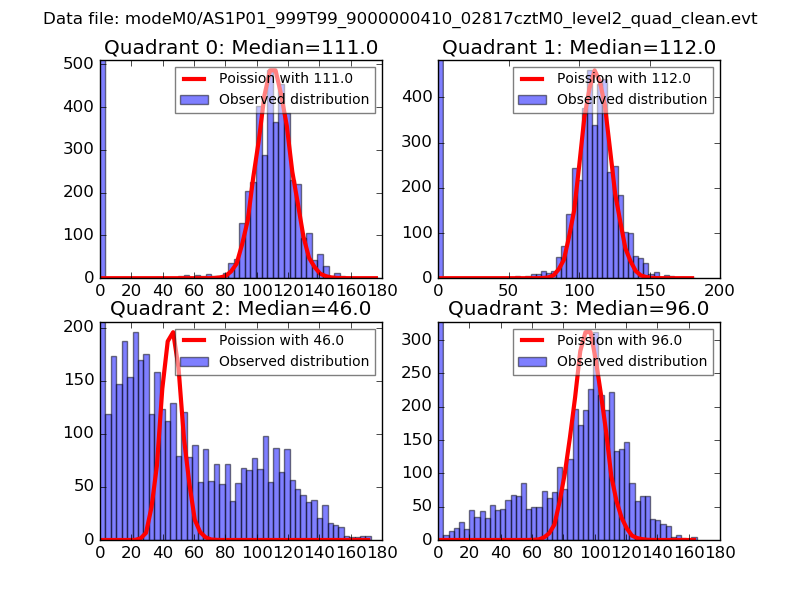 |
 |
| Quadrant-wise count rates Data is divided into 100 sec bins |
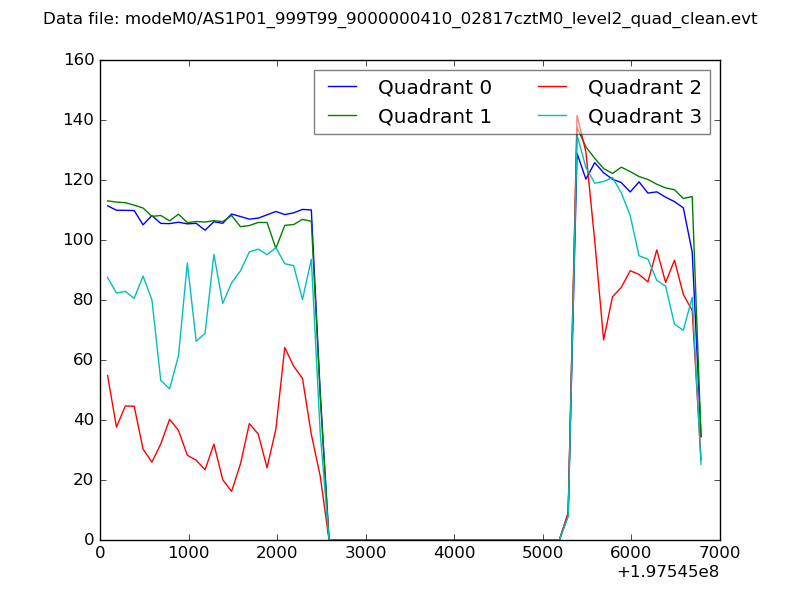 |
|
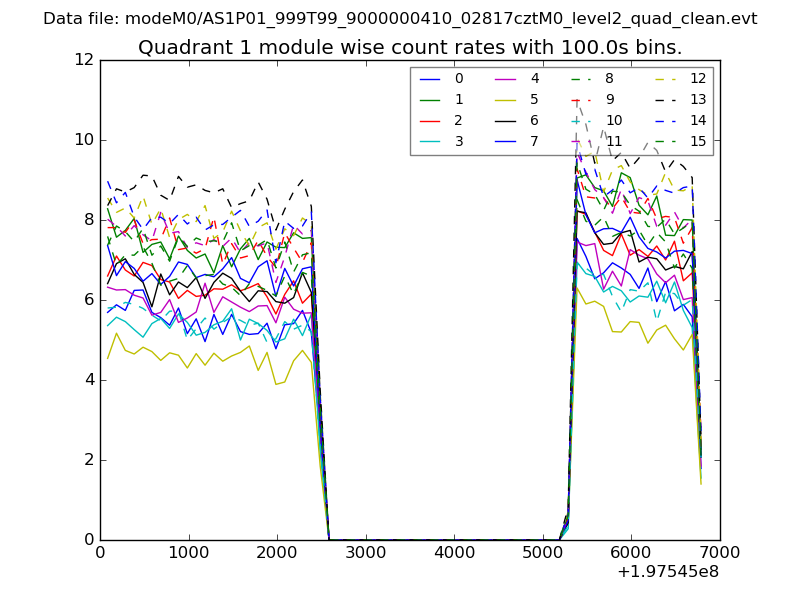
| Module-wise count rates for Quadrant A Data is divided into 100 sec bins |
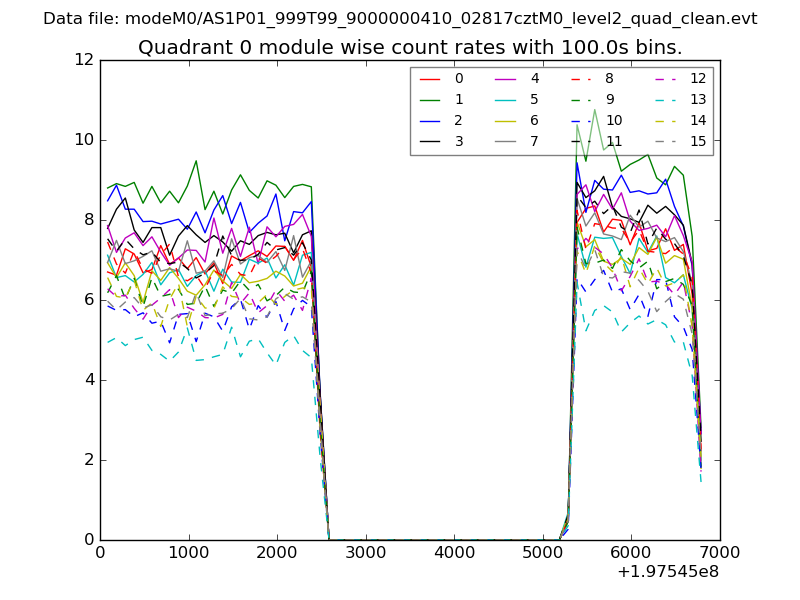 |
 |
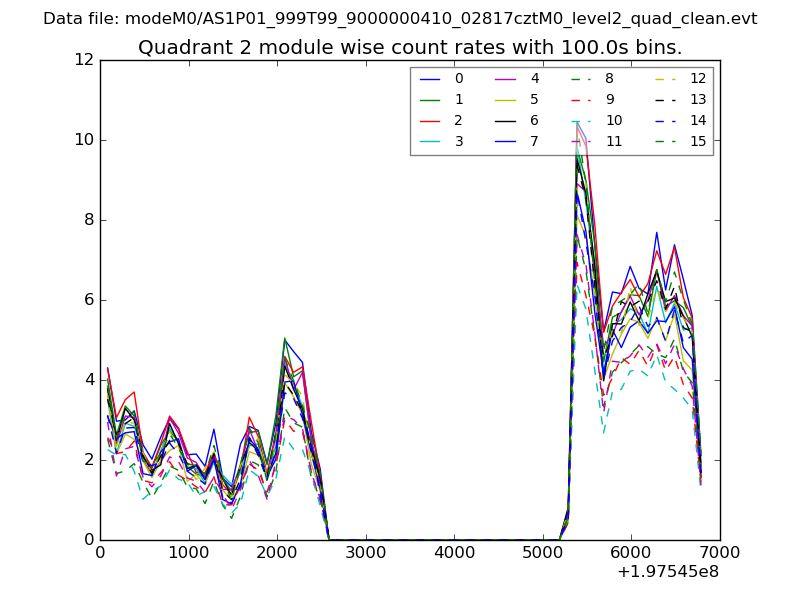
| Module-wise count rates for Quadrant B Data is divided into 100 sec bins |
 |
 |
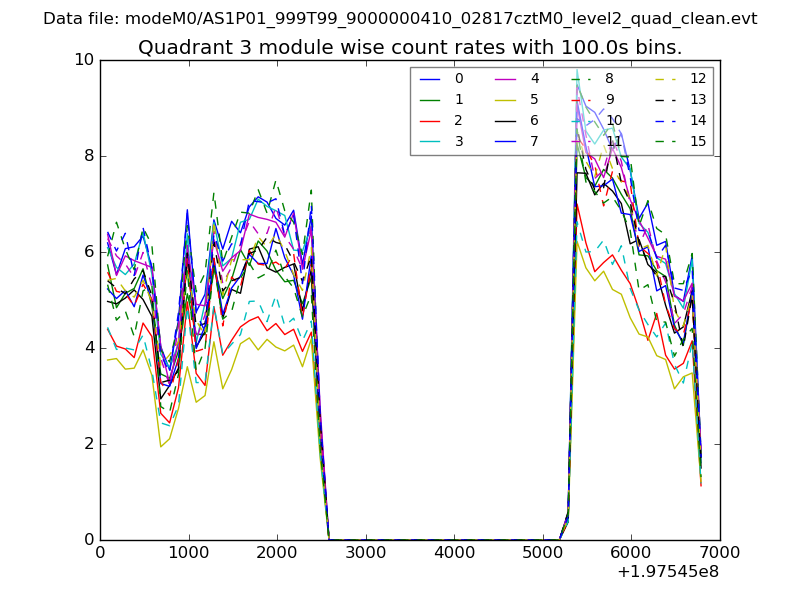
| Module-wise count rates for Quadrant C Data is divided into 100 sec bins |
 |
 |
| Module-wise count rates for Quadrant D Data is divided into 100 sec bins |
 |
 |
| Parameter | Plot |
|---|---|
| CZT HV Monitor | 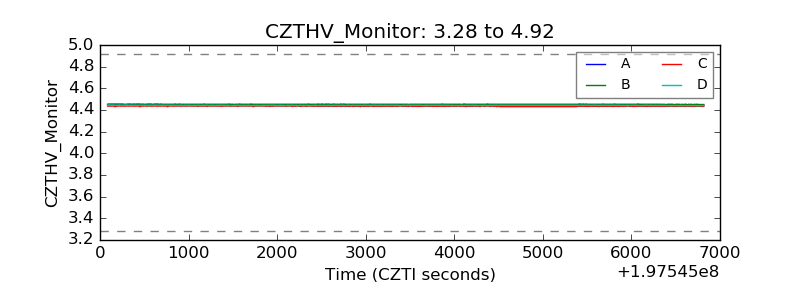 |
| D_VDD | 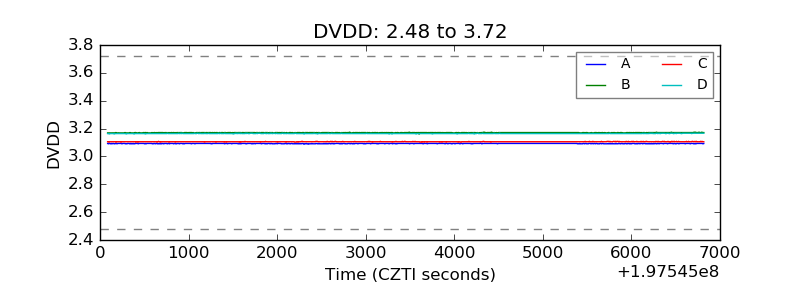 |
| Temperature 1 | 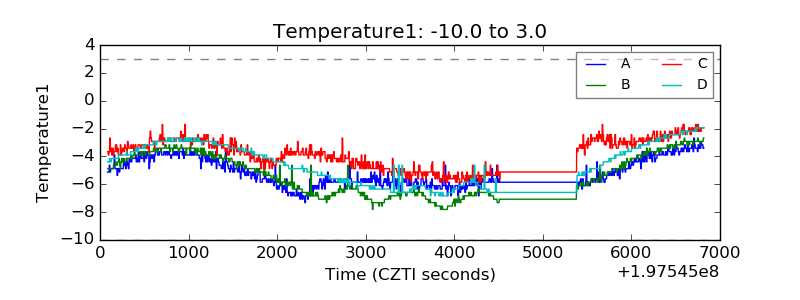 |
| Veto HV Monitor |  |
| Veto LLD | 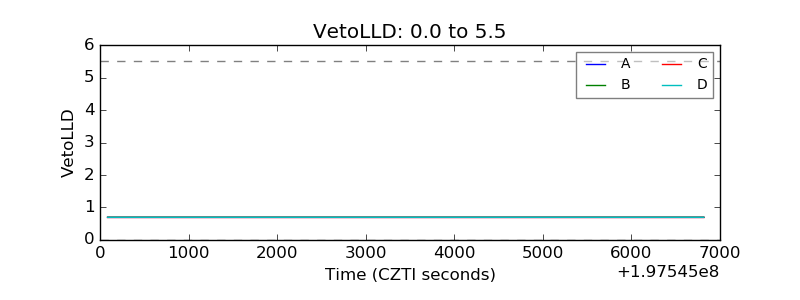 |
| Alpha Counter | 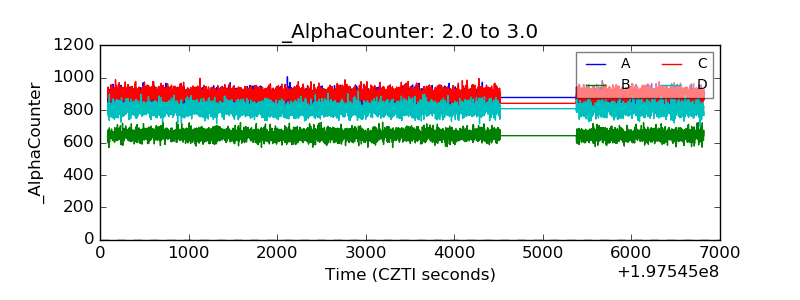 |
| _CPM_Rate | 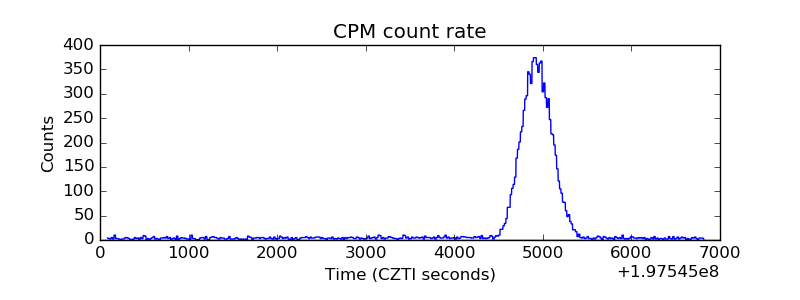 |
| CZT Counter |  |
| +2.5 Volts monitor |  |
| +5 Volts monitor |  |
| Veto Counter | 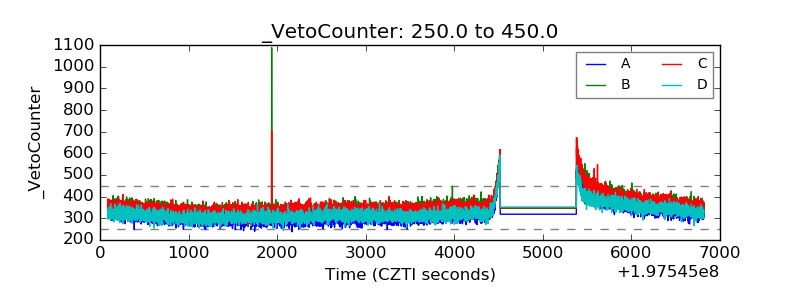 |