| Param | Original file | Final file |
|---|---|---|
| Filename | modeM0/AS1P01_999T99_9000000410_02818cztM0_level2.evt | modeM0/AS1P01_999T99_9000000410_02818cztM0_level2_quad_clean.evt |
| Size (bytes) | 1,796,143,680 | 65,295,360 |
| Size | 1.7 GB | 62.3 MB |
| Events in quadrant A | 9,156,778 | 471,711 |
| Events in quadrant B | 11,743,162 | 441,582 |
| Events in quadrant C | 15,681,677 | 334,265 |
| Events in quadrant D | 17,402,916 | 284,912 |
| Mode SS | |||
|---|---|---|---|
| Quadrant | BADHDUFLAG | Total packets | Discarded packets |
| A | 0 | 130 | 0 |
| B | 0 | 130 | 0 |
| C | 0 | 130 | 0 |
| D | 0 | 130 | 0 |
| Mode M9 | |||
|---|---|---|---|
| Quadrant | BADHDUFLAG | Total packets | Discarded packets |
| A | 0 | 10 | 0 |
| B | 0 | 10 | 0 |
| C | 0 | 10 | 0 |
| D | 0 | 10 | 0 |
| Mode M0 | |||
|---|---|---|---|
| Quadrant | BADHDUFLAG | Total packets | Discarded packets |
| A | 0 | 31669 | 2 |
| B | 0 | 39372 | 1 |
| C | 0 | 51469 | 1 |
| D | 0 | 56782 | 1 |
| Quadrant | Total seconds | Saturated seconds | Saturation percentage |
|---|---|---|---|
| A | 6324 | 100 | 1.581278% |
| B | 6324 | 661 | 10.452245% |
| C | 6324 | 2974 | 47.027198% |
| D | 6324 | 4070 | 64.358001% |
Noise dominated data is calculated using 1-second bins in cleaned event files. If a bin has >2000 counts, and if more than 50% of those come from <1% of pixels, then it is considered to be noise-dominated and hence unusable.
| Quadrant | # 1 sec bins | Bins with >0 counts | Bins with >2000 counts | High rate bins dominated by noise | Noise dominated (total time) | Noise dominated (detector-on time) | Marked lightcurve |
|---|---|---|---|---|---|---|---|
| A | 7344 | 6325 | 588 | 588 | 8.01% | 9.30% | 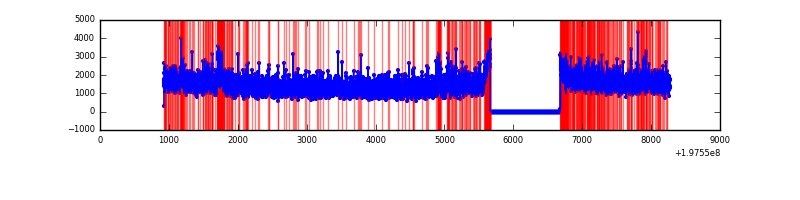 |
| B | 7344 | 6325 | 1943 | 1943 | 26.46% | 30.72% | 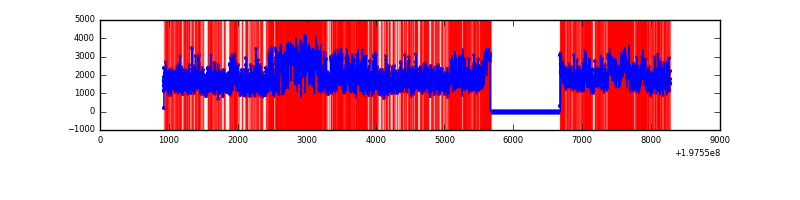 |
| C | 7344 | 6325 | 4272 | 4272 | 58.17% | 67.54% | 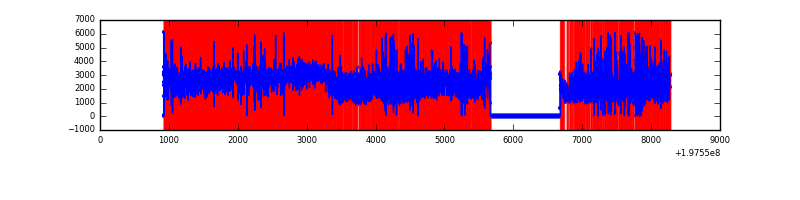 |
| D | 7344 | 6325 | 5426 | 5426 | 73.88% | 85.79% | 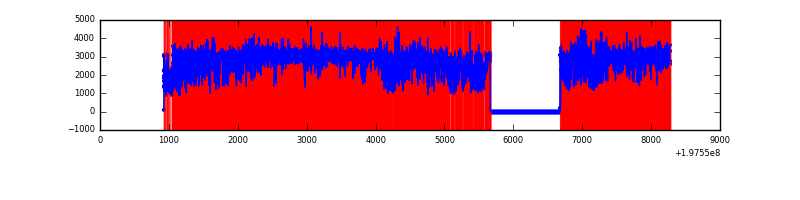 |
Top three noisy pixels from each quadrant. If the there are fewer than three noisy pixels in the level2.evt file, extra rows are filled as -1
| Pixel properties | Quadrant properties | ||||||
|---|---|---|---|---|---|---|---|
| Quadrant | DetID | PixID | Counts | Sigma | Mean | Median | Sigma |
| A | 0 | 31 | 177790 | 332.67 | 2280 | 2258 | 527.6 |
| A | 0 | 50 | 54494 | 99.0 | 2280 | 2258 | 527.6 |
| A | 0 | 117 | 51290 | 92.93 | 2280 | 2258 | 527.6 |
| B | 3 | 10 | 1810735 | 3475.91 | 2235 | 2216 | 520.3 |
| B | 3 | 11 | 575707 | 1102.23 | 2235 | 2216 | 520.3 |
| B | 3 | 12 | 301077 | 574.4 | 2235 | 2216 | 520.3 |
| C | 0 | 219 | 3016865 | 6152.35 | 1681 | 1736 | 490.1 |
| C | 1 | 16 | 2718245 | 5543.02 | 1681 | 1736 | 490.1 |
| C | 1 | 192 | 1888106 | 3849.12 | 1681 | 1736 | 490.1 |
| D | 0 | 226 | 5823556 | 12229.0 | 1561 | 1582 | 476.1 |
| D | 1 | 7 | 3501651 | 7351.86 | 1561 | 1582 | 476.1 |
| D | 1 | 31 | 813786 | 1706.03 | 1561 | 1582 | 476.1 |
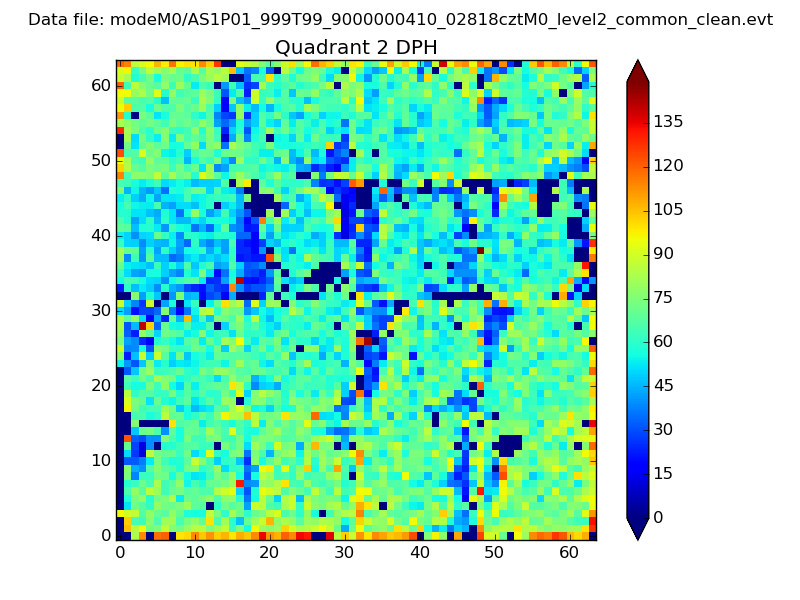
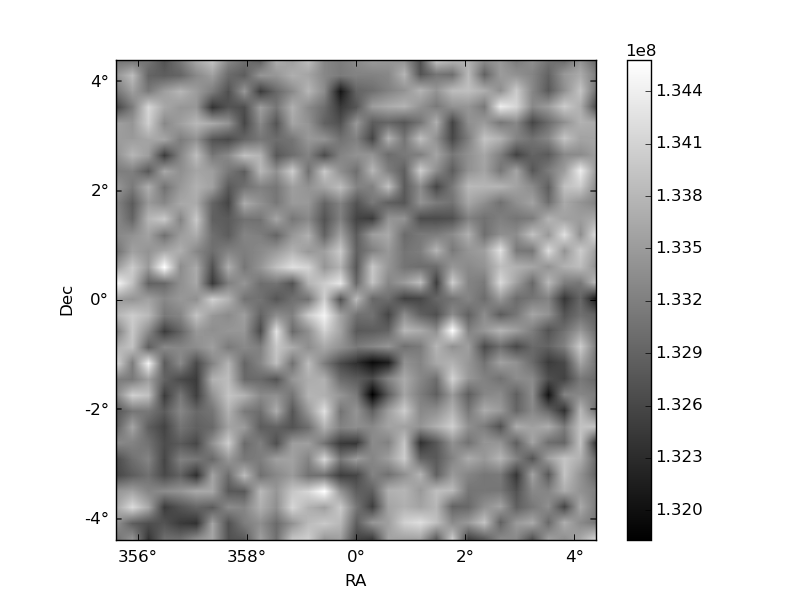
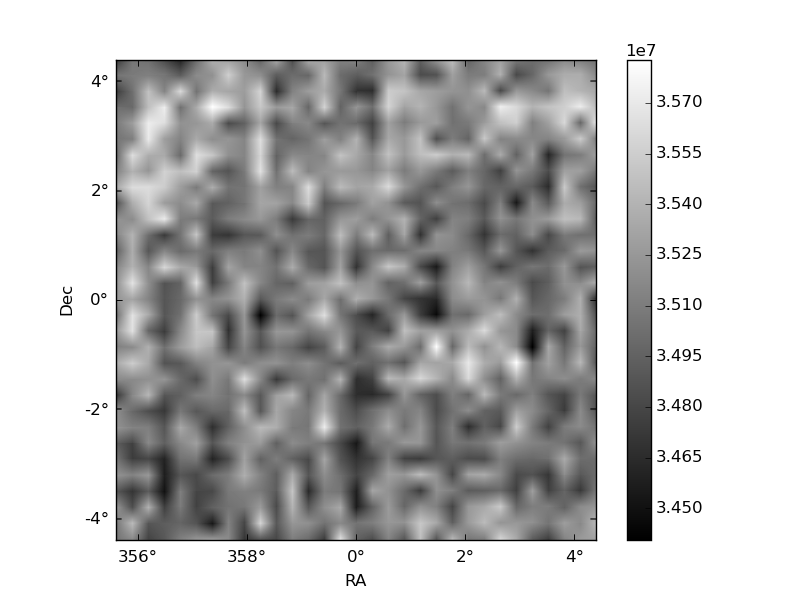
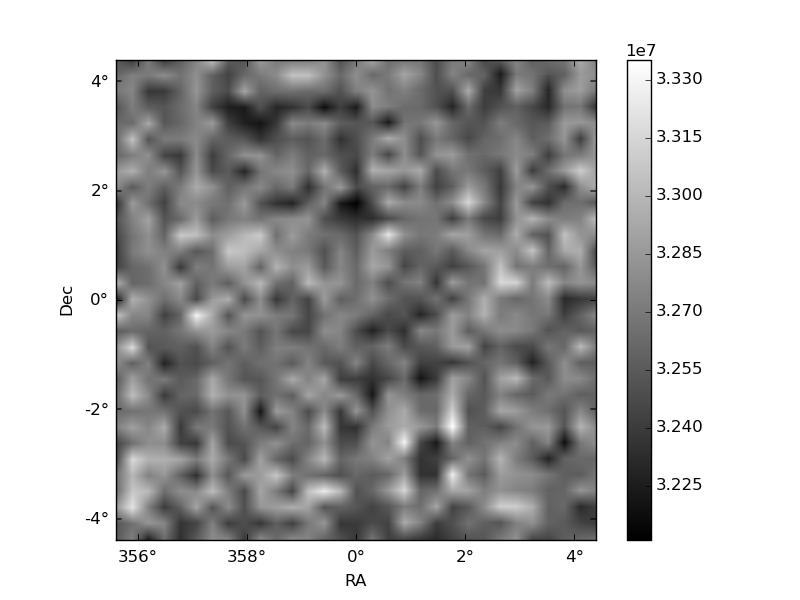
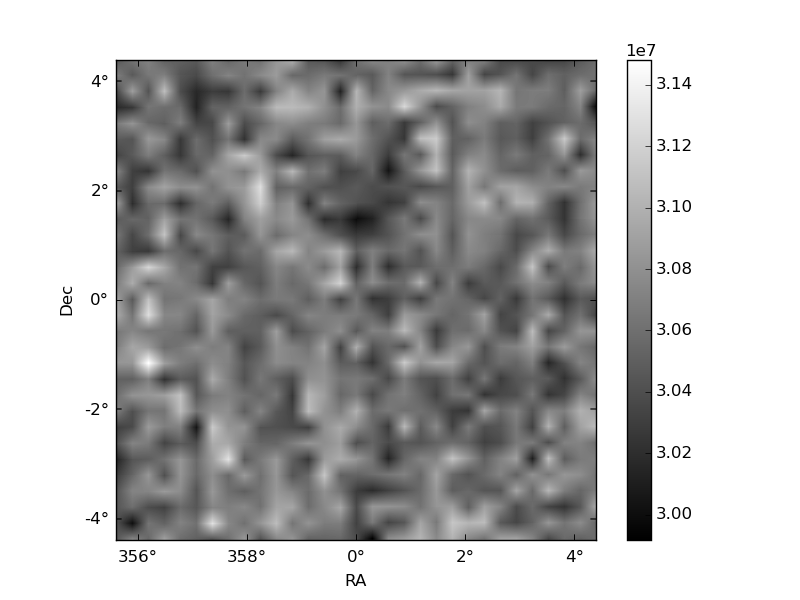
Histogram calculated using DETX and DETY for each event in the final _common_clean file
| Quadrant A | 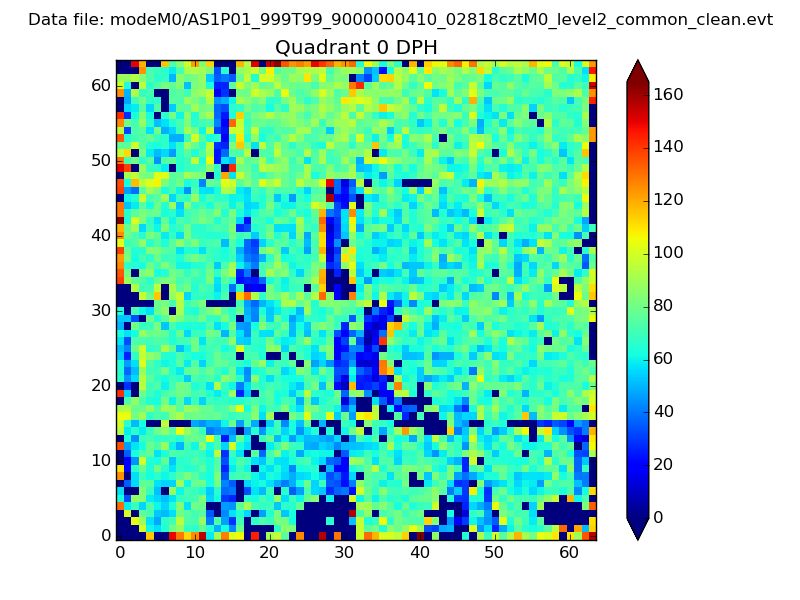 |
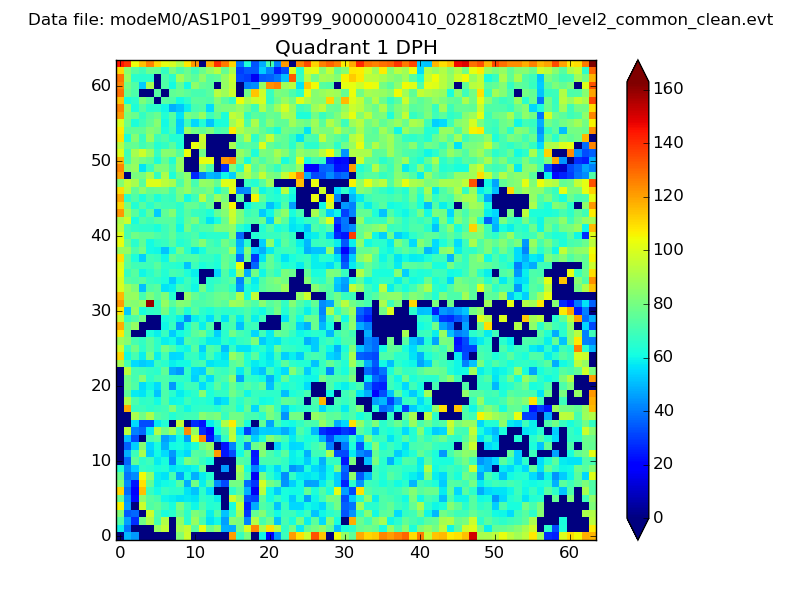 |
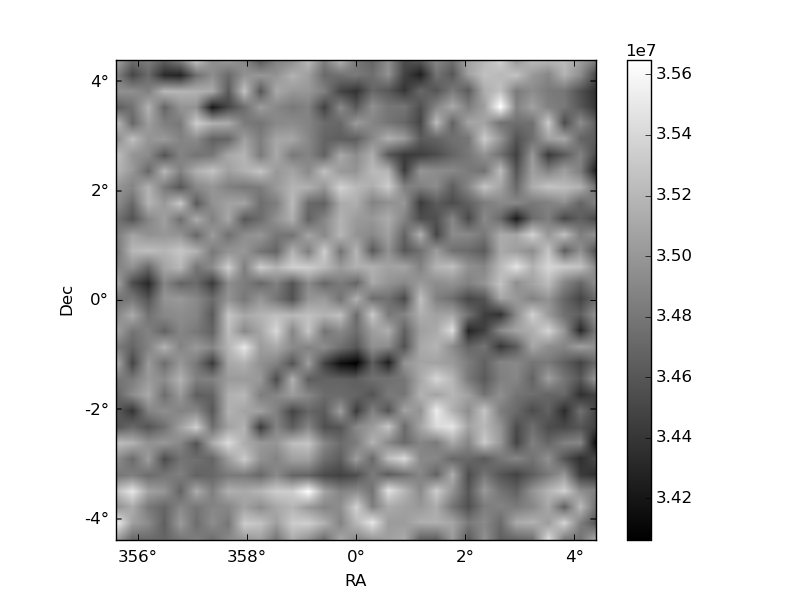
Quadrant B |
|---|---|---|---|
| Quadrant D | 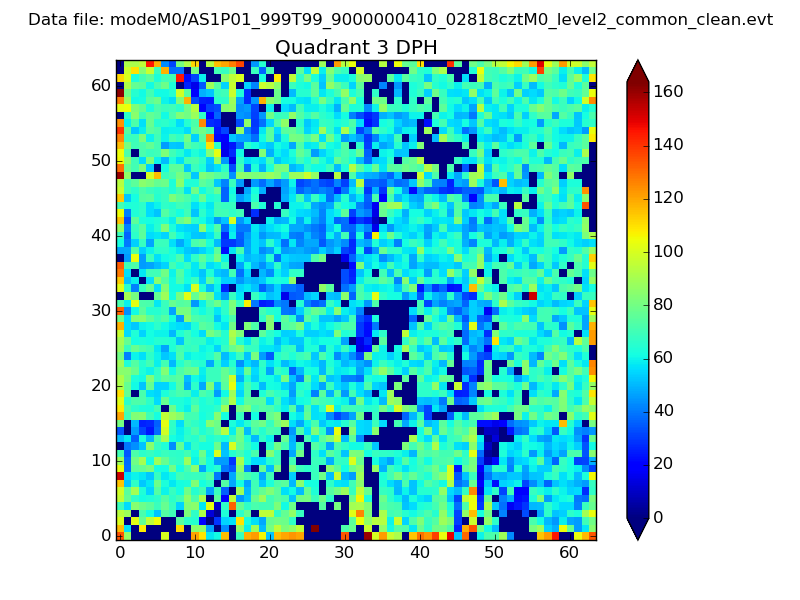 |
 |
Quadrant C |
| Plot type | Count rate plots | Images |
|---|---|---|
| Comparison with Poisson distribution Blue bars denote a histogram of data divided into 1 sec bins. Red curve is a Poisson curve with rate = median count rate of data. |
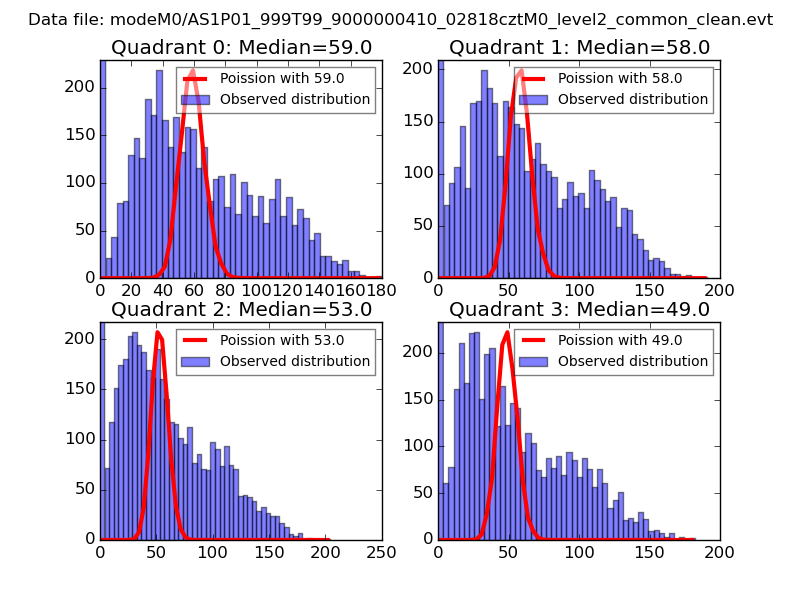 |
 |
| Quadrant-wise count rates Data is divided into 100 sec bins |
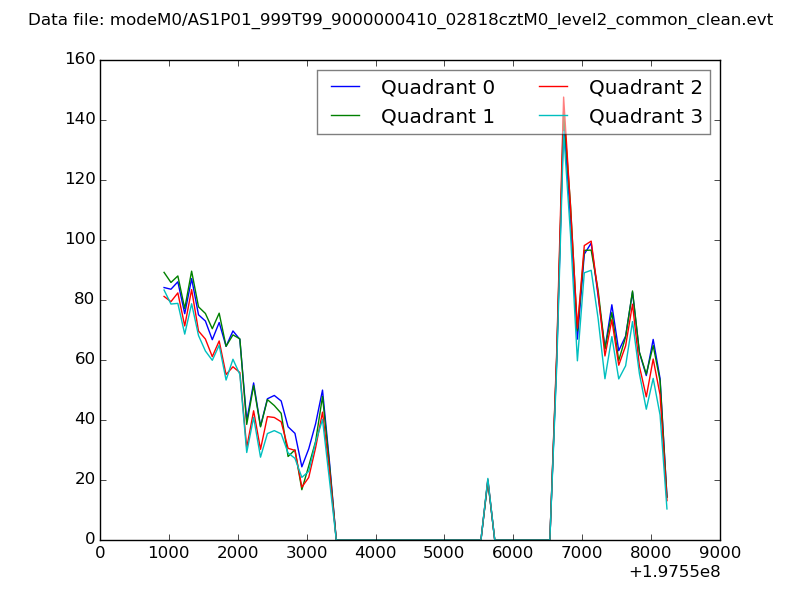 |
|
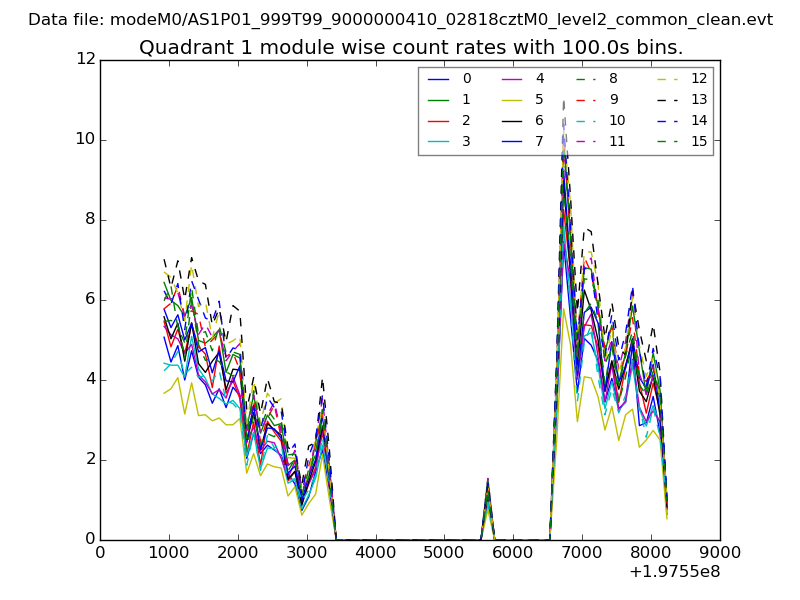
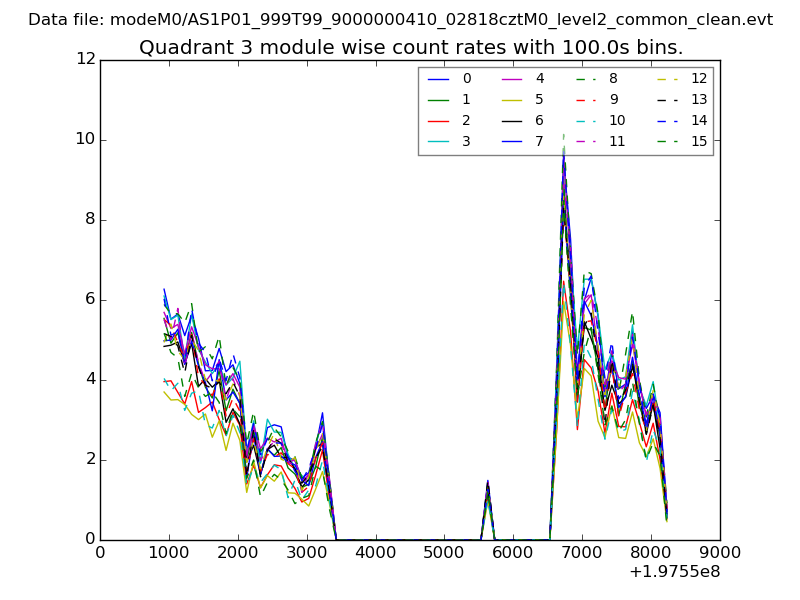
| Module-wise count rates for Quadrant A Data is divided into 100 sec bins |
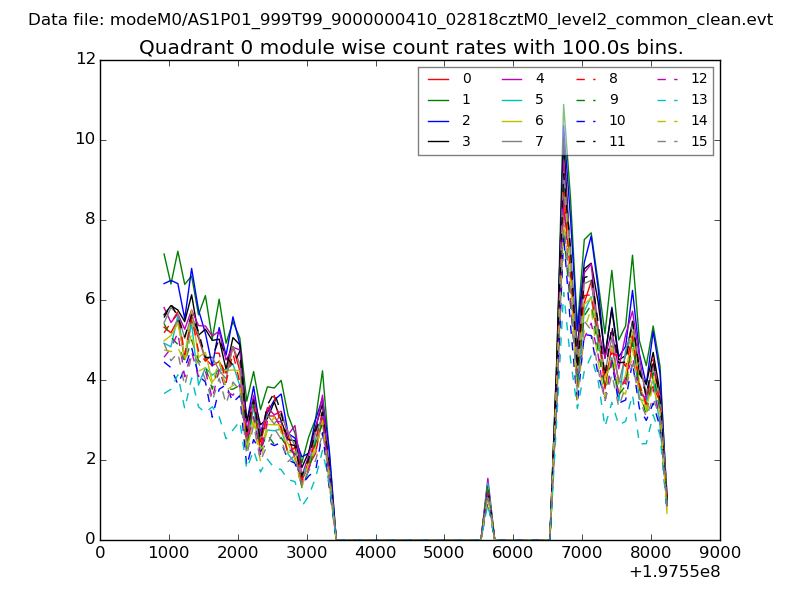 |
 |
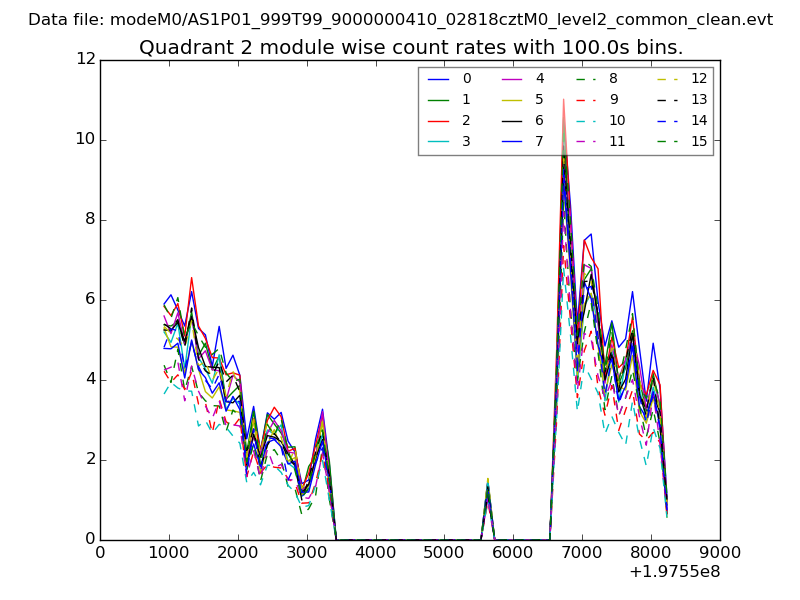
| Module-wise count rates for Quadrant B Data is divided into 100 sec bins |
 |
 |
| Module-wise count rates for Quadrant C Data is divided into 100 sec bins |
 |
 |
| Module-wise count rates for Quadrant D Data is divided into 100 sec bins |
 |
 |
| Parameter | Plot |
|---|---|
| CZT HV Monitor | 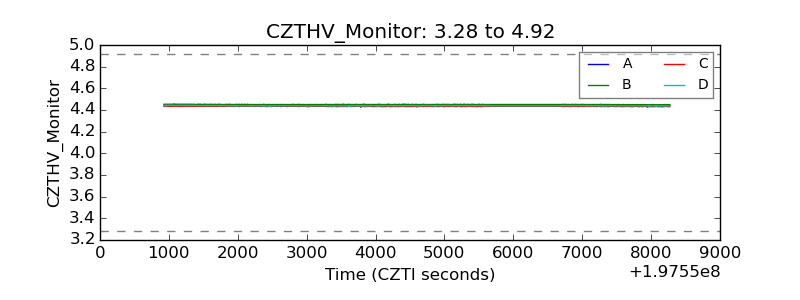 |
| D_VDD | 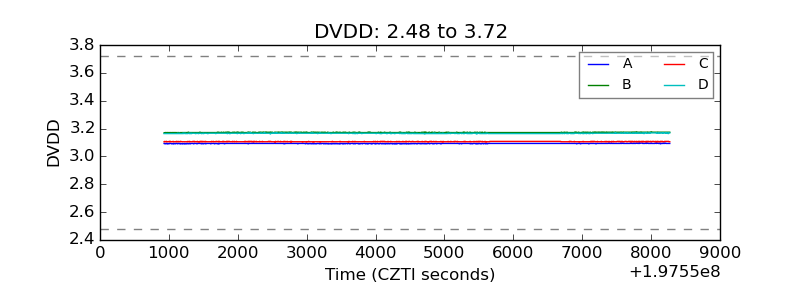 |
| Temperature 1 | 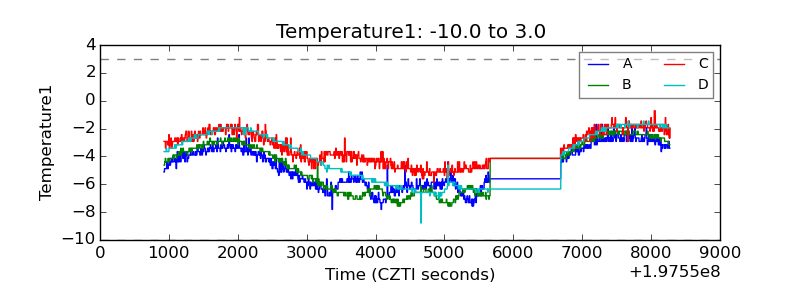 |
| Veto HV Monitor | 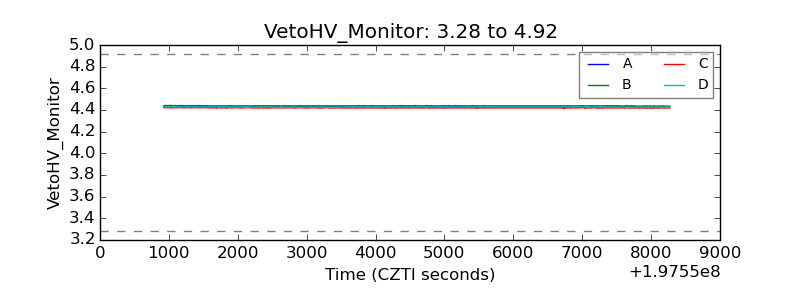 |
| Veto LLD | 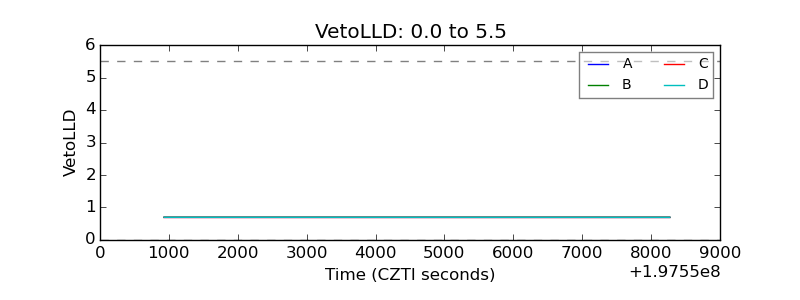 |
| Alpha Counter | 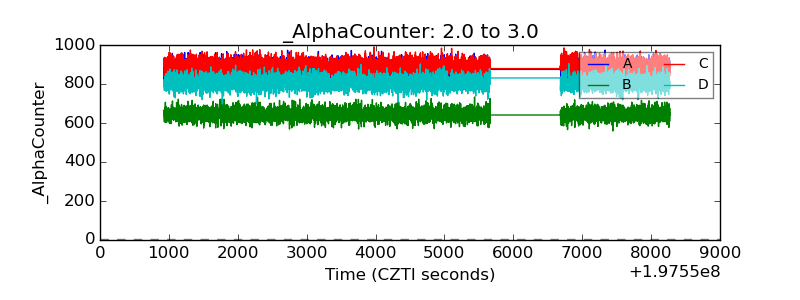 |
| _CPM_Rate | 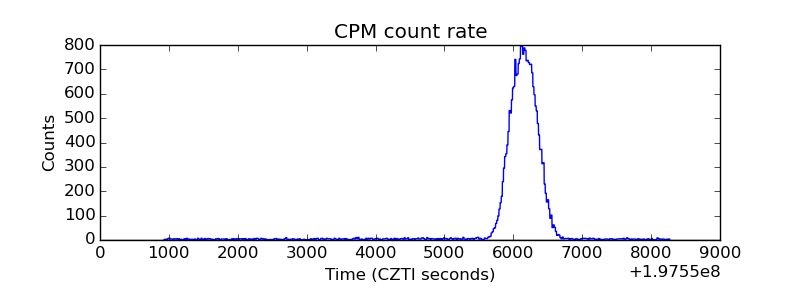 |
| CZT Counter | 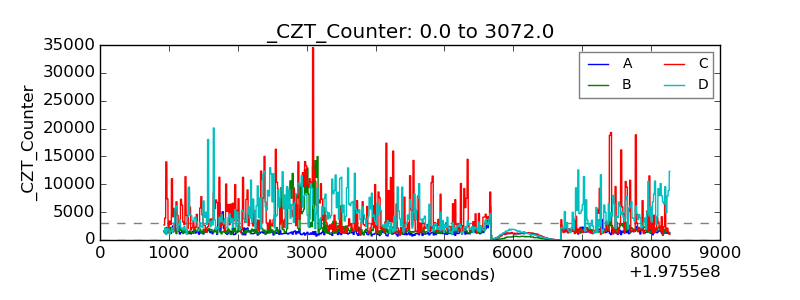 |
| +2.5 Volts monitor |  |
| +5 Volts monitor | 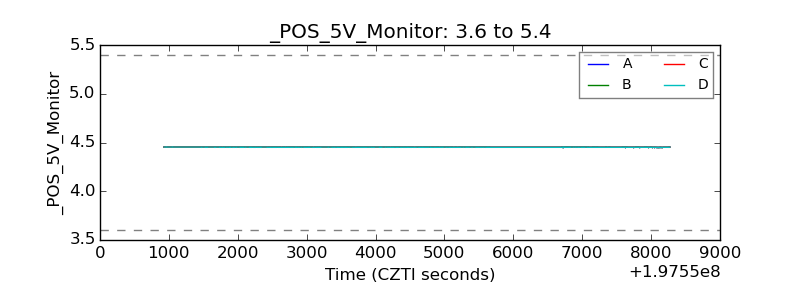 |
| Veto Counter | 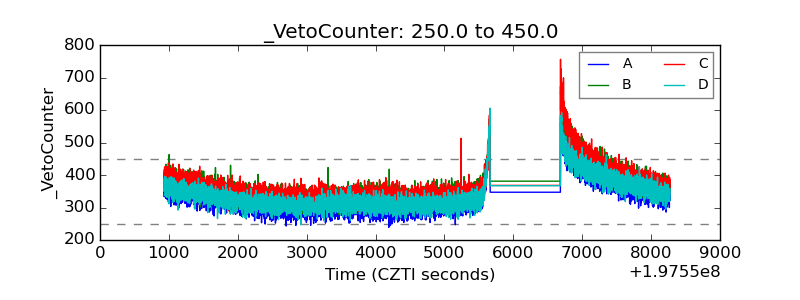 |