| Param | Original file | Final file |
|---|---|---|
| Filename | modeM0/AS1P01_999T99_9000000410_02820cztM0_level2.evt | modeM0/AS1P01_999T99_9000000410_02820cztM0_level2_quad_clean.evt |
| Size (bytes) | 1,686,142,080 | 61,090,560 |
| Size | 1.6 GB | 58.3 MB |
| Events in quadrant A | 8,926,688 | 438,897 |
| Events in quadrant B | 10,812,214 | 438,481 |
| Events in quadrant C | 13,993,596 | 338,388 |
| Events in quadrant D | 16,951,975 | 222,931 |
| Mode SS | |||
|---|---|---|---|
| Quadrant | BADHDUFLAG | Total packets | Discarded packets |
| A | 0 | 118 | 0 |
| B | 0 | 118 | 0 |
| C | 0 | 118 | 0 |
| D | 0 | 118 | 0 |
| Mode M9 | |||
|---|---|---|---|
| Quadrant | BADHDUFLAG | Total packets | Discarded packets |
| A | 0 | 12 | 0 |
| B | 0 | 12 | 0 |
| C | 0 | 12 | 0 |
| D | 0 | 12 | 0 |
| Mode M0 | |||
|---|---|---|---|
| Quadrant | BADHDUFLAG | Total packets | Discarded packets |
| A | 0 | 30614 | 2 |
| B | 0 | 36195 | 1 |
| C | 0 | 46061 | 1 |
| D | 0 | 55241 | 1 |
| Quadrant | Total seconds | Saturated seconds | Saturation percentage |
|---|---|---|---|
| A | 5850 | 80 | 1.367521% |
| B | 5850 | 201 | 3.435897% |
| C | 5850 | 2480 | 42.393162% |
| D | 5850 | 4532 | 77.470085% |
Noise dominated data is calculated using 1-second bins in cleaned event files. If a bin has >2000 counts, and if more than 50% of those come from <1% of pixels, then it is considered to be noise-dominated and hence unusable.
| Quadrant | # 1 sec bins | Bins with >0 counts | Bins with >2000 counts | High rate bins dominated by noise | Noise dominated (total time) | Noise dominated (detector-on time) | Marked lightcurve |
|---|---|---|---|---|---|---|---|
| A | 7000 | 5851 | 661 | 661 | 9.44% | 11.30% | 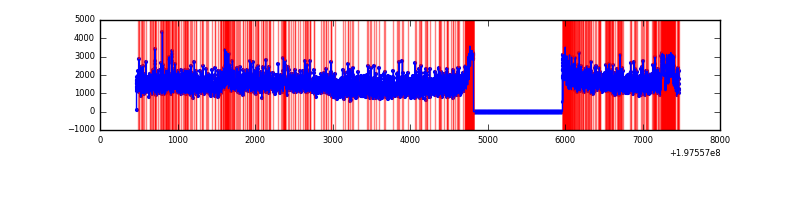 |
| B | 7000 | 5851 | 1891 | 1891 | 27.01% | 32.32% | 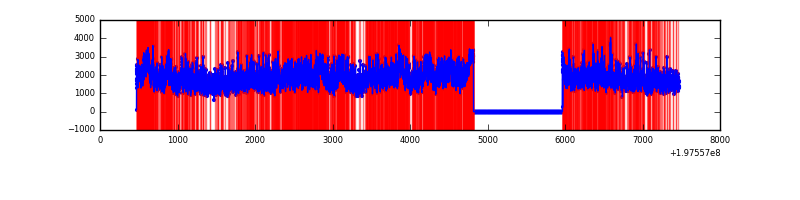 |
| C | 7000 | 5850 | 3561 | 3561 | 50.87% | 60.87% | 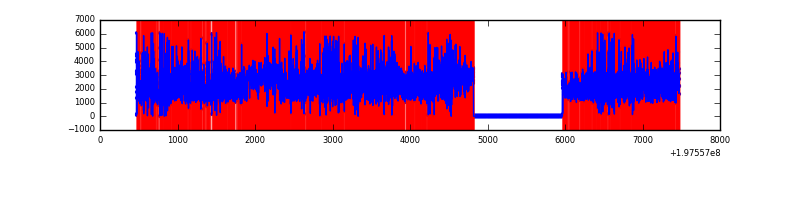 |
| D | 7000 | 5851 | 5459 | 5459 | 77.99% | 93.30% | 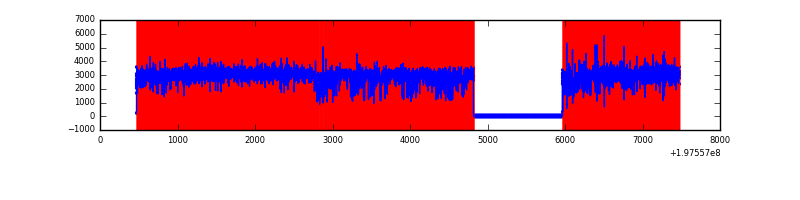 |
Top three noisy pixels from each quadrant. If the there are fewer than three noisy pixels in the level2.evt file, extra rows are filled as -1
| Pixel properties | Quadrant properties | ||||||
|---|---|---|---|---|---|---|---|
| Quadrant | DetID | PixID | Counts | Sigma | Mean | Median | Sigma |
| A | 0 | 31 | 614371 | 1282.04 | 2068 | 2047 | 477.6 |
| A | 0 | 50 | 205794 | 426.59 | 2068 | 2047 | 477.6 |
| A | 0 | 117 | 37390 | 74.0 | 2068 | 2047 | 477.6 |
| B | 3 | 10 | 863468 | 1756.77 | 2108 | 2084 | 490.3 |
| B | 3 | 11 | 671929 | 1366.13 | 2108 | 2084 | 490.3 |
| B | 3 | 12 | 262050 | 530.19 | 2108 | 2084 | 490.3 |
| C | 0 | 219 | 4111426 | 8905.63 | 1587 | 1641 | 461.5 |
| C | 1 | 16 | 1315330 | 2846.68 | 1587 | 1641 | 461.5 |
| C | 1 | 192 | 1232313 | 2666.78 | 1587 | 1641 | 461.5 |
| D | 0 | 226 | 6501680 | 17140.67 | 1250 | 1265 | 379.2 |
| D | 1 | 7 | 3921374 | 10336.77 | 1250 | 1265 | 379.2 |
| D | 1 | 31 | 853829 | 2248.09 | 1250 | 1265 | 379.2 |
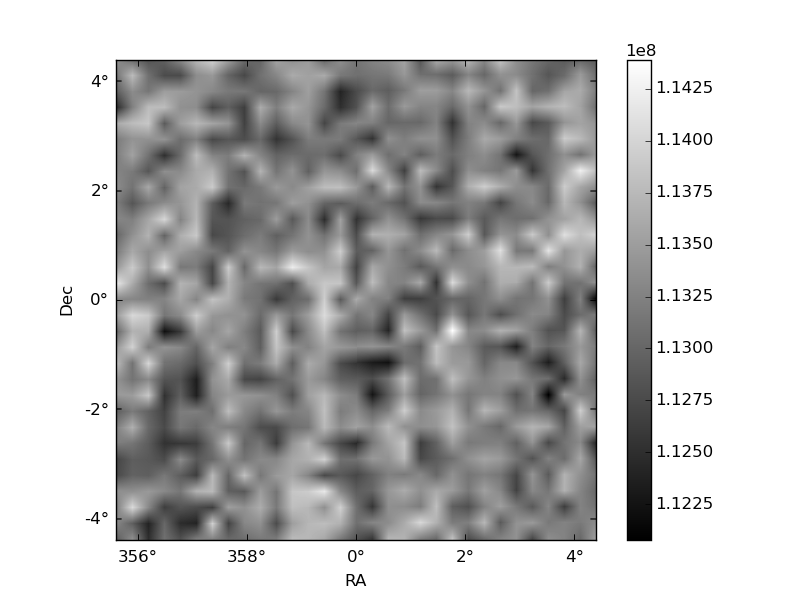
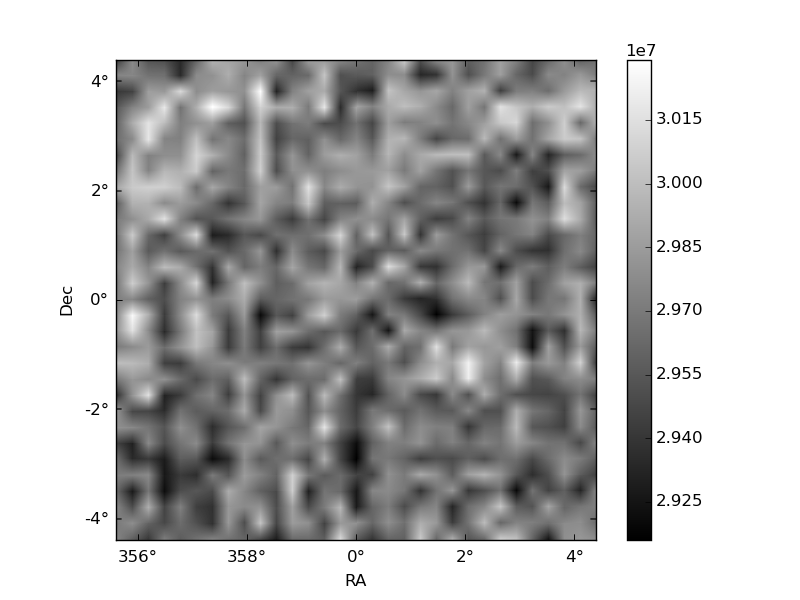
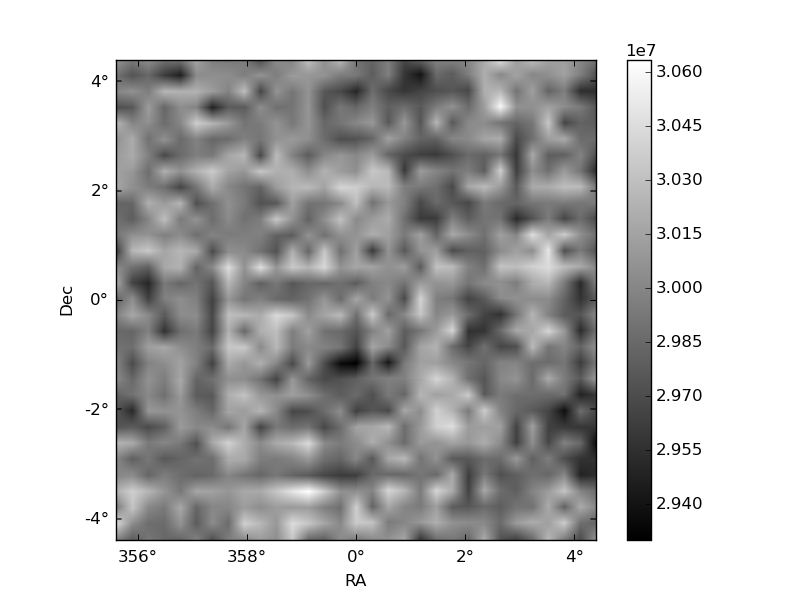
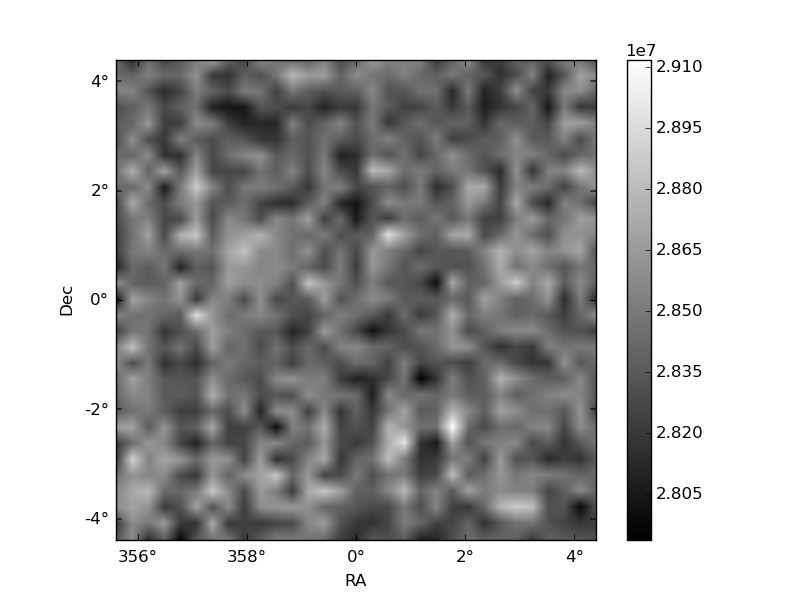
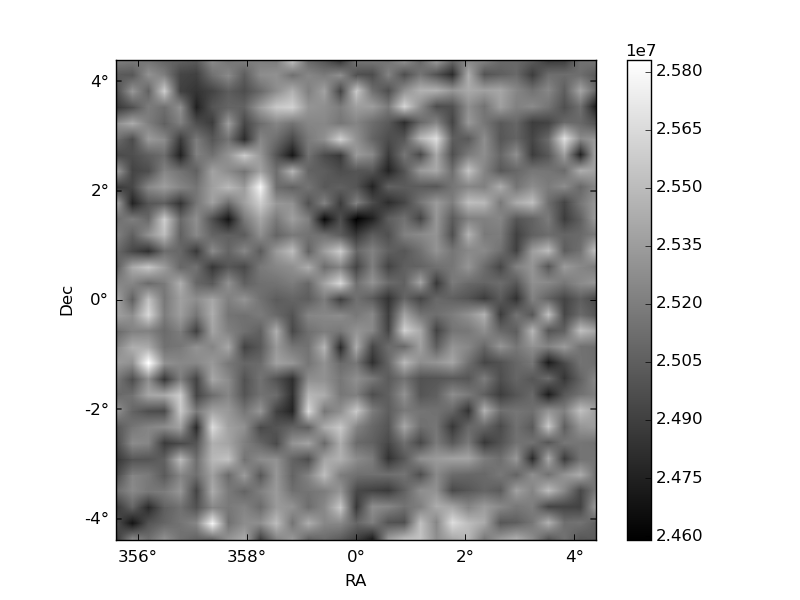
Histogram calculated using DETX and DETY for each event in the final _common_clean file
| Quadrant A | 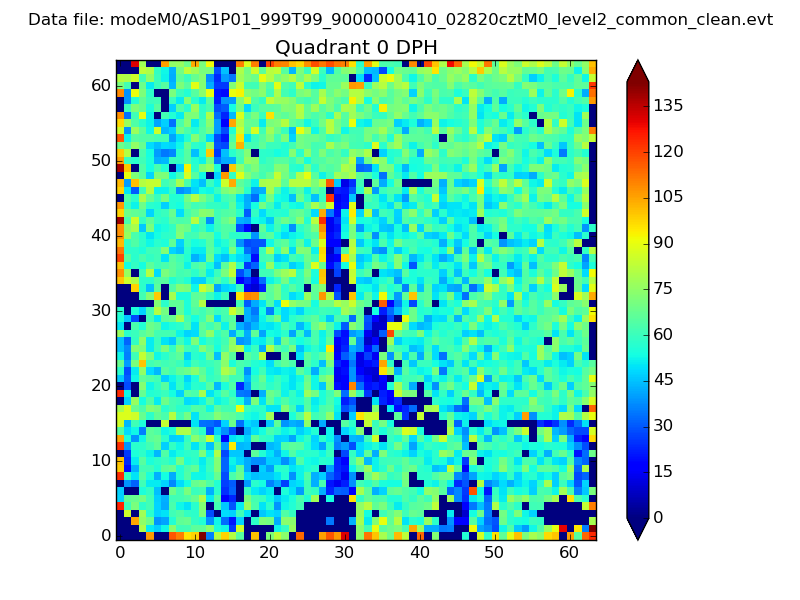 |
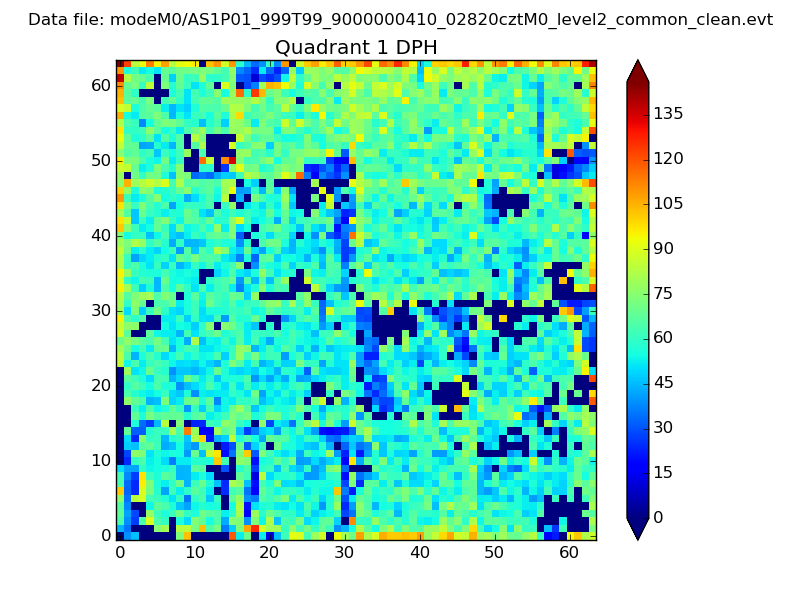 |
Quadrant B |
|---|---|---|---|
| Quadrant D | 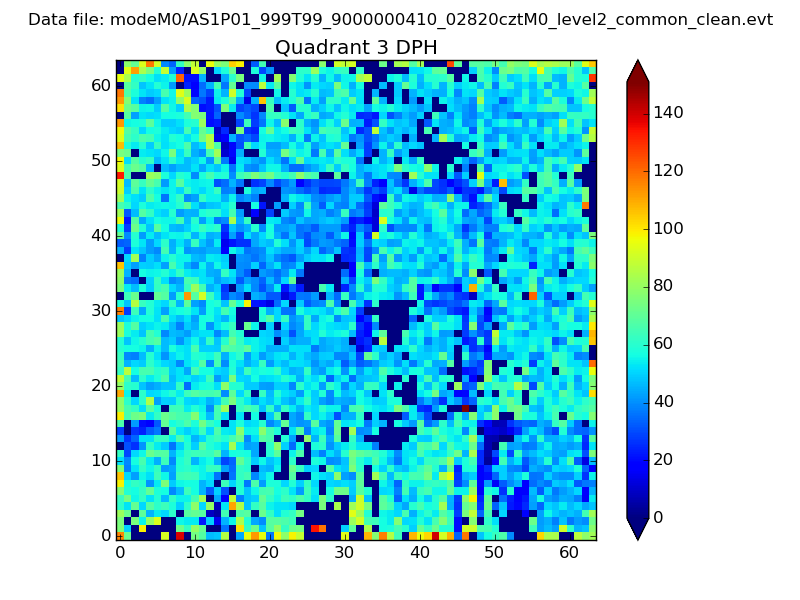 |
 |
Quadrant C |
| Plot type | Count rate plots | Images |
|---|---|---|
| Comparison with Poisson distribution Blue bars denote a histogram of data divided into 1 sec bins. Red curve is a Poisson curve with rate = median count rate of data. |
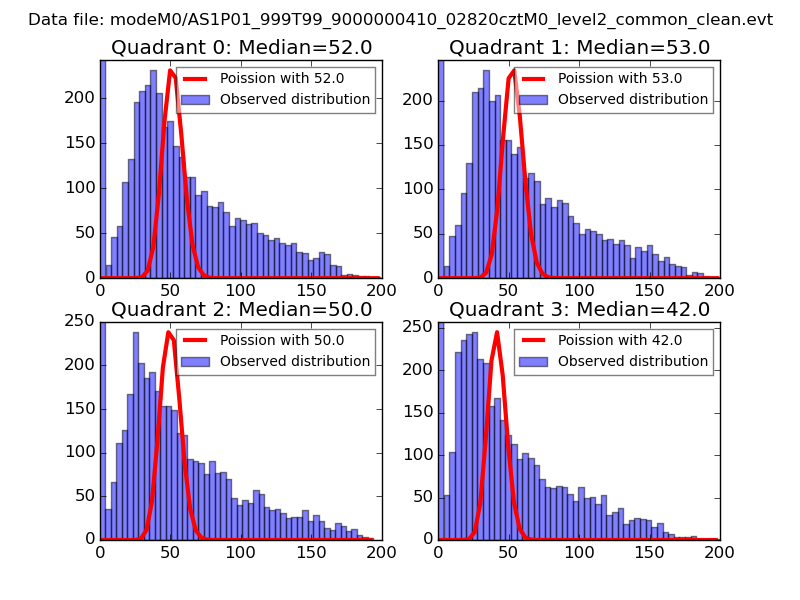 |
 |
| Quadrant-wise count rates Data is divided into 100 sec bins |
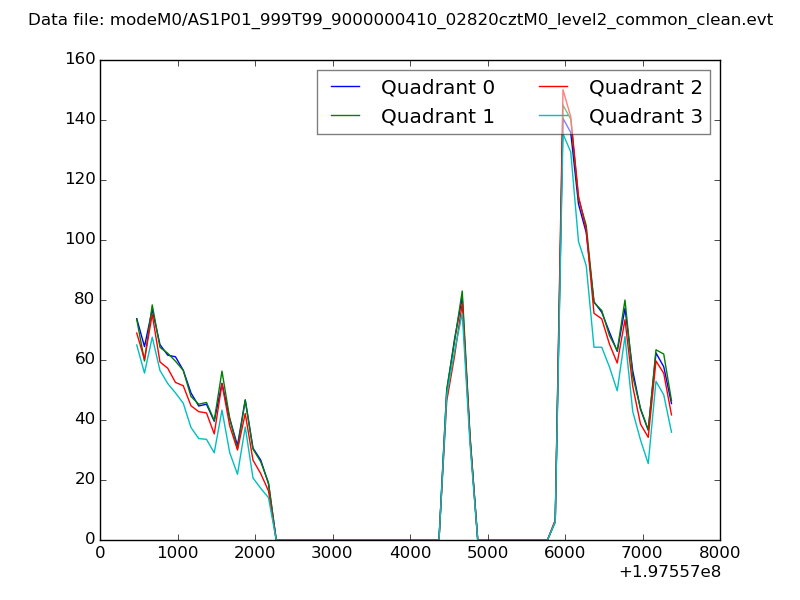 |
|
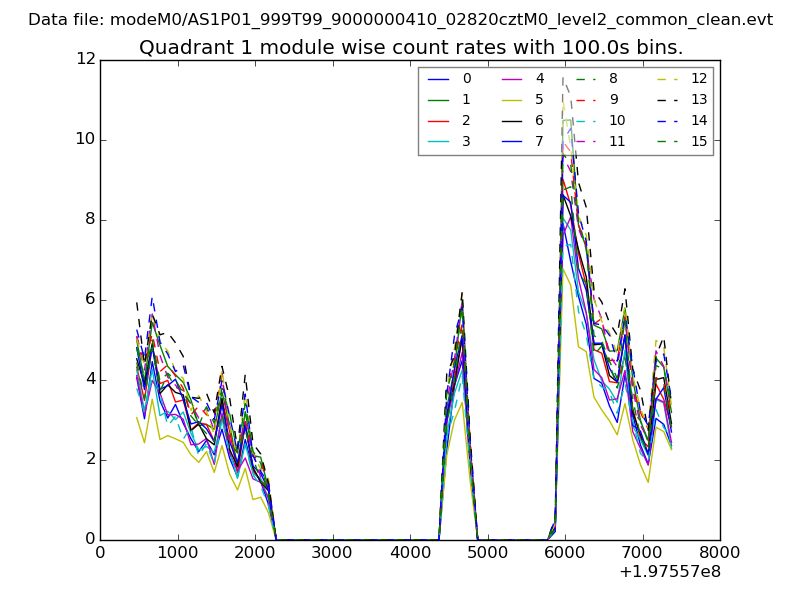
| Module-wise count rates for Quadrant A Data is divided into 100 sec bins |
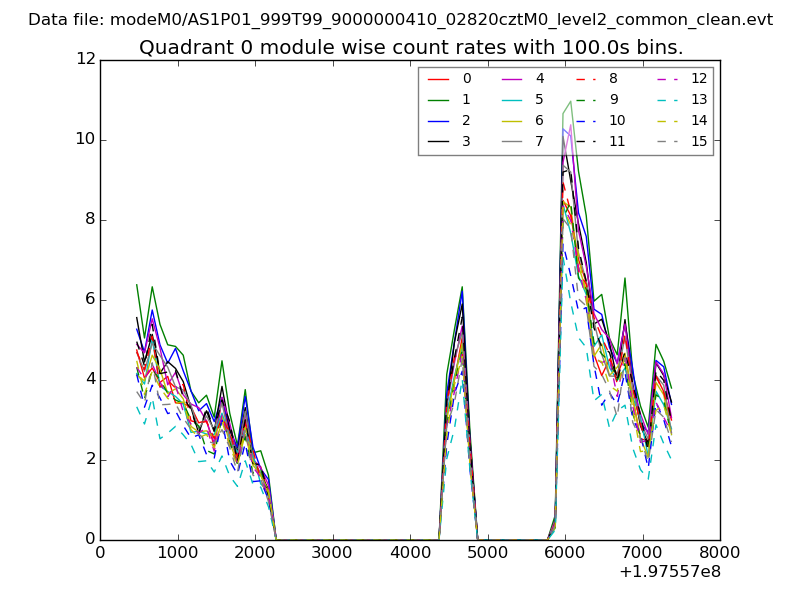 |
 |
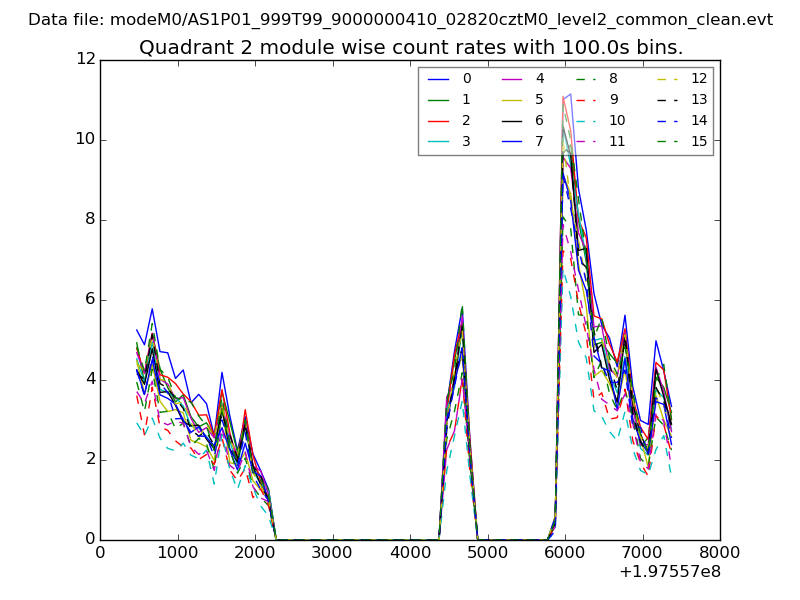
| Module-wise count rates for Quadrant B Data is divided into 100 sec bins |
 |
 |
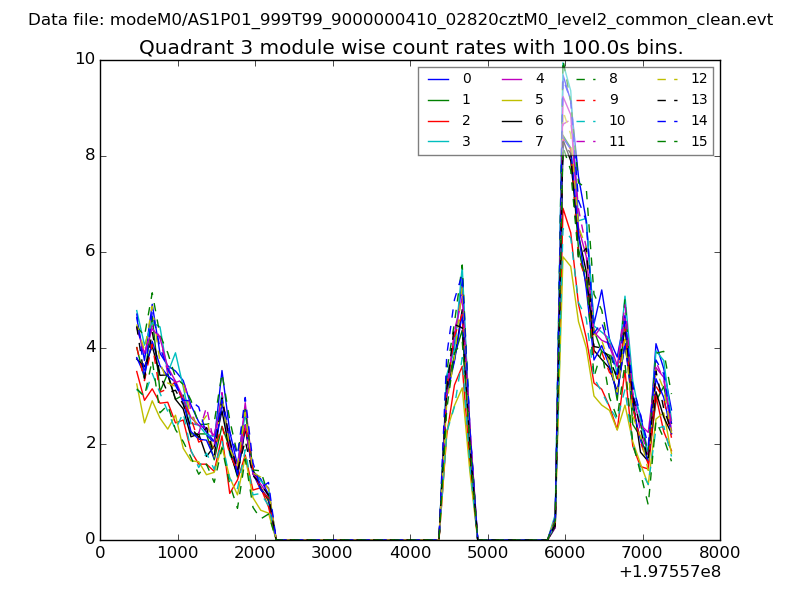
| Module-wise count rates for Quadrant C Data is divided into 100 sec bins |
 |
 |
| Module-wise count rates for Quadrant D Data is divided into 100 sec bins |
 |
 |
| Parameter | Plot |
|---|---|
| CZT HV Monitor | 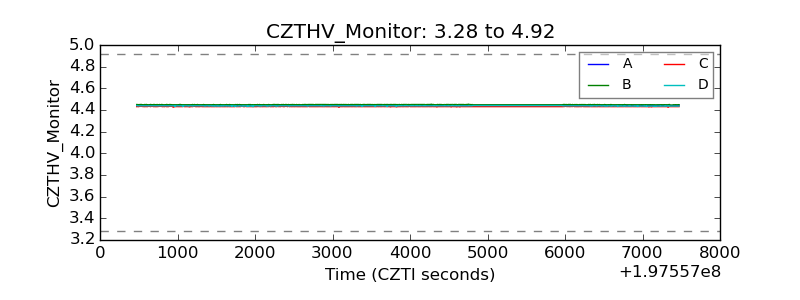 |
| D_VDD | 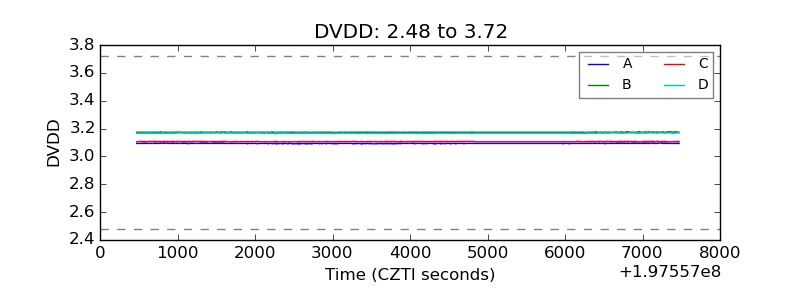 |
| Temperature 1 | 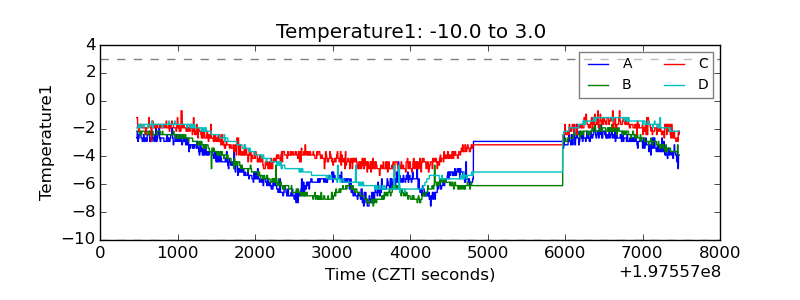 |
| Veto HV Monitor | 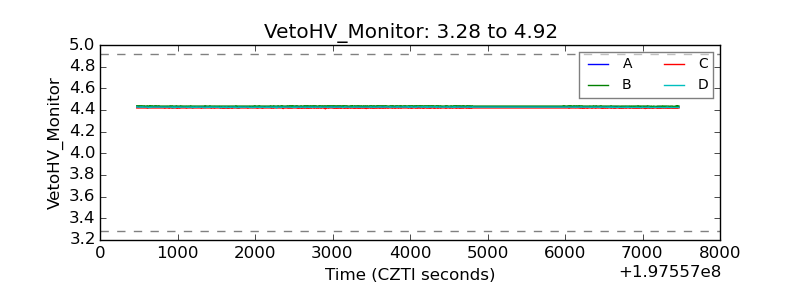 |
| Veto LLD | 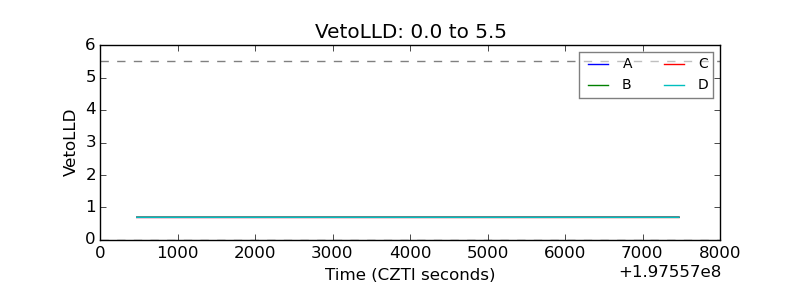 |
| Alpha Counter | 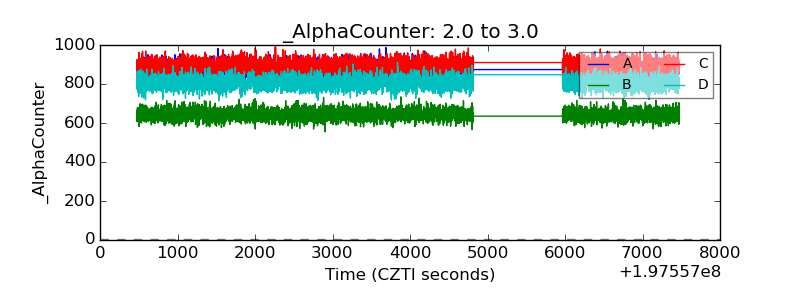 |
| _CPM_Rate | 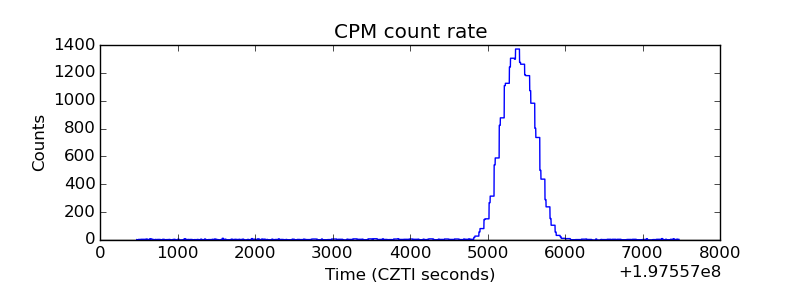 |
| CZT Counter | 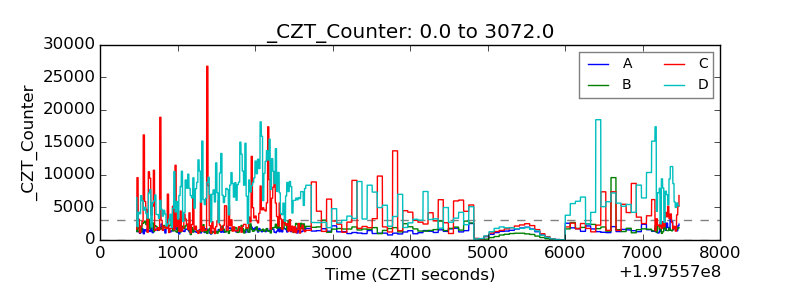 |
| +2.5 Volts monitor |  |
| +5 Volts monitor | 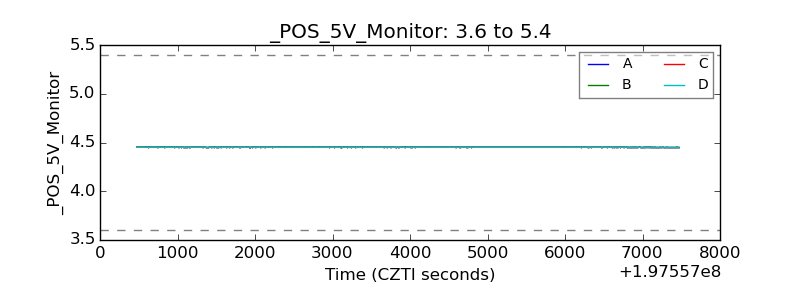 |
| Veto Counter | 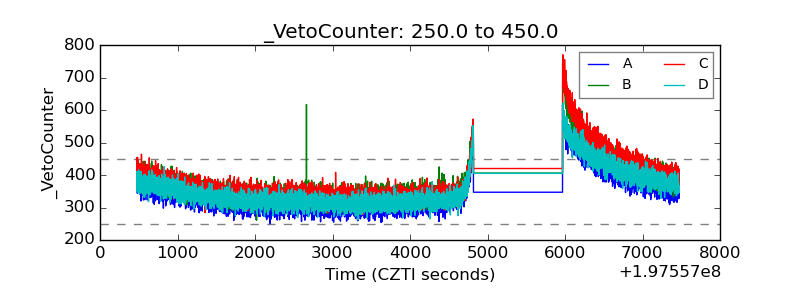 |