| Param | Original file | Final file |
|---|---|---|
| Filename | modeM0/AS1P01_999T99_9000000410_02821cztM0_level2.evt | modeM0/AS1P01_999T99_9000000410_02821cztM0_level2_quad_clean.evt |
| Size (bytes) | 1,710,221,760 | 66,893,760 |
| Size | 1.6 GB | 63.8 MB |
| Events in quadrant A | 9,146,380 | 470,523 |
| Events in quadrant B | 11,451,067 | 472,915 |
| Events in quadrant C | 13,177,043 | 389,739 |
| Events in quadrant D | 17,631,694 | 273,923 |
| Mode SS | |||
|---|---|---|---|
| Quadrant | BADHDUFLAG | Total packets | Discarded packets |
| A | 0 | 120 | 0 |
| B | 0 | 120 | 0 |
| C | 0 | 120 | 0 |
| D | 0 | 120 | 0 |
| Mode M9 | |||
|---|---|---|---|
| Quadrant | BADHDUFLAG | Total packets | Discarded packets |
| A | 0 | 13 | 0 |
| B | 0 | 13 | 0 |
| C | 0 | 13 | 0 |
| D | 0 | 13 | 0 |
| Mode M0 | |||
|---|---|---|---|
| Quadrant | BADHDUFLAG | Total packets | Discarded packets |
| A | 0 | 31368 | 2 |
| B | 0 | 38209 | 1 |
| C | 0 | 43633 | 1 |
| D | 0 | 57384 | 1 |
| Quadrant | Total seconds | Saturated seconds | Saturation percentage |
|---|---|---|---|
| A | 5964 | 134 | 2.246814% |
| B | 5964 | 363 | 6.086519% |
| C | 5964 | 2044 | 34.272300% |
| D | 5964 | 4936 | 82.763246% |
Noise dominated data is calculated using 1-second bins in cleaned event files. If a bin has >2000 counts, and if more than 50% of those come from <1% of pixels, then it is considered to be noise-dominated and hence unusable.
| Quadrant | # 1 sec bins | Bins with >0 counts | Bins with >2000 counts | High rate bins dominated by noise | Noise dominated (total time) | Noise dominated (detector-on time) | Marked lightcurve |
|---|---|---|---|---|---|---|---|
| A | 7209 | 5965 | 915 | 915 | 12.69% | 15.34% | 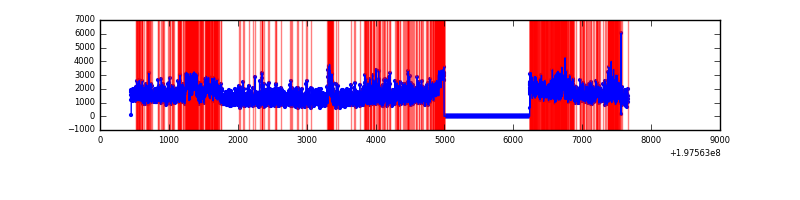 |
| B | 7209 | 5965 | 2187 | 2187 | 30.34% | 36.66% | 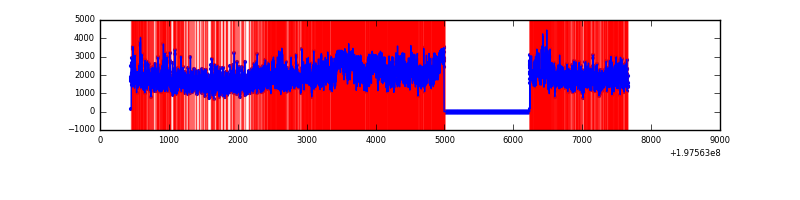 |
| C | 7209 | 5965 | 3009 | 3009 | 41.74% | 50.44% | 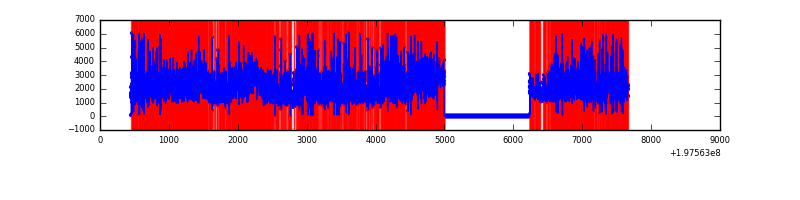 |
| D | 7209 | 5965 | 5719 | 5719 | 79.33% | 95.88% | 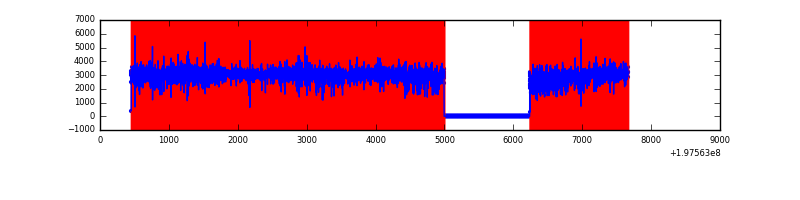 |
Top three noisy pixels from each quadrant. If the there are fewer than three noisy pixels in the level2.evt file, extra rows are filled as -1
| Pixel properties | Quadrant properties | ||||||
|---|---|---|---|---|---|---|---|
| Quadrant | DetID | PixID | Counts | Sigma | Mean | Median | Sigma |
| A | 0 | 31 | 450148 | 922.33 | 2104 | 2086 | 485.8 |
| A | 0 | 50 | 332548 | 680.25 | 2104 | 2086 | 485.8 |
| A | 0 | 117 | 123258 | 249.43 | 2104 | 2086 | 485.8 |
| B | 1 | 158 | 1146199 | 2259.35 | 2177 | 2155 | 506.4 |
| B | 3 | 10 | 833741 | 1642.29 | 2177 | 2155 | 506.4 |
| B | 3 | 11 | 262534 | 514.22 | 2177 | 2155 | 506.4 |
| C | 0 | 219 | 3695519 | 7290.84 | 1742 | 1797 | 506.6 |
| C | 1 | 16 | 1312592 | 2587.31 | 1742 | 1797 | 506.6 |
| C | 1 | 192 | 713989 | 1405.76 | 1742 | 1797 | 506.6 |
| D | 0 | 226 | 7024727 | 18225.53 | 1284 | 1304 | 385.4 |
| D | 1 | 7 | 4247353 | 11018.35 | 1284 | 1304 | 385.4 |
| D | 1 | 31 | 329111 | 850.65 | 1284 | 1304 | 385.4 |
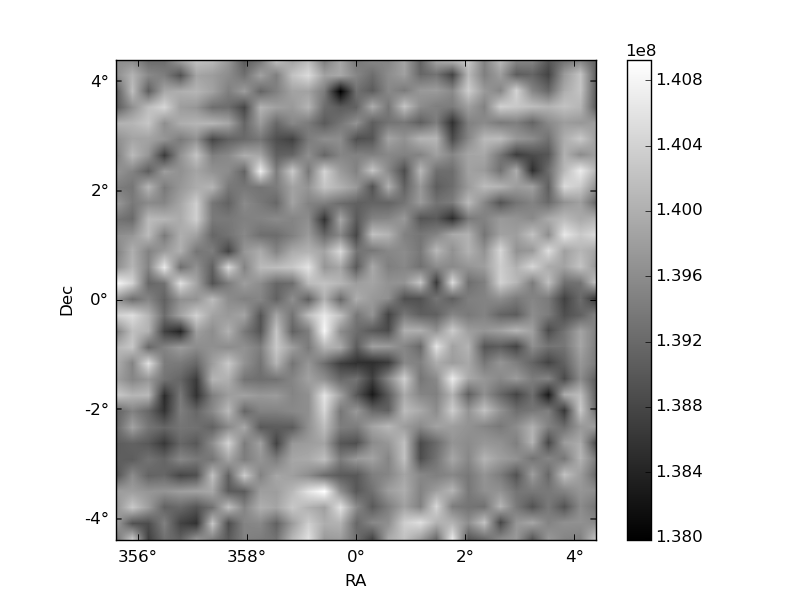
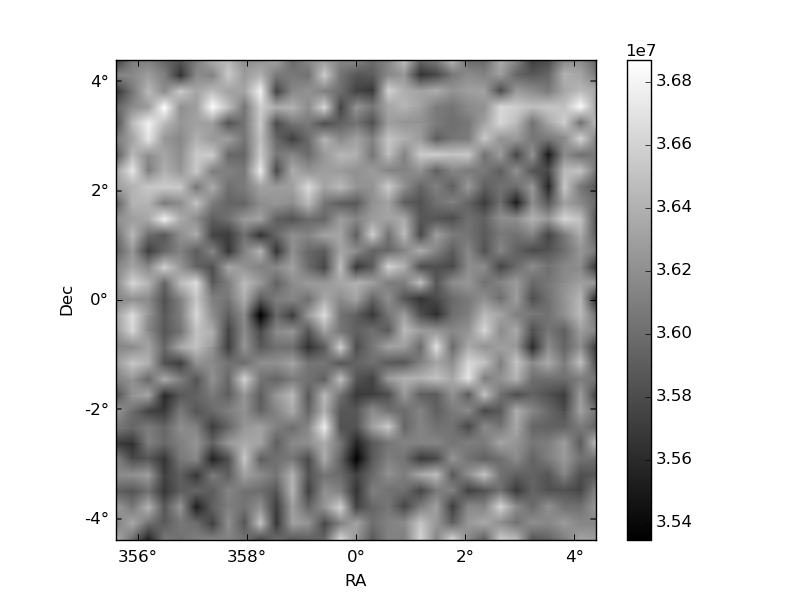
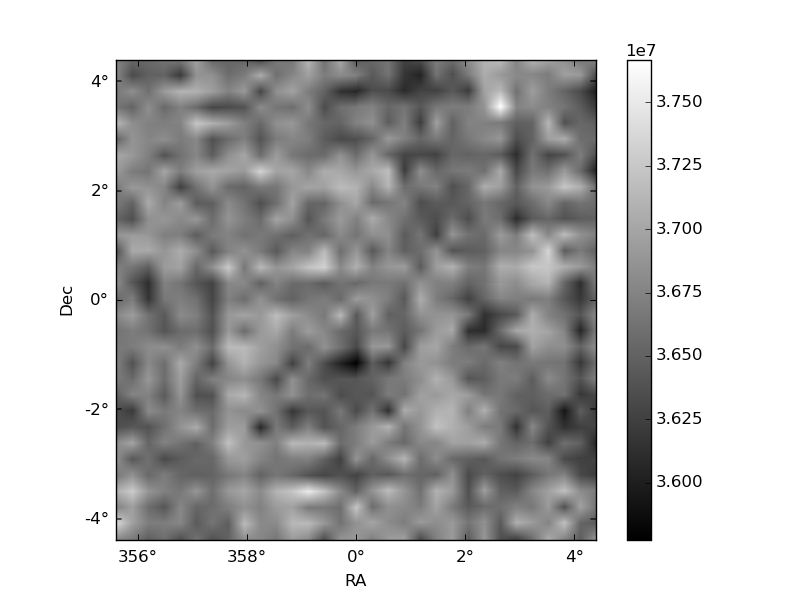
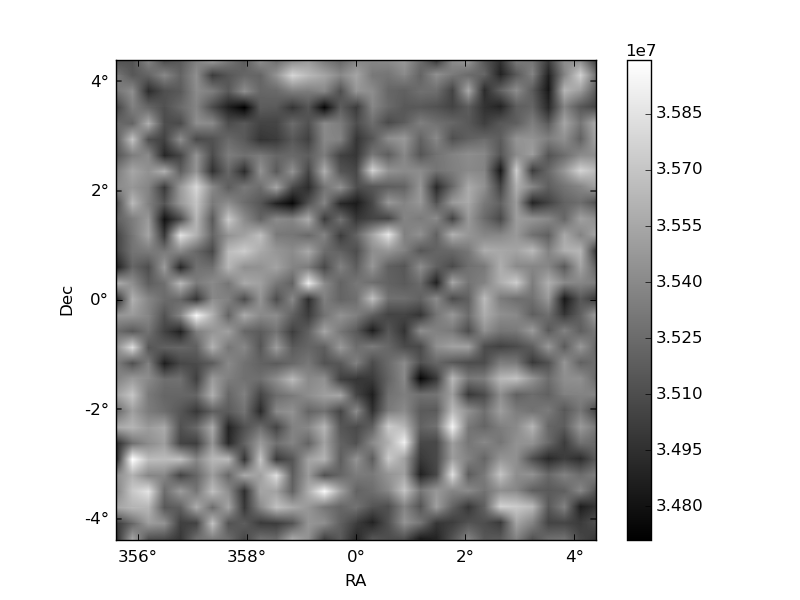
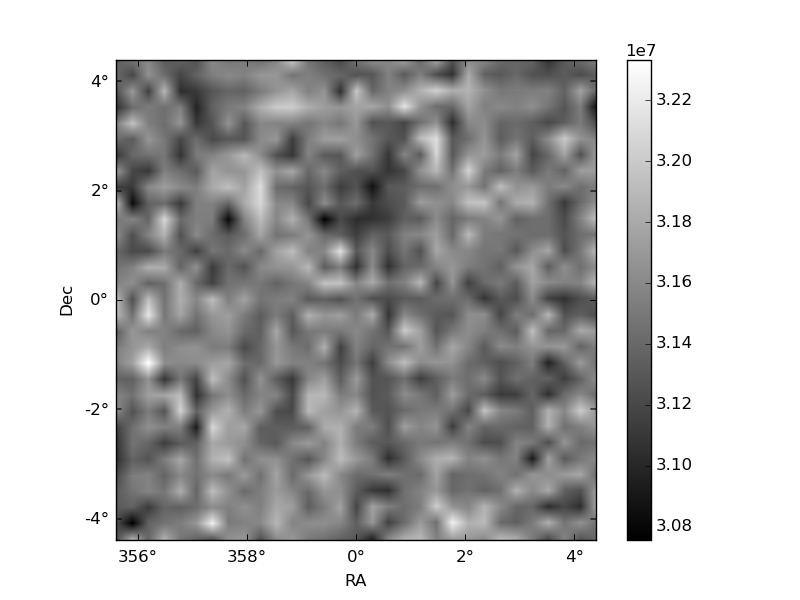
Histogram calculated using DETX and DETY for each event in the final _common_clean file
| Quadrant A | 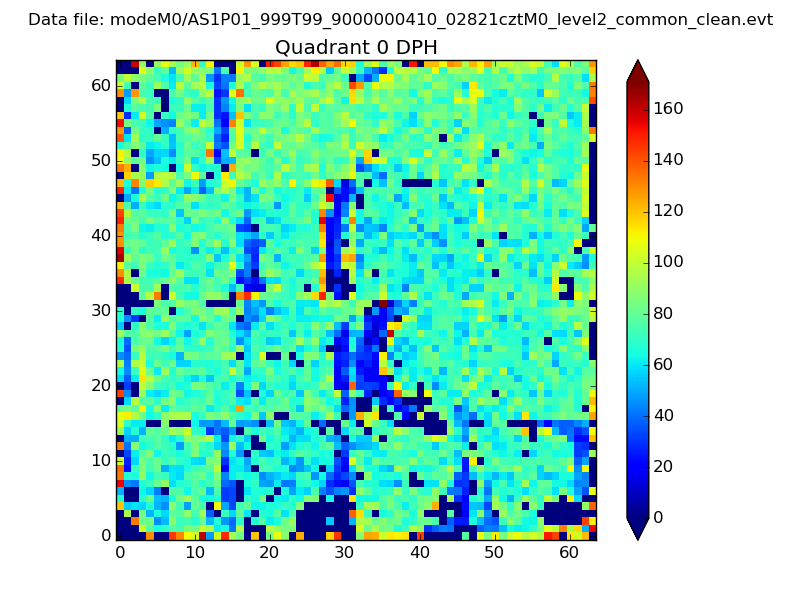 |
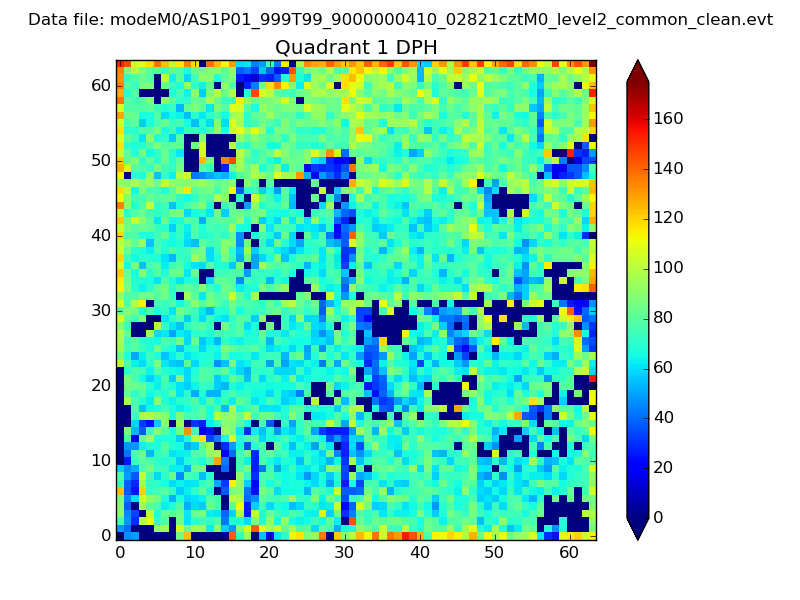 |
Quadrant B |
|---|---|---|---|
| Quadrant D | 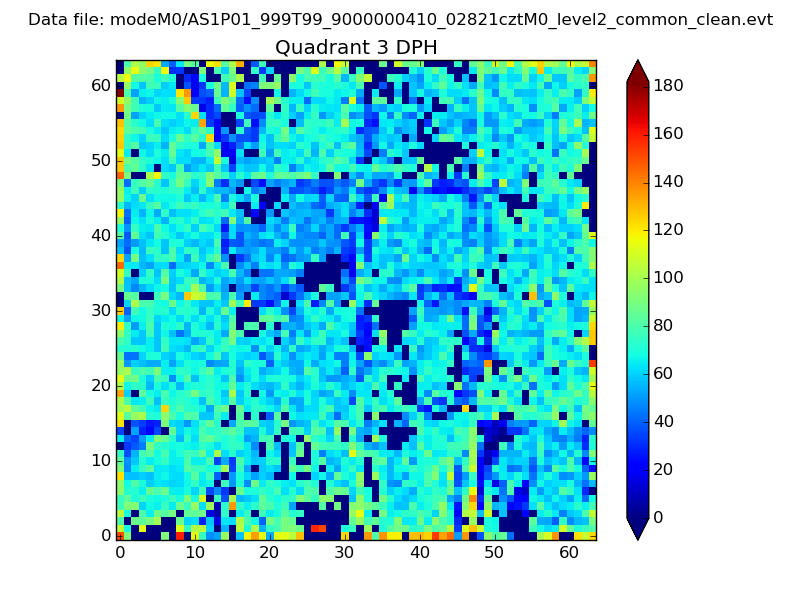 |
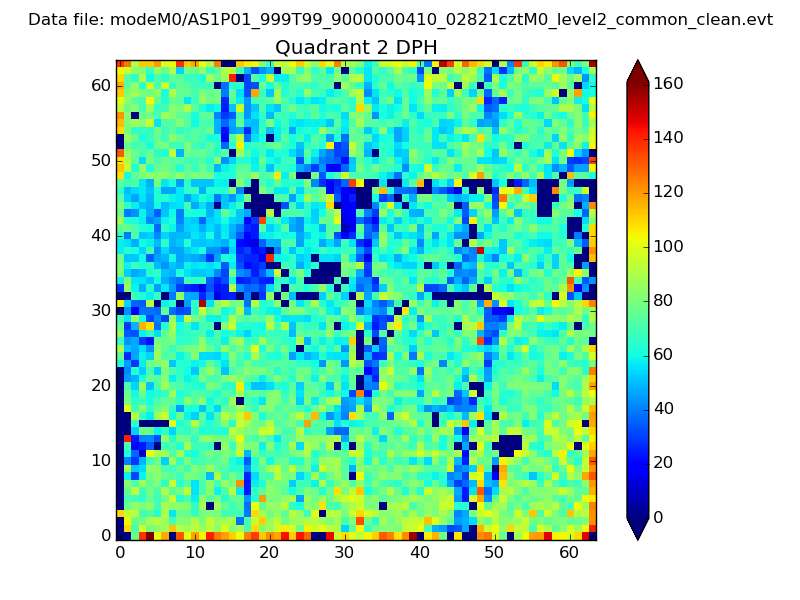 |
Quadrant C |
| Plot type | Count rate plots | Images |
|---|---|---|
| Comparison with Poisson distribution Blue bars denote a histogram of data divided into 1 sec bins. Red curve is a Poisson curve with rate = median count rate of data. |
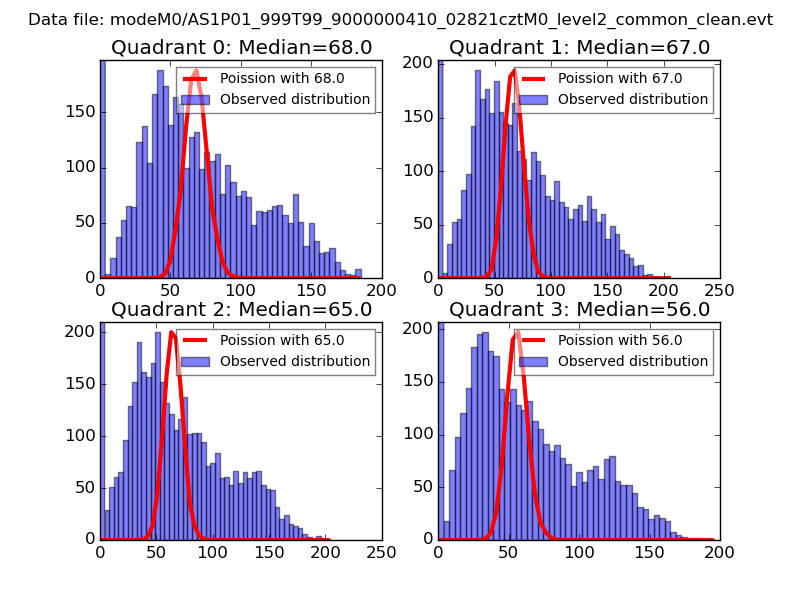 |
 |
| Quadrant-wise count rates Data is divided into 100 sec bins |
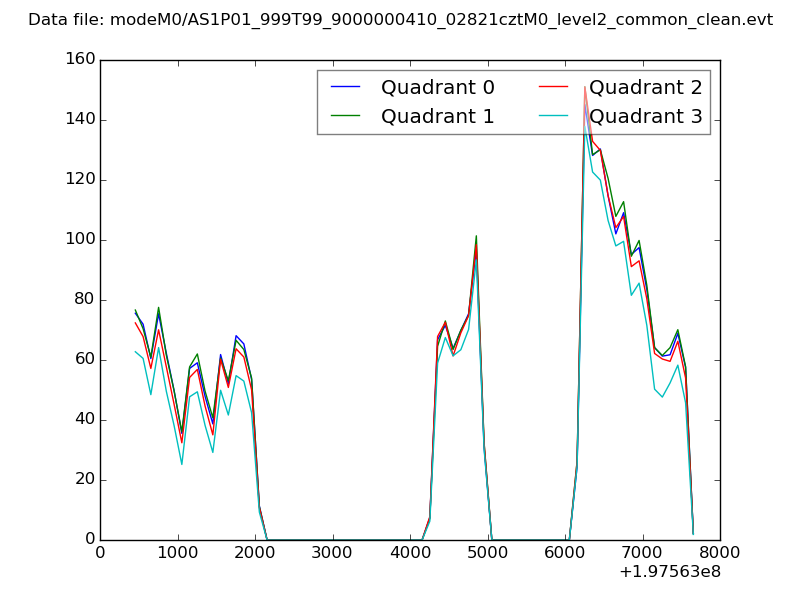 |
|
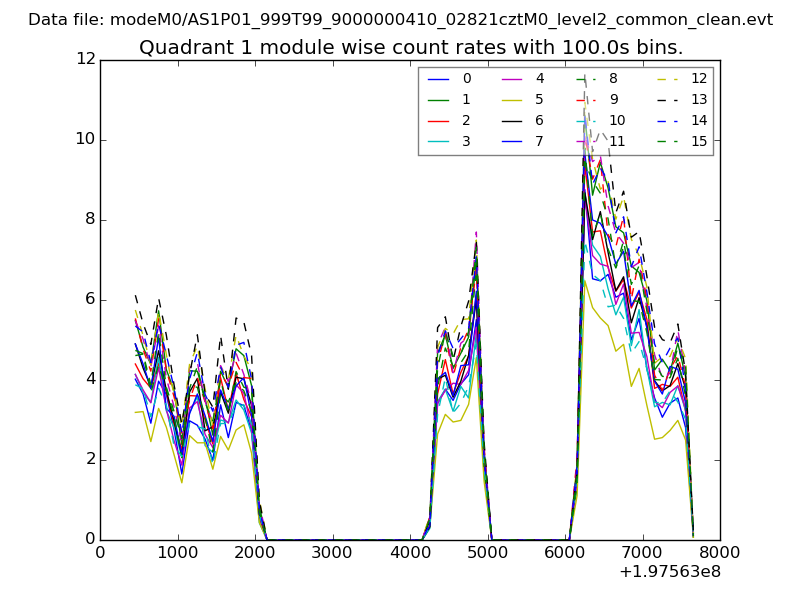
| Module-wise count rates for Quadrant A Data is divided into 100 sec bins |
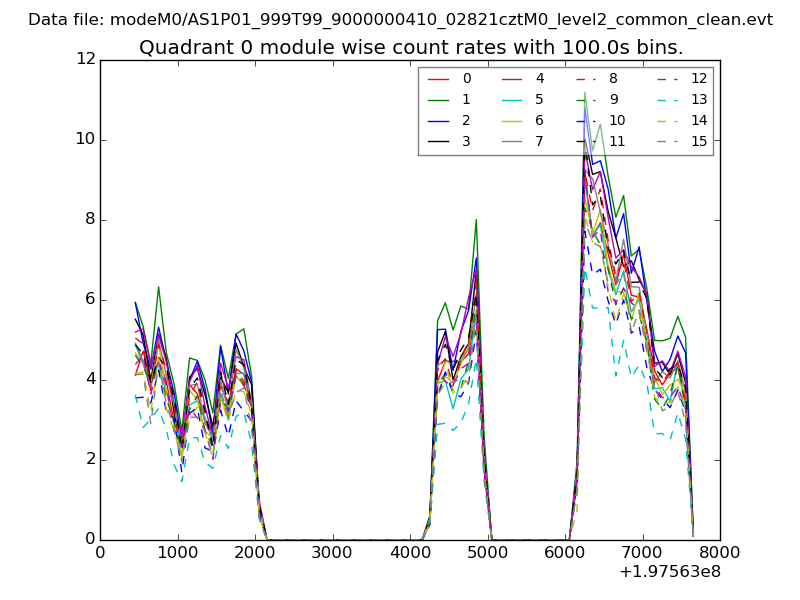 |
 |
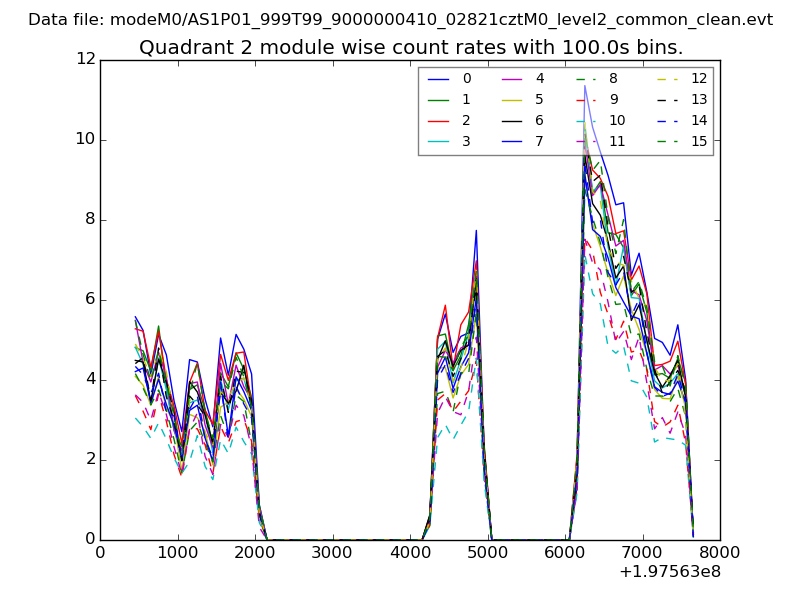
| Module-wise count rates for Quadrant B Data is divided into 100 sec bins |
 |
 |
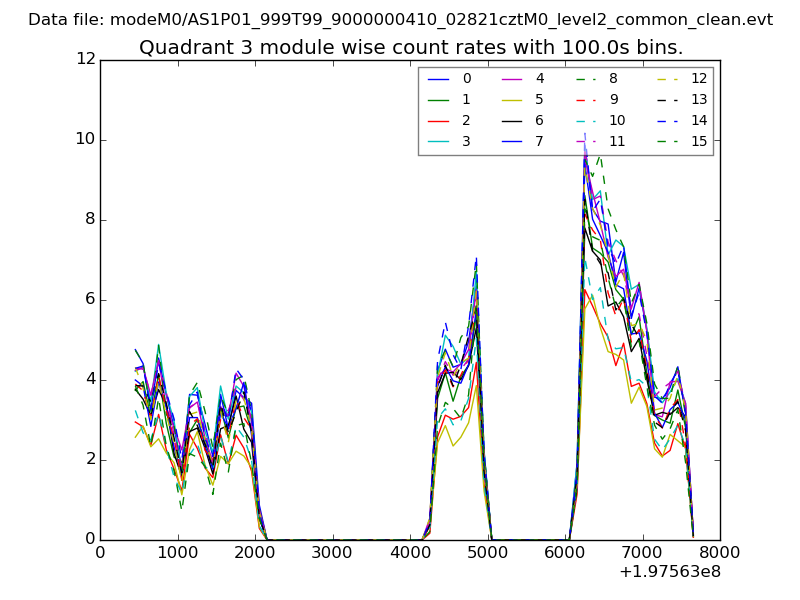
| Module-wise count rates for Quadrant C Data is divided into 100 sec bins |
 |
 |
| Module-wise count rates for Quadrant D Data is divided into 100 sec bins |
 |
 |
| Parameter | Plot |
|---|---|
| CZT HV Monitor | 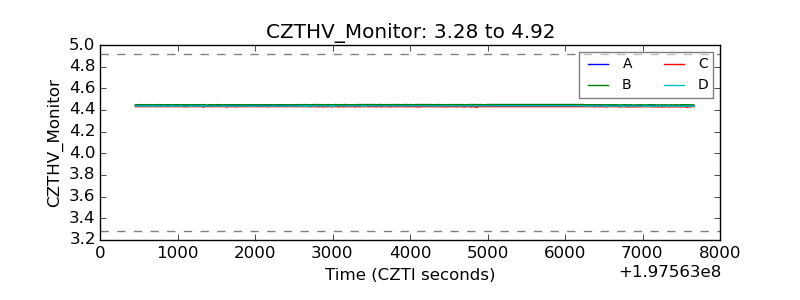 |
| D_VDD | 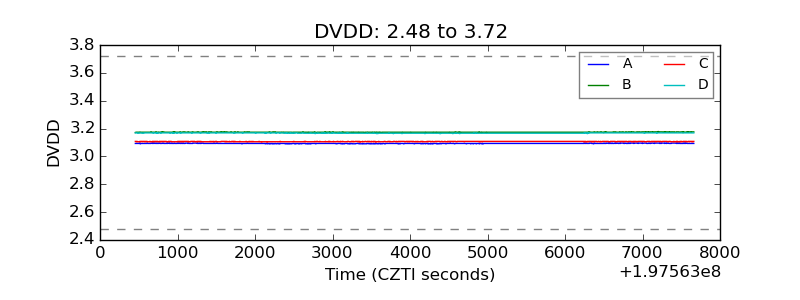 |
| Temperature 1 | 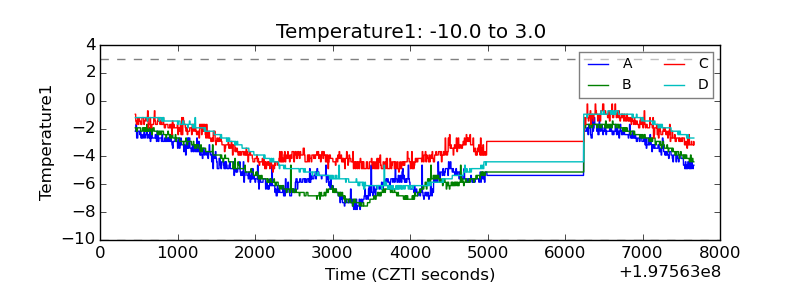 |
| Veto HV Monitor | 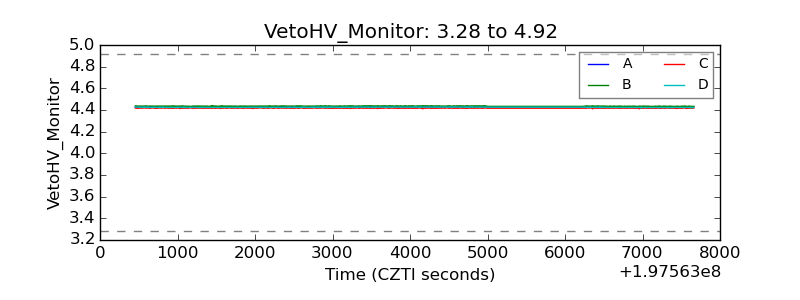 |
| Veto LLD | 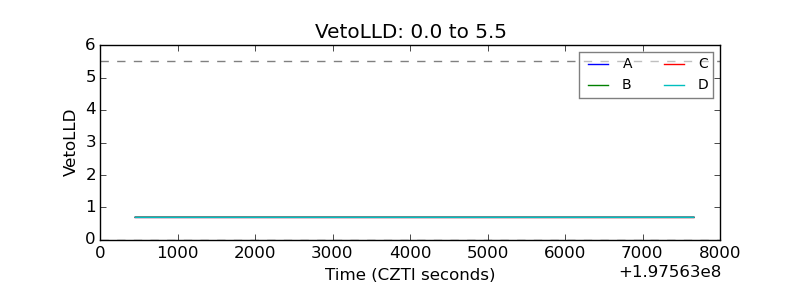 |
| Alpha Counter | 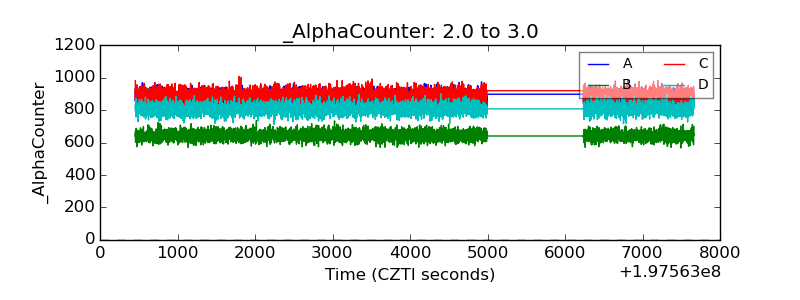 |
| _CPM_Rate | 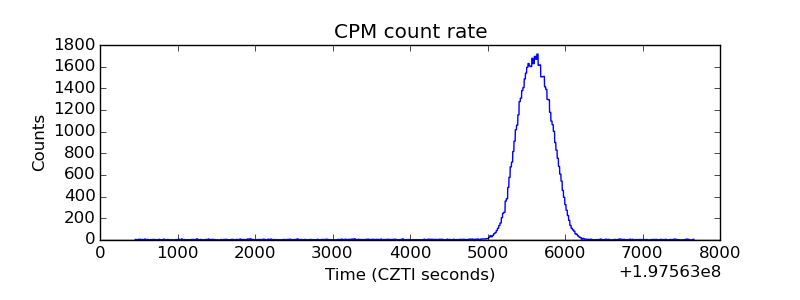 |
| CZT Counter | 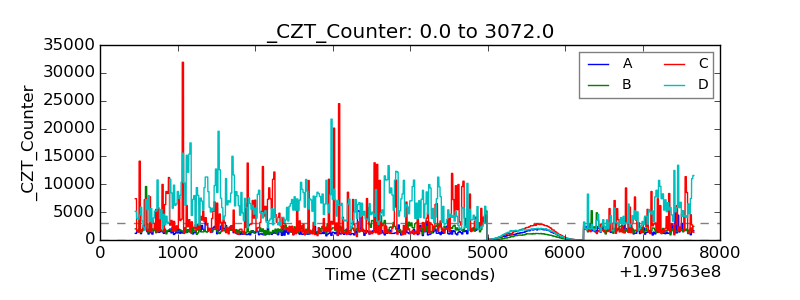 |
| +2.5 Volts monitor | 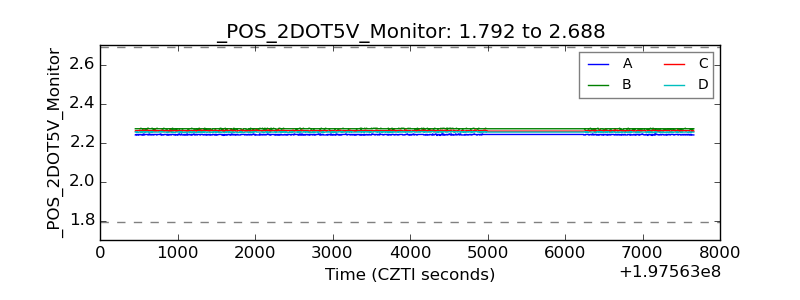 |
| +5 Volts monitor | 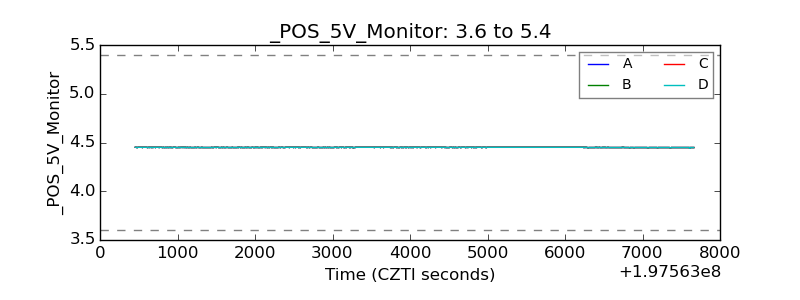 |
| Veto Counter | 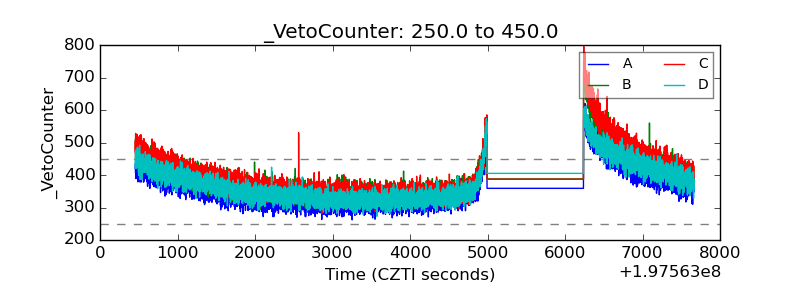 |