| Param | Original file | Final file |
|---|---|---|
| Filename | modeM0/AS1P01_999T99_9000000410_02822cztM0_level2.evt | modeM0/AS1P01_999T99_9000000410_02822cztM0_level2_quad_clean.evt |
| Size (bytes) | 1,594,290,240 | 57,991,680 |
| Size | 1.5 GB | 55.3 MB |
| Events in quadrant A | 8,263,746 | 401,205 |
| Events in quadrant B | 11,079,111 | 401,659 |
| Events in quadrant C | 12,168,455 | 345,750 |
| Events in quadrant D | 16,416,123 | 222,966 |
| Mode SS | |||
|---|---|---|---|
| Quadrant | BADHDUFLAG | Total packets | Discarded packets |
| A | 0 | 110 | 0 |
| B | 0 | 110 | 0 |
| C | 0 | 110 | 0 |
| D | 0 | 110 | 0 |
| Mode M9 | |||
|---|---|---|---|
| Quadrant | BADHDUFLAG | Total packets | Discarded packets |
| A | 0 | 13 | 0 |
| B | 0 | 13 | 0 |
| C | 0 | 13 | 0 |
| D | 0 | 13 | 0 |
| Mode M0 | |||
|---|---|---|---|
| Quadrant | BADHDUFLAG | Total packets | Discarded packets |
| A | 0 | 28438 | 2 |
| B | 0 | 36741 | 1 |
| C | 0 | 40226 | 1 |
| D | 0 | 53440 | 1 |
| Quadrant | Total seconds | Saturated seconds | Saturation percentage |
|---|---|---|---|
| A | 5465 | 197 | 3.604758% |
| B | 5465 | 335 | 6.129918% |
| C | 5465 | 1668 | 30.521500% |
| D | 5465 | 4890 | 89.478500% |
Noise dominated data is calculated using 1-second bins in cleaned event files. If a bin has >2000 counts, and if more than 50% of those come from <1% of pixels, then it is considered to be noise-dominated and hence unusable.
| Quadrant | # 1 sec bins | Bins with >0 counts | Bins with >2000 counts | High rate bins dominated by noise | Noise dominated (total time) | Noise dominated (detector-on time) | Marked lightcurve |
|---|---|---|---|---|---|---|---|
| A | 6730 | 5466 | 846 | 846 | 12.57% | 15.48% | 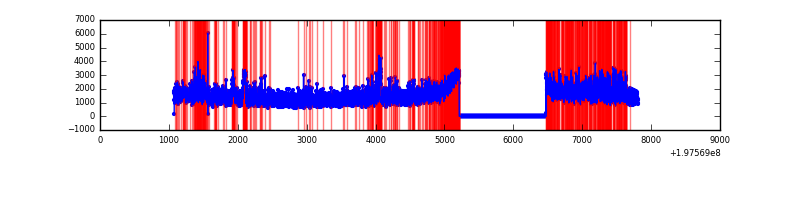 |
| B | 6730 | 5466 | 2514 | 2514 | 37.36% | 45.99% | 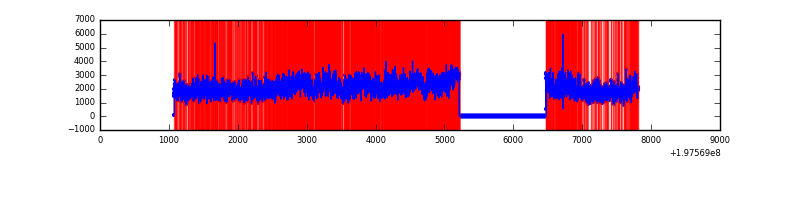 |
| C | 6730 | 5465 | 2906 | 2906 | 43.18% | 53.17% | 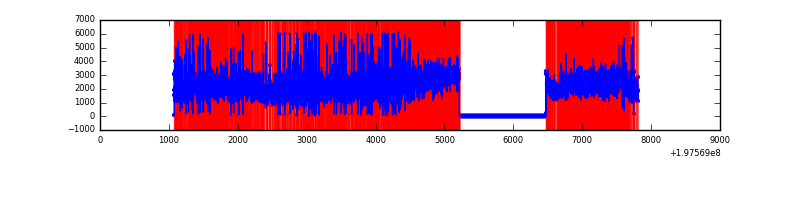 |
| D | 6730 | 5466 | 5323 | 5323 | 79.09% | 97.38% | 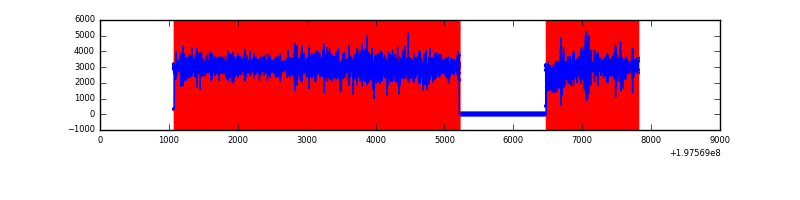 |
Top three noisy pixels from each quadrant. If the there are fewer than three noisy pixels in the level2.evt file, extra rows are filled as -1
| Pixel properties | Quadrant properties | ||||||
|---|---|---|---|---|---|---|---|
| Quadrant | DetID | PixID | Counts | Sigma | Mean | Median | Sigma |
| A | 0 | 13 | 475342 | 1072.54 | 1915 | 1899 | 441.4 |
| A | 0 | 31 | 181455 | 406.77 | 1915 | 1899 | 441.4 |
| A | 0 | 50 | 125687 | 280.43 | 1915 | 1899 | 441.4 |
| B | 0 | 191 | 1060281 | 2296.76 | 1983 | 1958 | 460.8 |
| B | 1 | 158 | 1057574 | 2290.88 | 1983 | 1958 | 460.8 |
| B | 3 | 10 | 328624 | 708.93 | 1983 | 1958 | 460.8 |
| C | 0 | 219 | 2034638 | 4228.04 | 1647 | 1695 | 480.8 |
| C | 1 | 16 | 1250091 | 2596.37 | 1647 | 1695 | 480.8 |
| C | 1 | 192 | 1125723 | 2337.71 | 1647 | 1695 | 480.8 |
| D | 0 | 11 | 6920993 | 21205.57 | 1087 | 1101 | 326.3 |
| D | 0 | 226 | 4211232 | 12901.68 | 1087 | 1101 | 326.3 |
| D | 1 | 31 | 234990 | 716.74 | 1087 | 1101 | 326.3 |
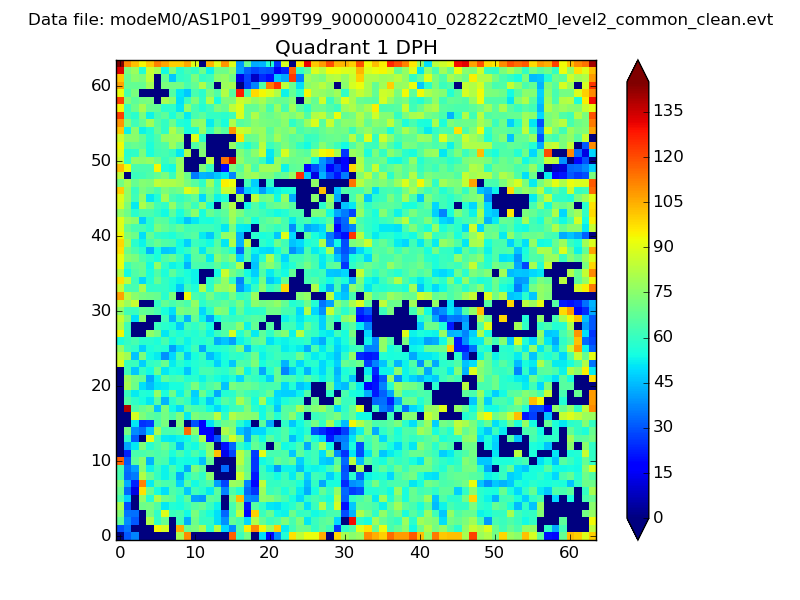
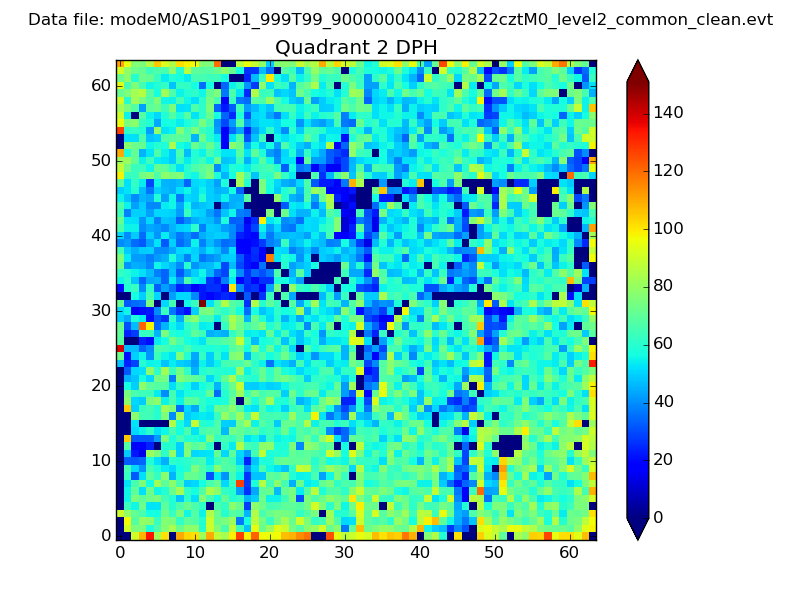
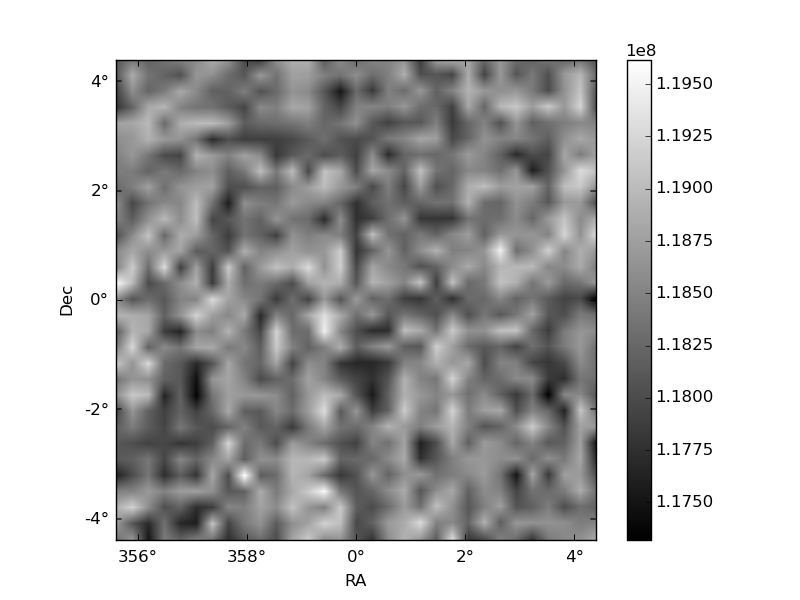
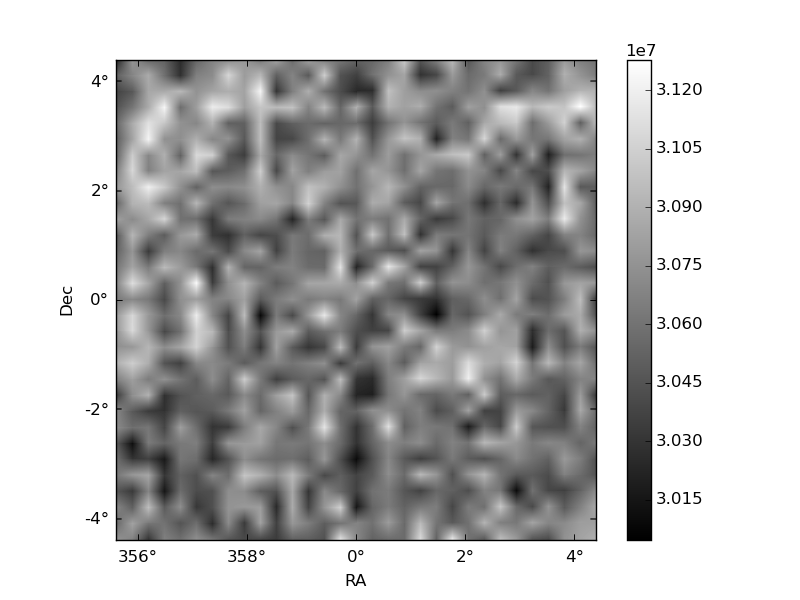
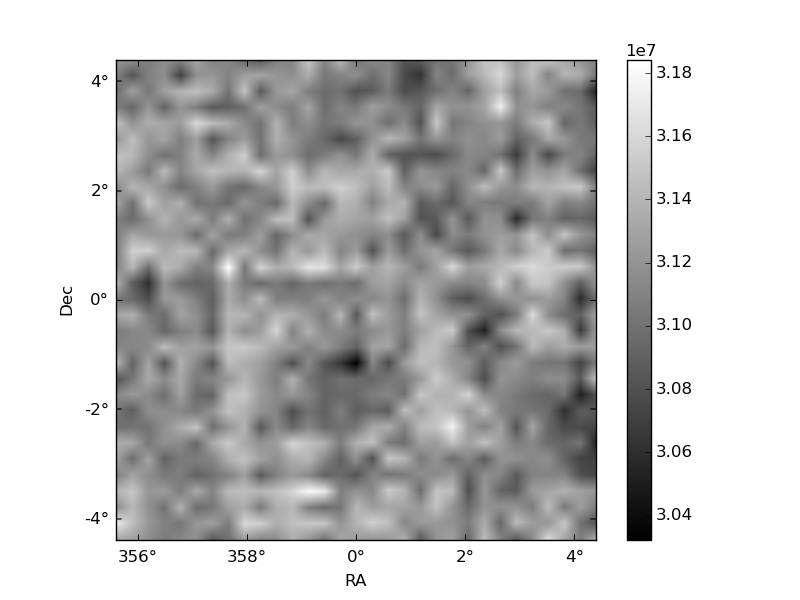
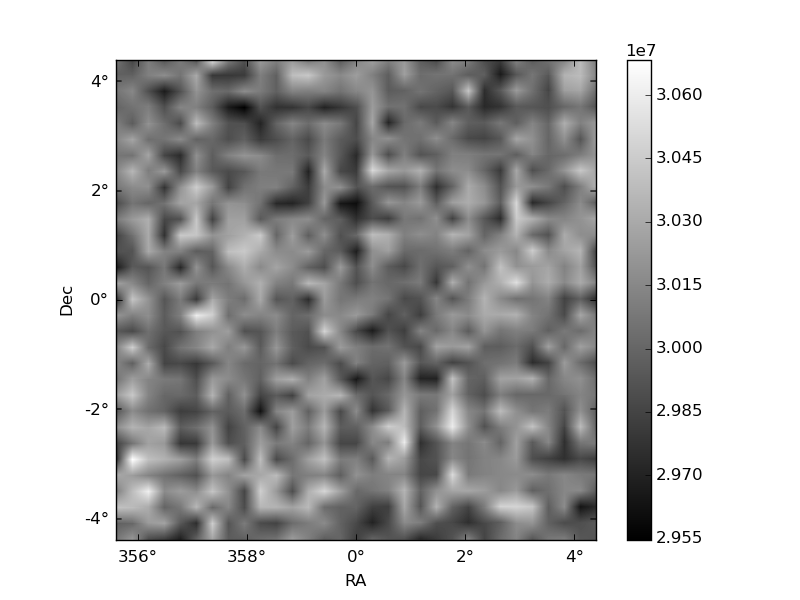
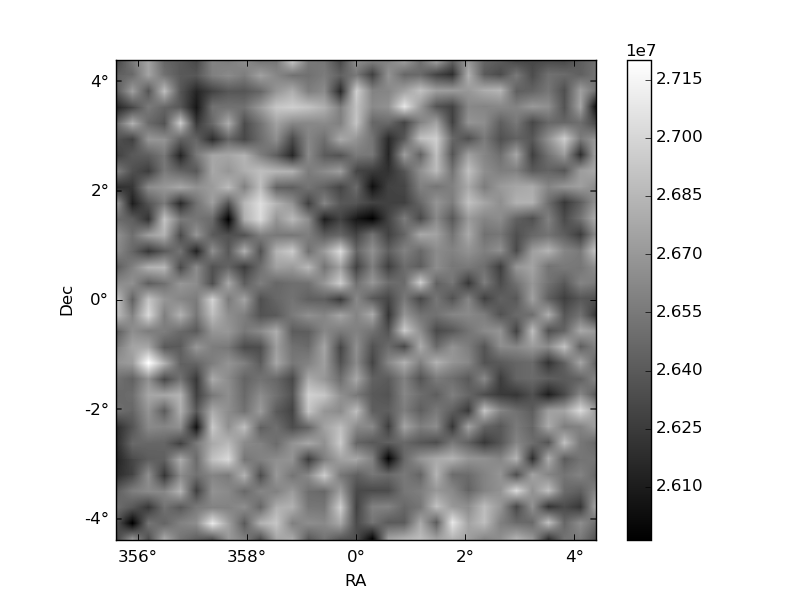
Histogram calculated using DETX and DETY for each event in the final _common_clean file
| Quadrant A |  |
 |
Quadrant B |
|---|---|---|---|
| Quadrant D | 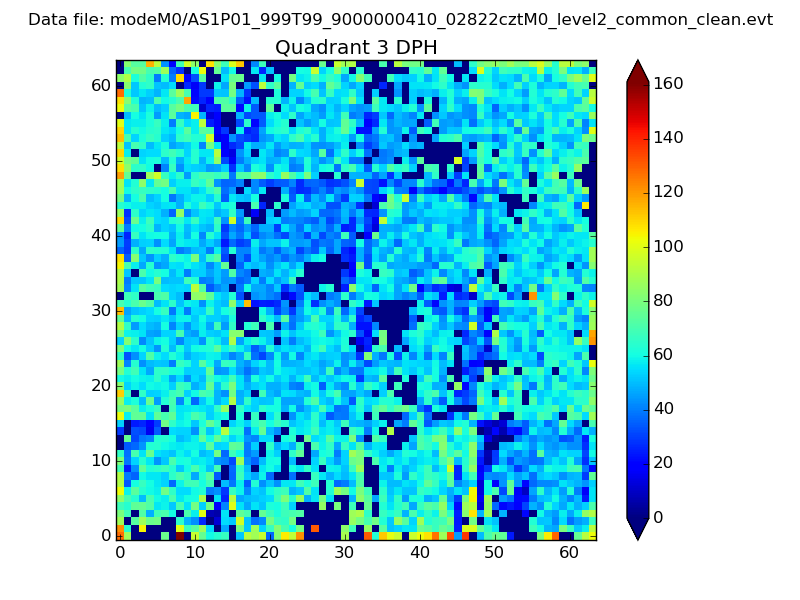 |
 |
Quadrant C |
| Plot type | Count rate plots | Images |
|---|---|---|
| Comparison with Poisson distribution Blue bars denote a histogram of data divided into 1 sec bins. Red curve is a Poisson curve with rate = median count rate of data. |
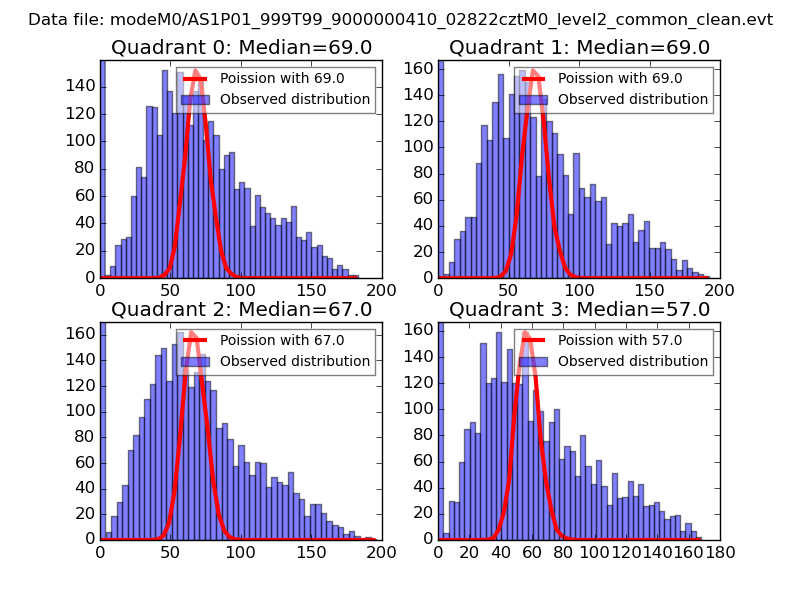 |
 |
| Quadrant-wise count rates Data is divided into 100 sec bins |
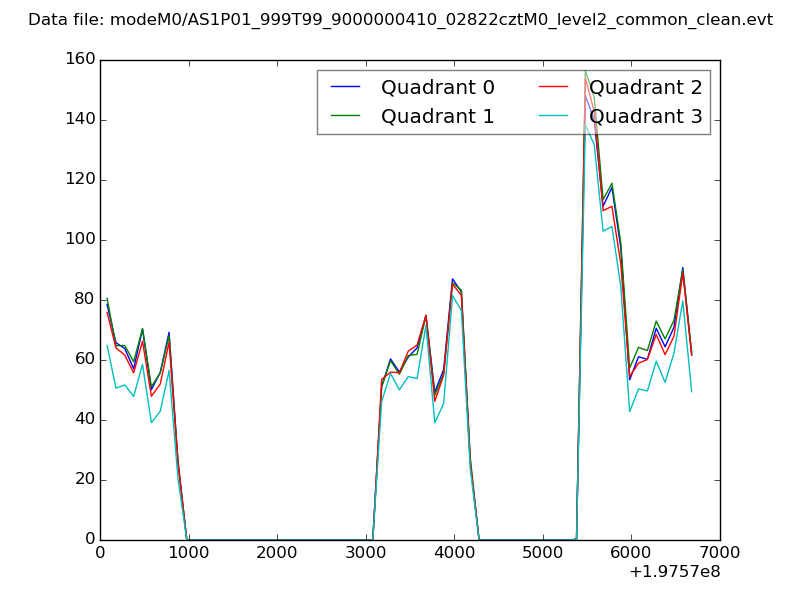 |
|
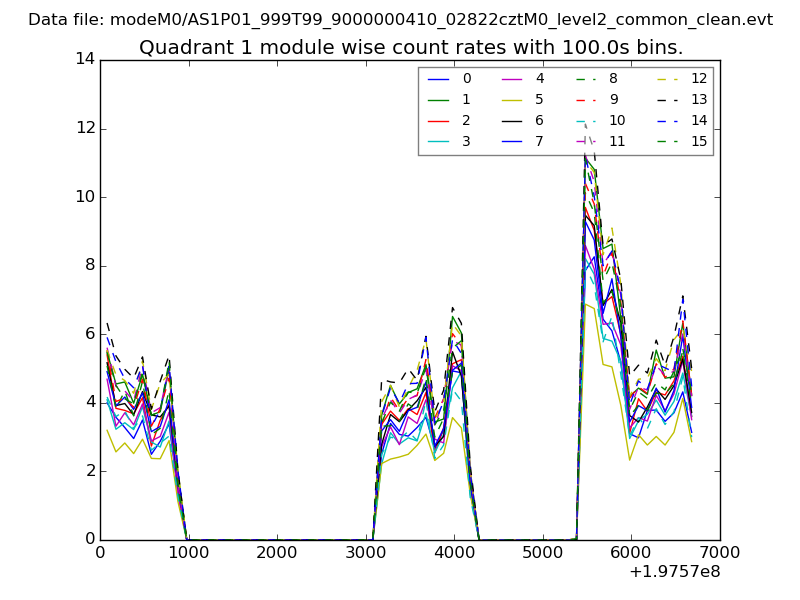
| Module-wise count rates for Quadrant A Data is divided into 100 sec bins |
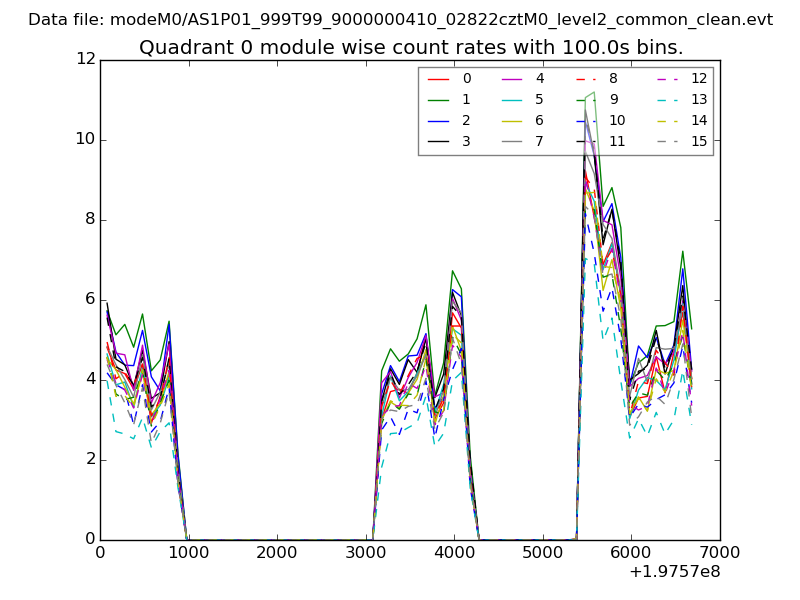 |
 |
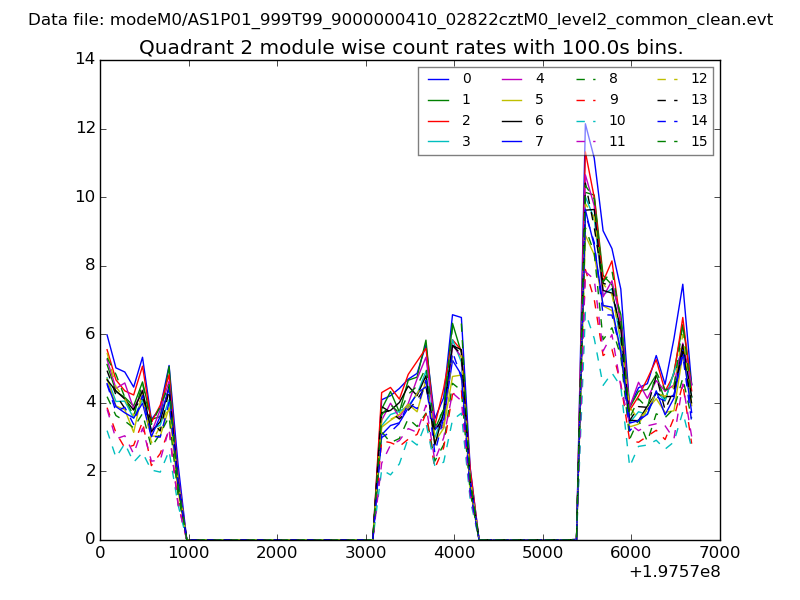
| Module-wise count rates for Quadrant B Data is divided into 100 sec bins |
 |
 |
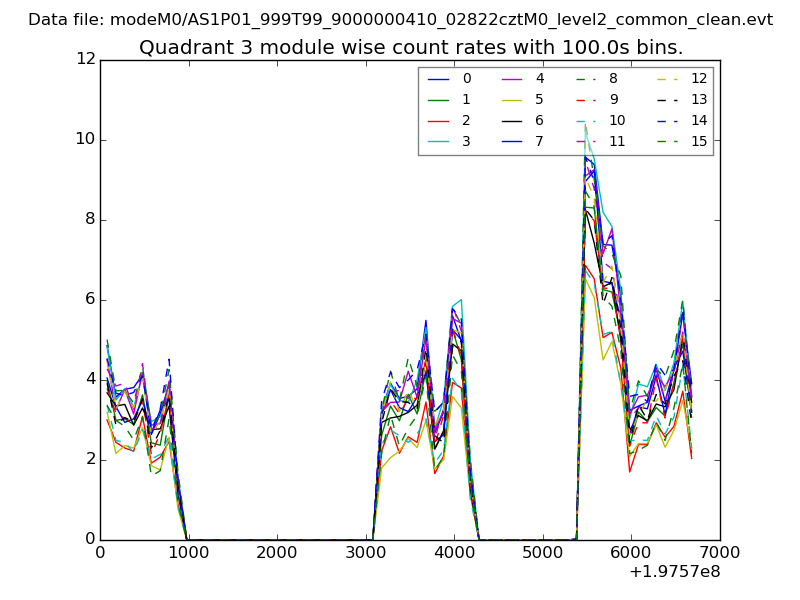
| Module-wise count rates for Quadrant C Data is divided into 100 sec bins |
 |
 |
| Module-wise count rates for Quadrant D Data is divided into 100 sec bins |
 |
 |
| Parameter | Plot |
|---|---|
| CZT HV Monitor | 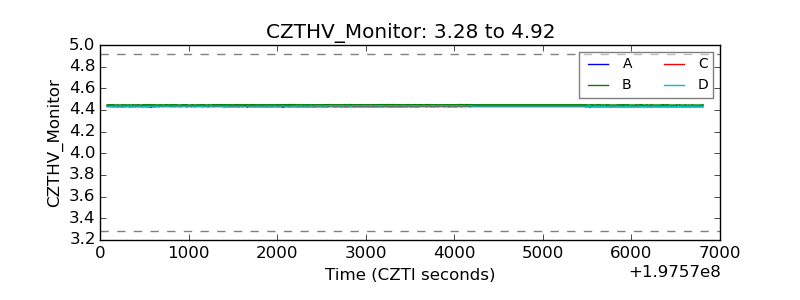 |
| D_VDD | 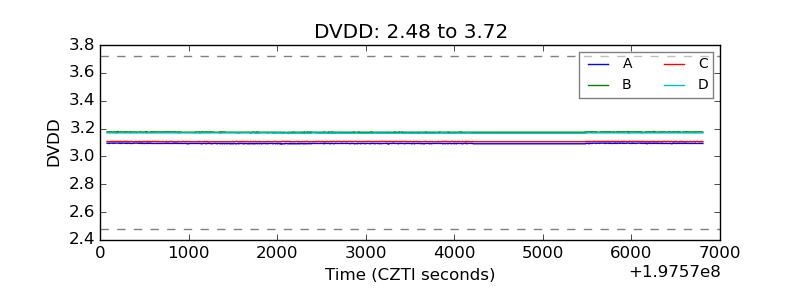 |
| Temperature 1 | 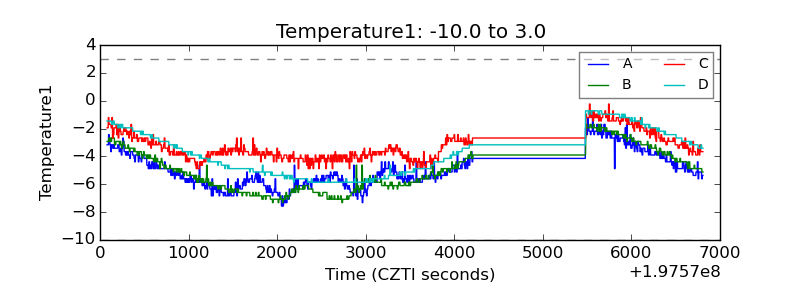 |
| Veto HV Monitor | 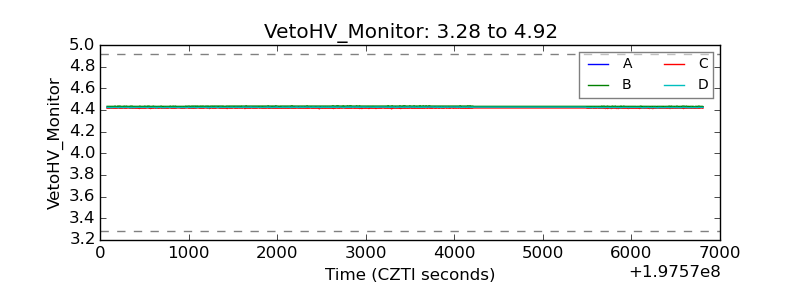 |
| Veto LLD | 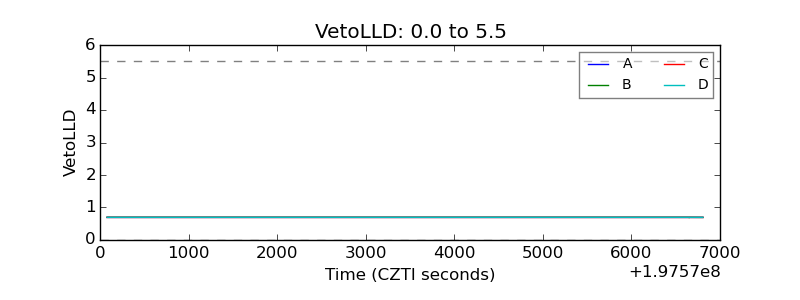 |
| Alpha Counter | 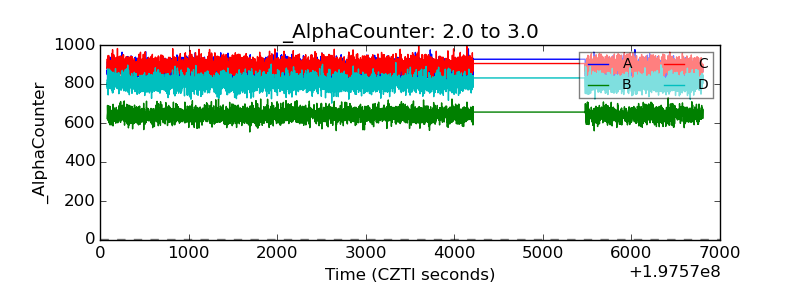 |
| _CPM_Rate | 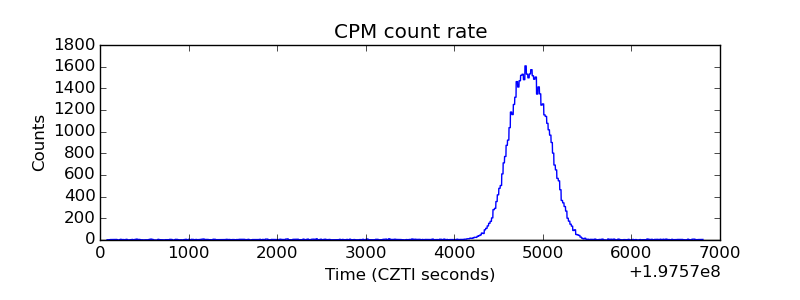 |
| CZT Counter |  |
| +2.5 Volts monitor |  |
| +5 Volts monitor |  |
| Veto Counter | 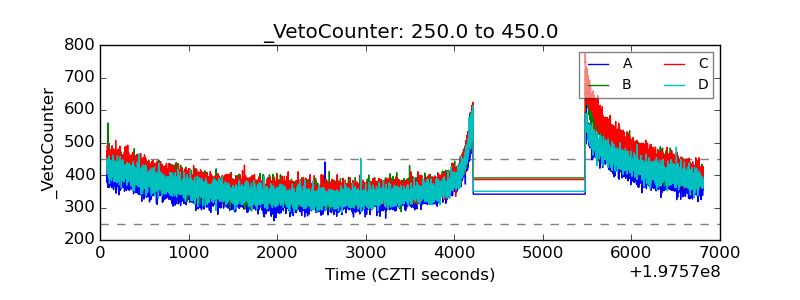 |