| Param | Original file | Final file |
|---|---|---|
| Filename | modeM0/AS1P01_999T99_9000000410_02823cztM0_level2.evt | modeM0/AS1P01_999T99_9000000410_02823cztM0_level2_quad_clean.evt |
| Size (bytes) | 1,677,490,560 | 55,344,960 |
| Size | 1.6 GB | 52.8 MB |
| Events in quadrant A | 8,492,599 | 364,615 |
| Events in quadrant B | 12,435,606 | 361,540 |
| Events in quadrant C | 12,512,713 | 335,282 |
| Events in quadrant D | 16,989,269 | 211,833 |
| Mode SS | |||
|---|---|---|---|
| Quadrant | BADHDUFLAG | Total packets | Discarded packets |
| A | 0 | 118 | 0 |
| B | 0 | 118 | 0 |
| C | 0 | 118 | 0 |
| D | 0 | 118 | 0 |
| Mode M9 | |||
|---|---|---|---|
| Quadrant | BADHDUFLAG | Total packets | Discarded packets |
| A | 0 | 12 | 0 |
| B | 0 | 12 | 0 |
| C | 0 | 12 | 0 |
| D | 0 | 12 | 0 |
| Mode M0 | |||
|---|---|---|---|
| Quadrant | BADHDUFLAG | Total packets | Discarded packets |
| A | 0 | 29298 | 2 |
| B | 0 | 41118 | 1 |
| C | 0 | 41392 | 1 |
| D | 0 | 55310 | 1 |
| Quadrant | Total seconds | Saturated seconds | Saturation percentage |
|---|---|---|---|
| A | 5722 | 147 | 2.569032% |
| B | 5722 | 1216 | 21.251311% |
| C | 5722 | 1538 | 26.878714% |
| D | 5722 | 4837 | 84.533380% |
Noise dominated data is calculated using 1-second bins in cleaned event files. If a bin has >2000 counts, and if more than 50% of those come from <1% of pixels, then it is considered to be noise-dominated and hence unusable.
| Quadrant | # 1 sec bins | Bins with >0 counts | Bins with >2000 counts | High rate bins dominated by noise | Noise dominated (total time) | Noise dominated (detector-on time) | Marked lightcurve |
|---|---|---|---|---|---|---|---|
| A | 7017 | 5723 | 801 | 801 | 11.42% | 14.00% | 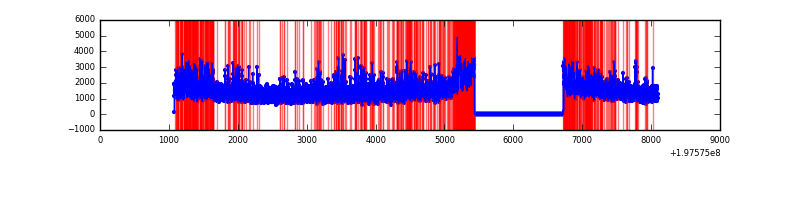 |
| B | 7017 | 5723 | 2994 | 2994 | 42.67% | 52.32% | 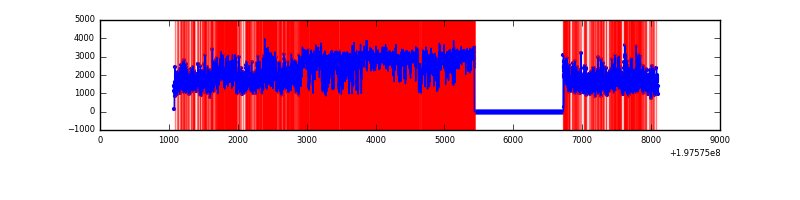 |
| C | 7017 | 5722 | 2987 | 2987 | 42.57% | 52.20% | 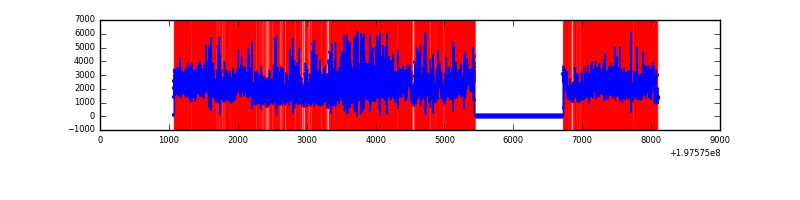 |
| D | 7017 | 5723 | 5470 | 5470 | 77.95% | 95.58% | 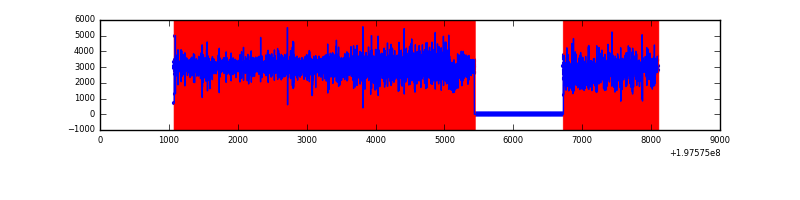 |
Top three noisy pixels from each quadrant. If the there are fewer than three noisy pixels in the level2.evt file, extra rows are filled as -1
| Pixel properties | Quadrant properties | ||||||
|---|---|---|---|---|---|---|---|
| Quadrant | DetID | PixID | Counts | Sigma | Mean | Median | Sigma |
| A | 0 | 13 | 606291 | 1339.7 | 1981 | 1963 | 451.1 |
| A | 0 | 31 | 106665 | 232.11 | 1981 | 1963 | 451.1 |
| A | 0 | 117 | 40954 | 86.44 | 1981 | 1963 | 451.1 |
| B | 0 | 191 | 997439 | 2142.16 | 2010 | 1988 | 464.7 |
| B | 0 | 219 | 963656 | 2069.46 | 2010 | 1988 | 464.7 |
| B | 1 | 158 | 837227 | 1797.39 | 2010 | 1988 | 464.7 |
| C | 0 | 219 | 1714519 | 3358.45 | 1748 | 1803 | 510.0 |
| C | 1 | 16 | 1710527 | 3350.62 | 1748 | 1803 | 510.0 |
| C | 1 | 192 | 1008850 | 1974.71 | 1748 | 1803 | 510.0 |
| D | 0 | 226 | 7034367 | 20336.64 | 1155 | 1168 | 345.8 |
| D | 1 | 31 | 4357893 | 12597.56 | 1155 | 1168 | 345.8 |
| D | 1 | 66 | 229067 | 658.97 | 1155 | 1168 | 345.8 |
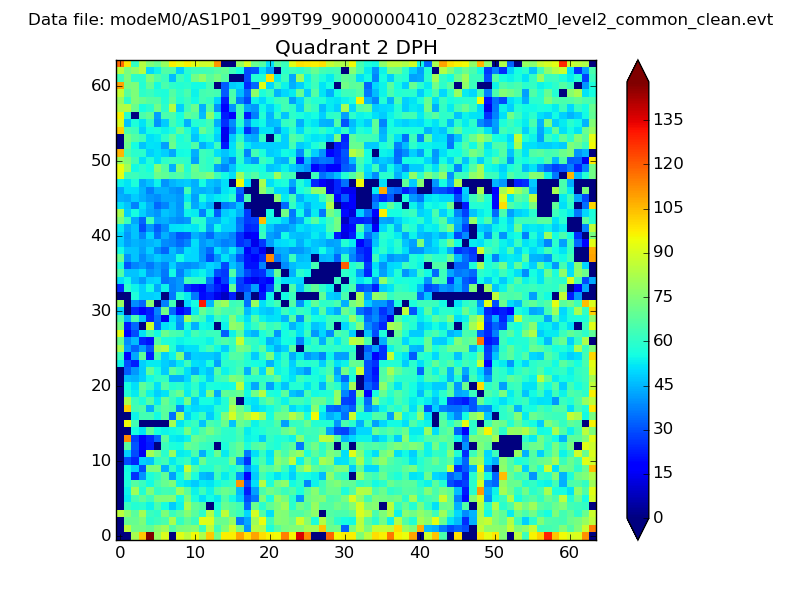
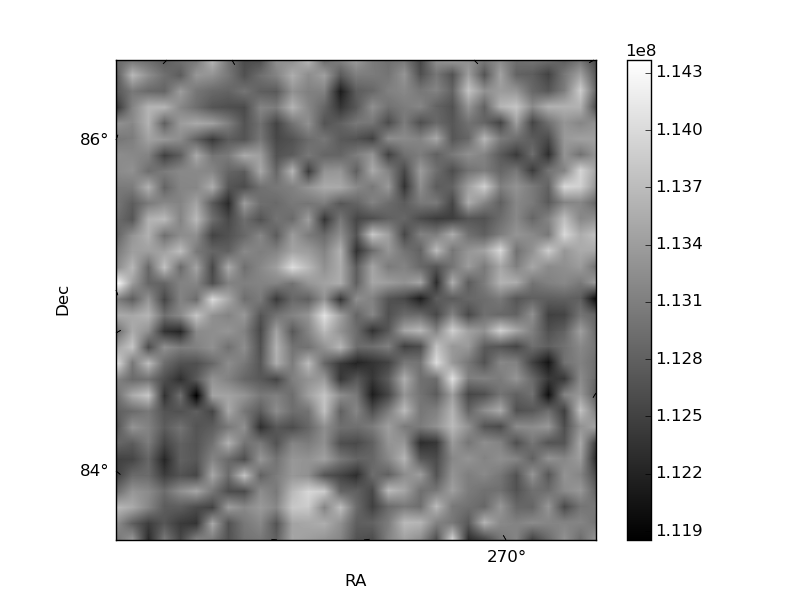
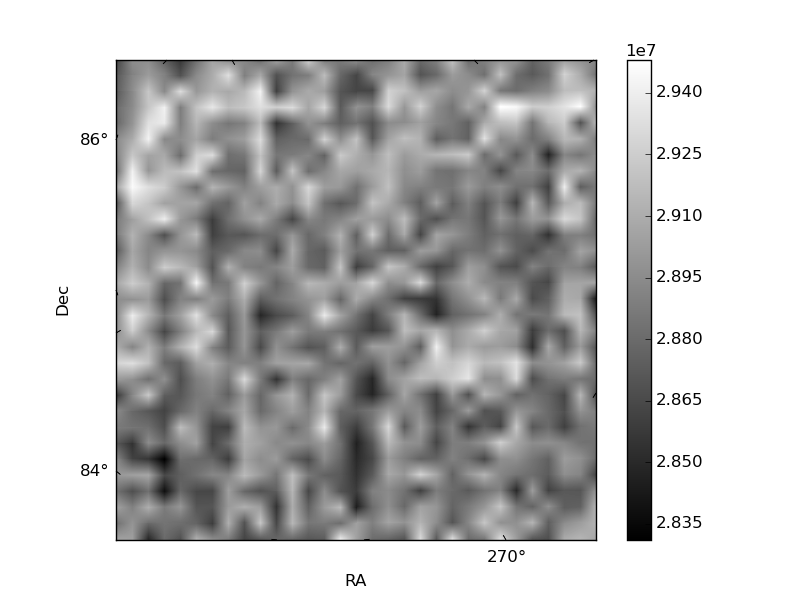
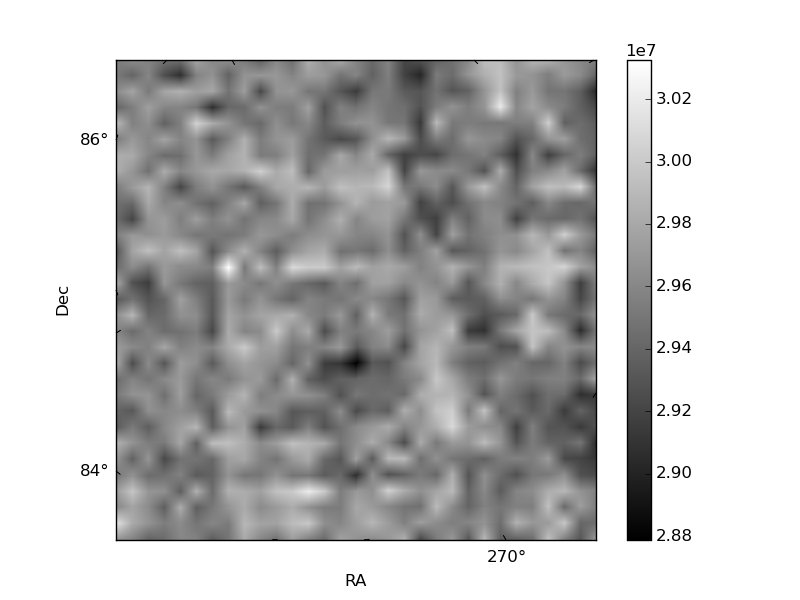
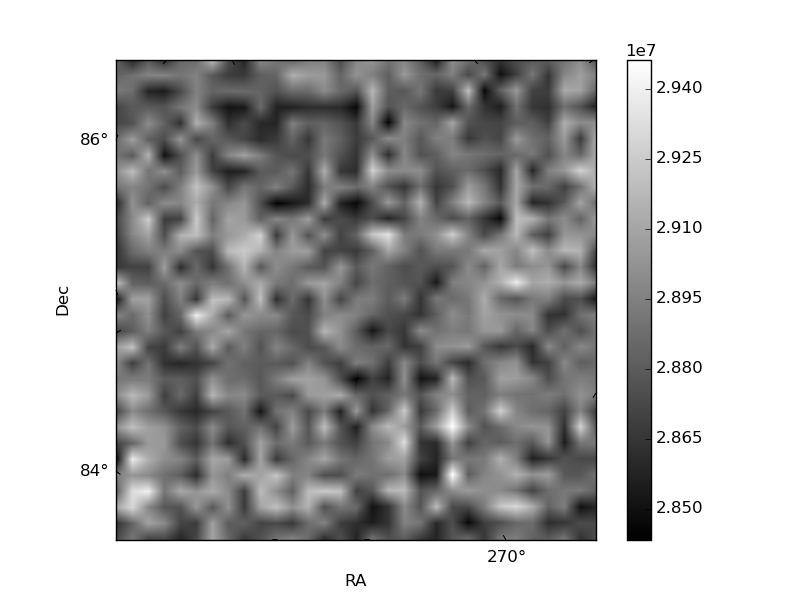
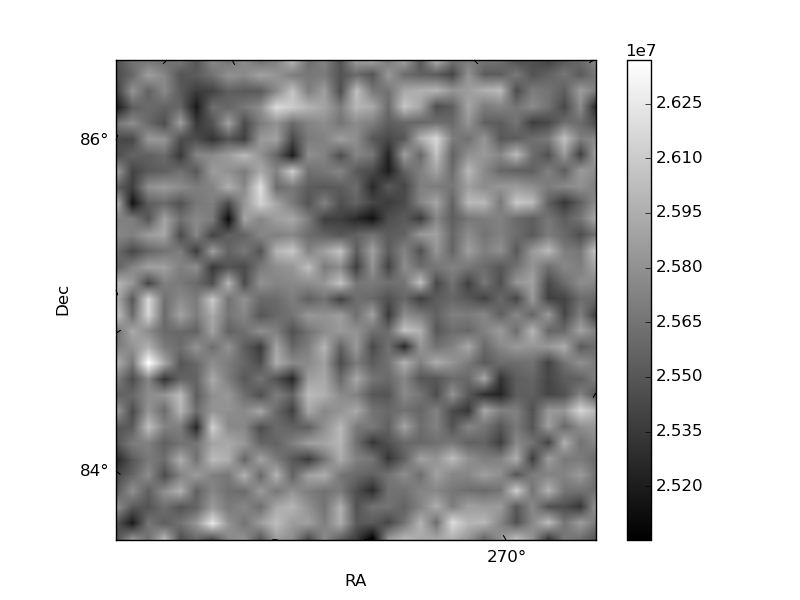
Histogram calculated using DETX and DETY for each event in the final _common_clean file
| Quadrant A | 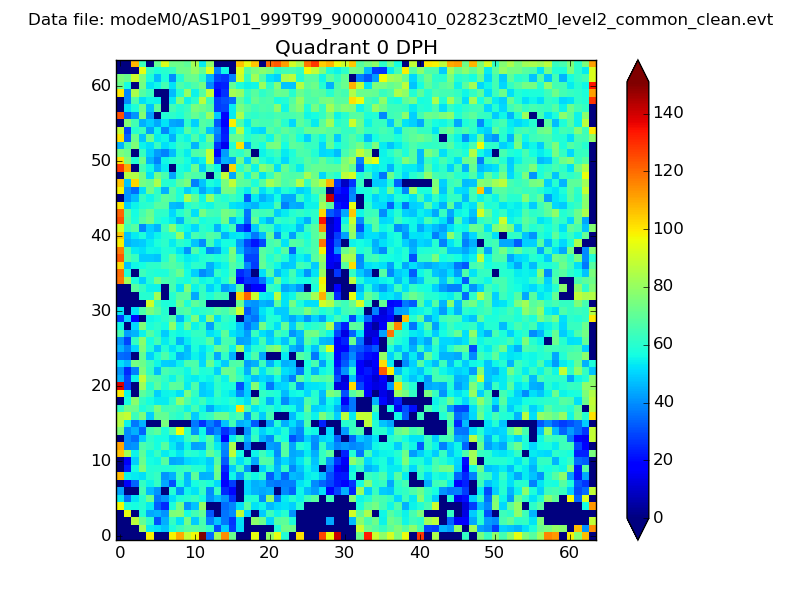 |
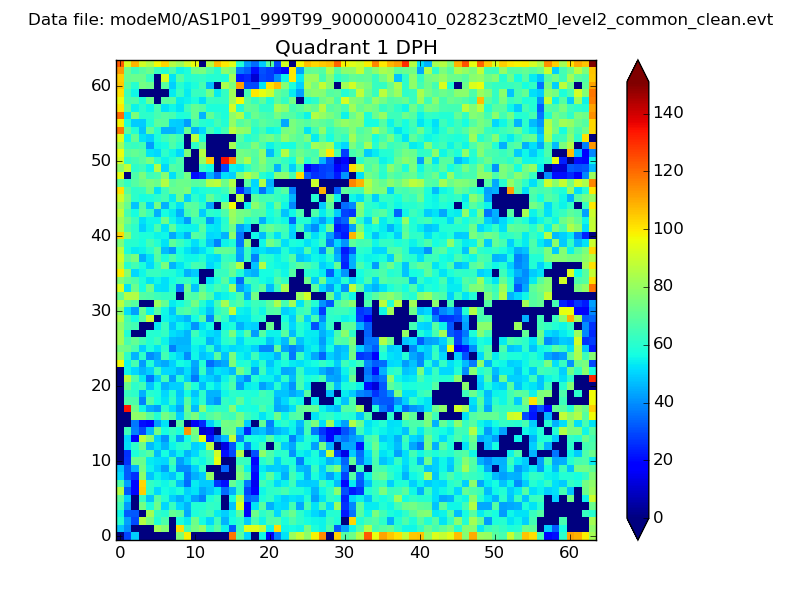 |
Quadrant B |
|---|---|---|---|
| Quadrant D | 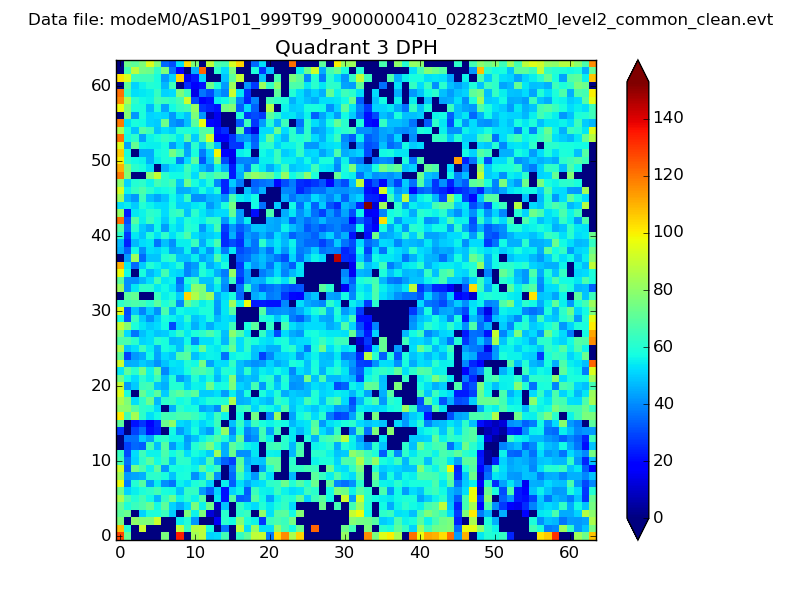 |
 |
Quadrant C |
| Plot type | Count rate plots | Images |
|---|---|---|
| Comparison with Poisson distribution Blue bars denote a histogram of data divided into 1 sec bins. Red curve is a Poisson curve with rate = median count rate of data. |
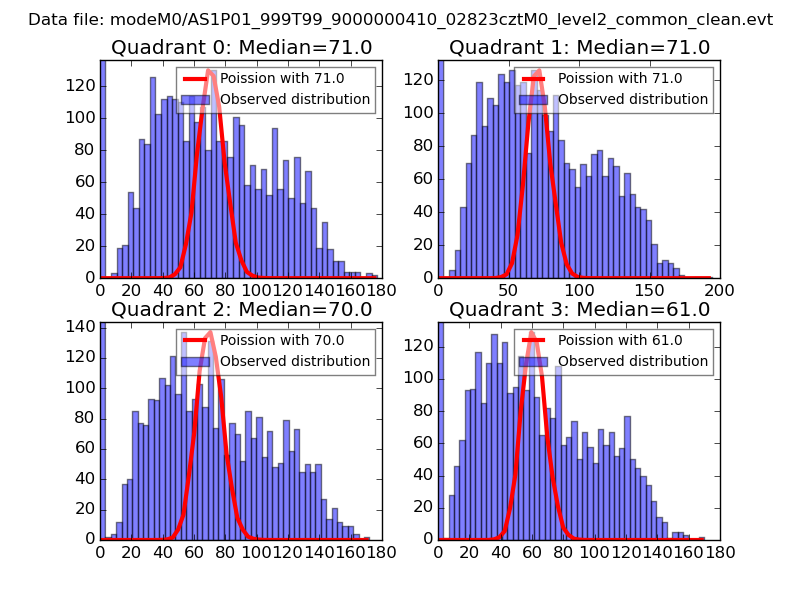 |
 |
| Quadrant-wise count rates Data is divided into 100 sec bins |
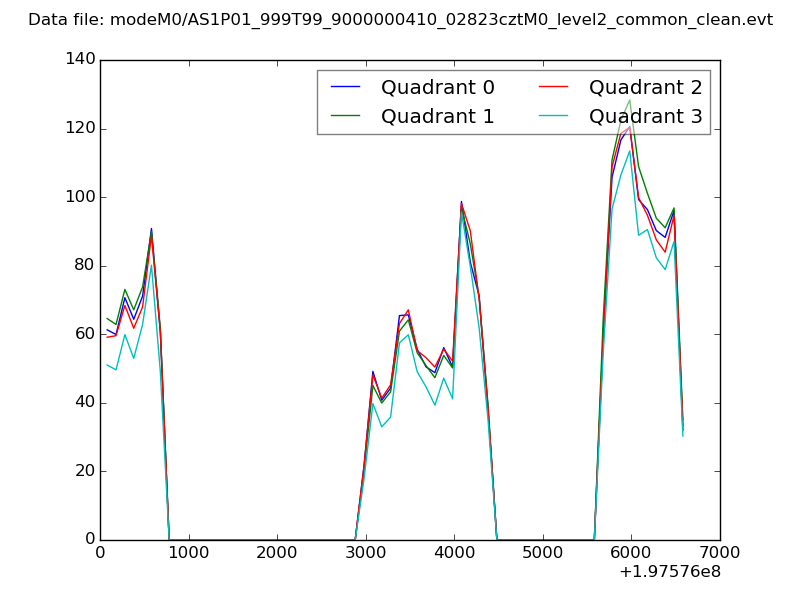 |
|
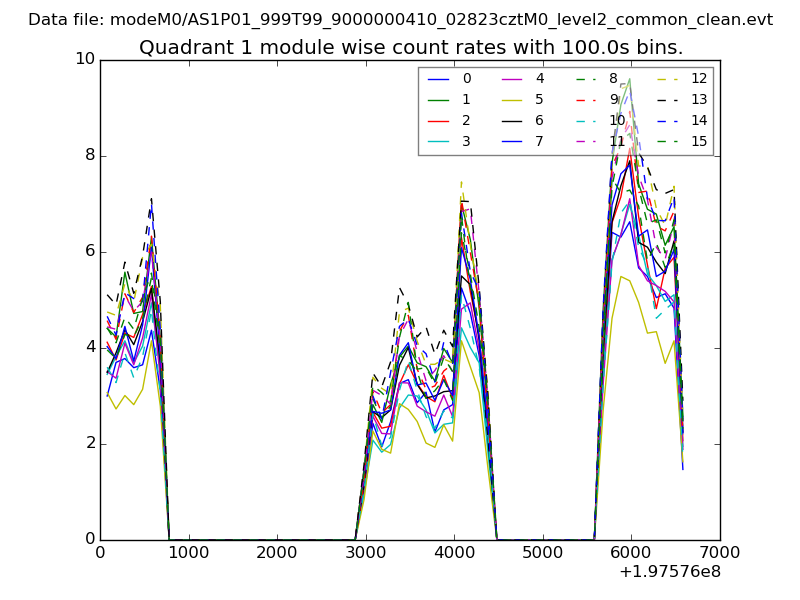
| Module-wise count rates for Quadrant A Data is divided into 100 sec bins |
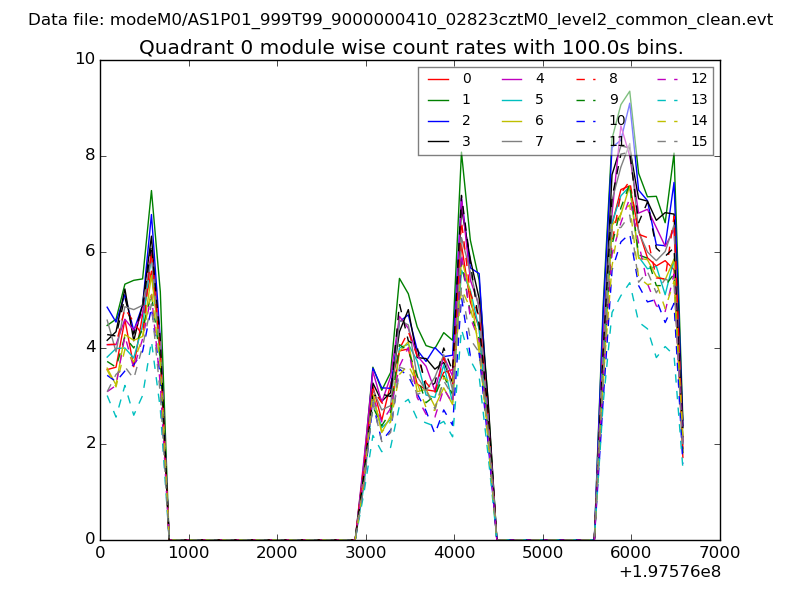 |
 |
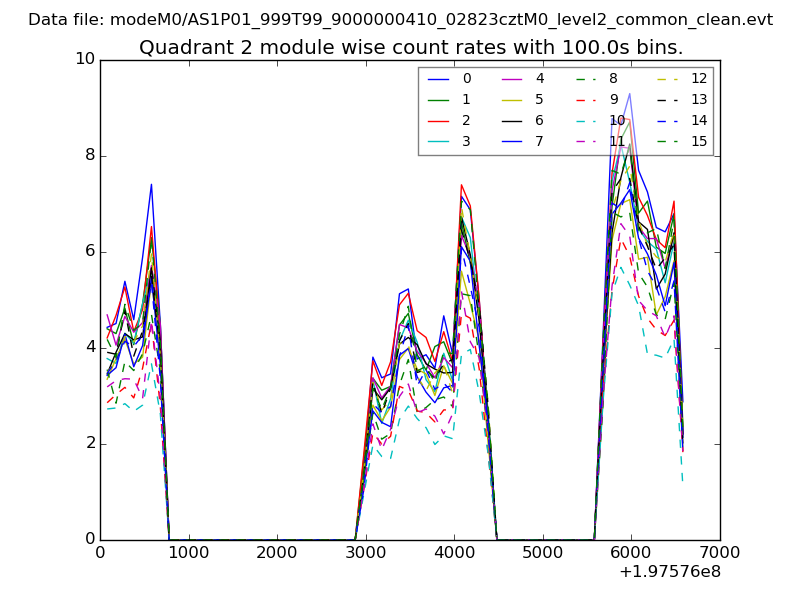
| Module-wise count rates for Quadrant B Data is divided into 100 sec bins |
 |
 |
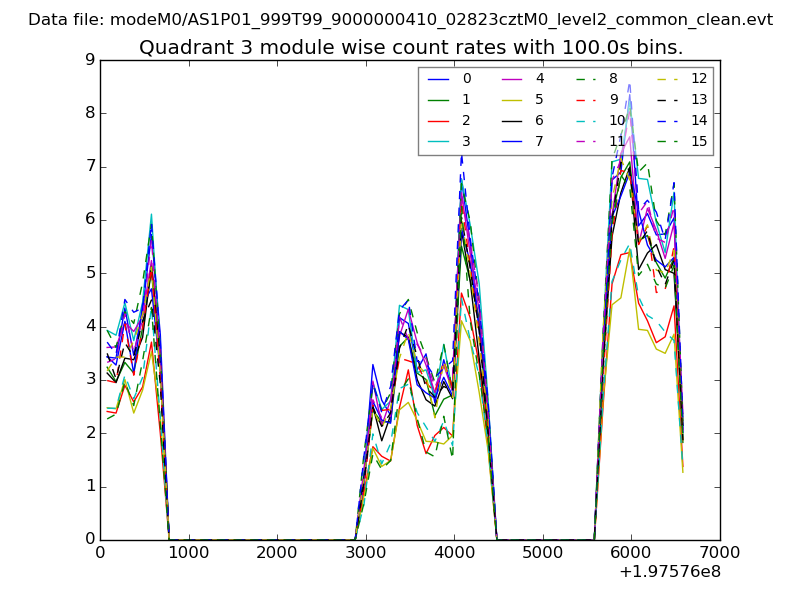
| Module-wise count rates for Quadrant C Data is divided into 100 sec bins |
 |
 |
| Module-wise count rates for Quadrant D Data is divided into 100 sec bins |
 |
 |
| Parameter | Plot |
|---|---|
| CZT HV Monitor | 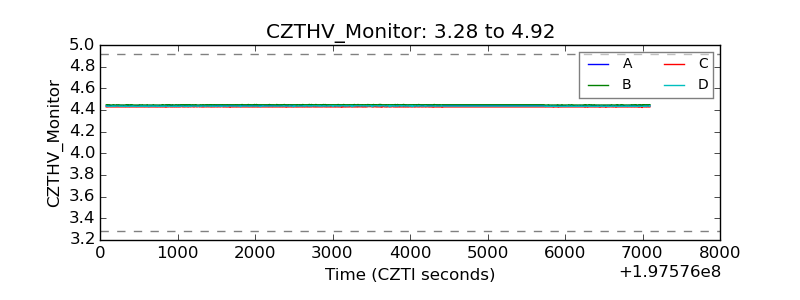 |
| D_VDD | 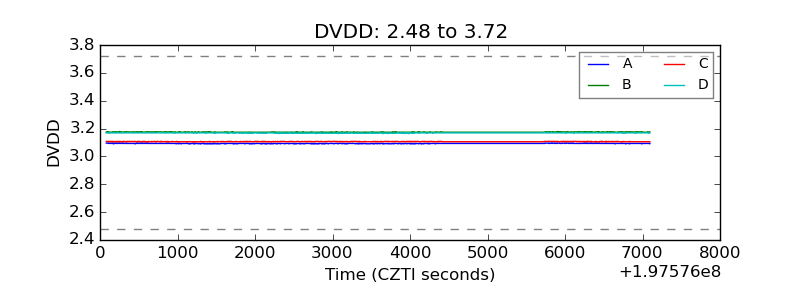 |
| Temperature 1 | 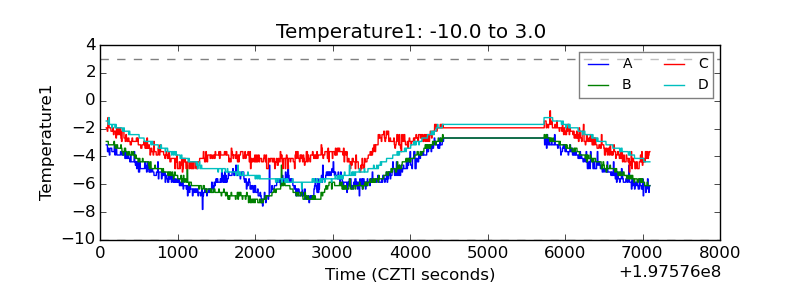 |
| Veto HV Monitor | 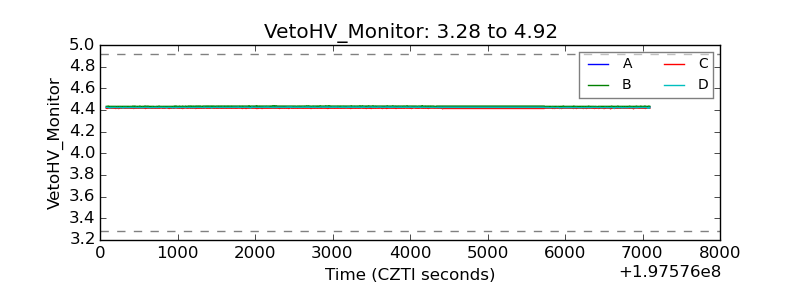 |
| Veto LLD | 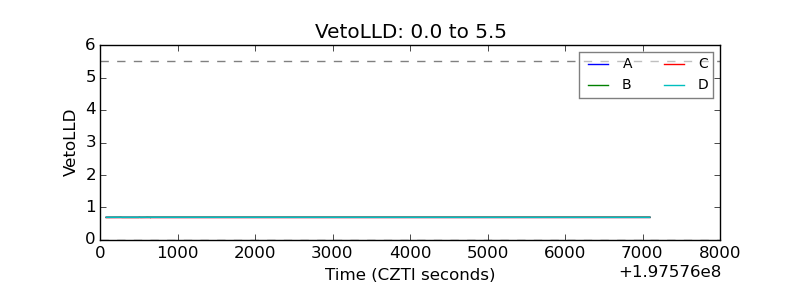 |
| Alpha Counter | 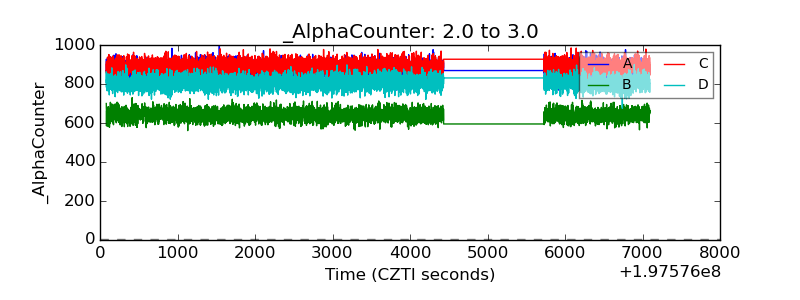 |
| _CPM_Rate | 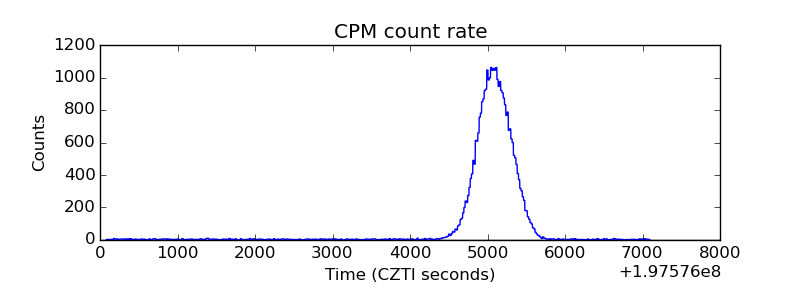 |
| CZT Counter | 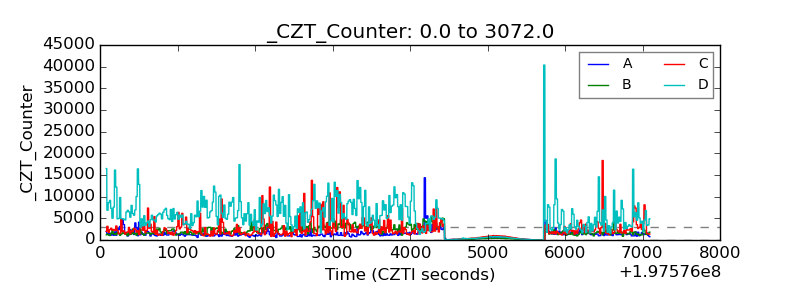 |
| +2.5 Volts monitor |  |
| +5 Volts monitor | 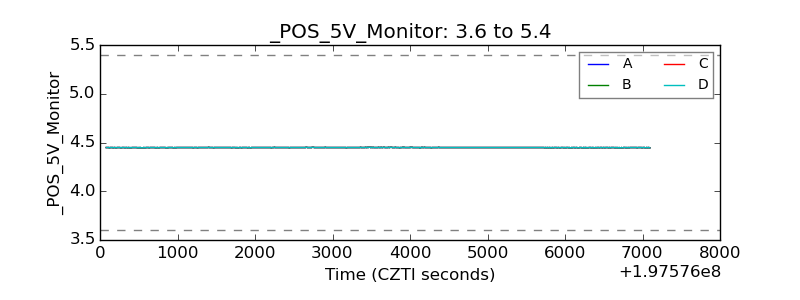 |
| Veto Counter | 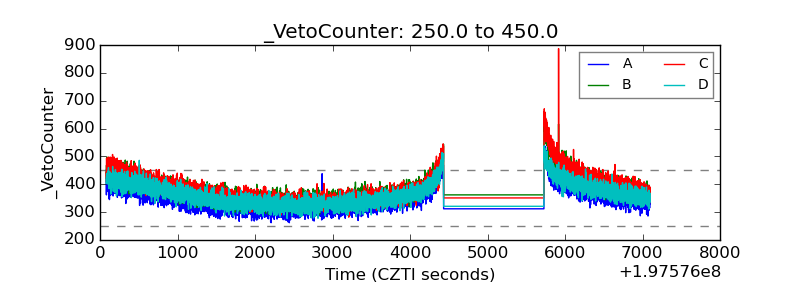 |