| Param | Original file | Final file |
|---|---|---|
| Filename | modeM0/AS1P01_999T99_9000000410_02824cztM0_level2.evt | modeM0/AS1P01_999T99_9000000410_02824cztM0_level2_quad_clean.evt |
| Size (bytes) | 1,684,728,000 | 55,465,920 |
| Size | 1.6 GB | 52.9 MB |
| Events in quadrant A | 8,421,268 | 355,410 |
| Events in quadrant B | 11,997,300 | 339,435 |
| Events in quadrant C | 12,777,090 | 316,715 |
| Events in quadrant D | 17,431,194 | 242,200 |
| Mode SS | |||
|---|---|---|---|
| Quadrant | BADHDUFLAG | Total packets | Discarded packets |
| A | 0 | 122 | 0 |
| B | 0 | 122 | 0 |
| C | 0 | 122 | 0 |
| D | 0 | 122 | 0 |
| Mode M9 | |||
|---|---|---|---|
| Quadrant | BADHDUFLAG | Total packets | Discarded packets |
| A | 0 | 12 | 0 |
| B | 0 | 12 | 0 |
| C | 0 | 12 | 0 |
| D | 0 | 12 | 0 |
| Mode M0 | |||
|---|---|---|---|
| Quadrant | BADHDUFLAG | Total packets | Discarded packets |
| A | 0 | 29306 | 2 |
| B | 0 | 40017 | 1 |
| C | 0 | 42438 | 1 |
| D | 0 | 56785 | 1 |
| Quadrant | Total seconds | Saturated seconds | Saturation percentage |
|---|---|---|---|
| A | 6069 | 36 | 0.593178% |
| B | 6069 | 1003 | 16.526611% |
| C | 6069 | 1502 | 24.748723% |
| D | 6069 | 4450 | 73.323447% |
Noise dominated data is calculated using 1-second bins in cleaned event files. If a bin has >2000 counts, and if more than 50% of those come from <1% of pixels, then it is considered to be noise-dominated and hence unusable.
| Quadrant | # 1 sec bins | Bins with >0 counts | Bins with >2000 counts | High rate bins dominated by noise | Noise dominated (total time) | Noise dominated (detector-on time) | Marked lightcurve |
|---|---|---|---|---|---|---|---|
| A | 7244 | 6070 | 504 | 504 | 6.96% | 8.30% | 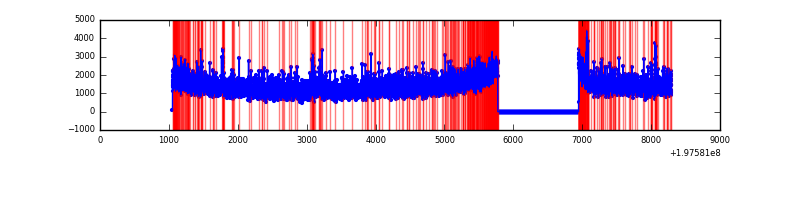 |
| B | 7244 | 6070 | 2411 | 2411 | 33.28% | 39.72% | 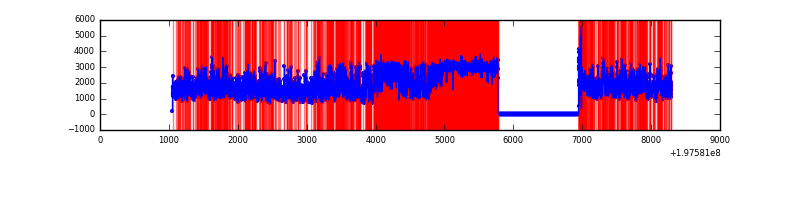 |
| C | 7244 | 6067 | 2894 | 2894 | 39.95% | 47.70% | 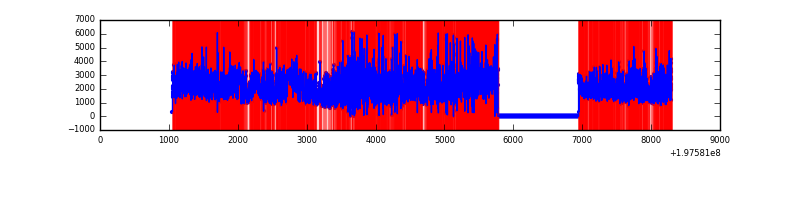 |
| D | 7244 | 6070 | 5555 | 5555 | 76.68% | 91.52% | 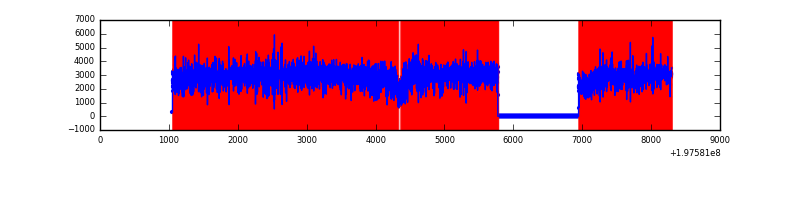 |
Top three noisy pixels from each quadrant. If the there are fewer than three noisy pixels in the level2.evt file, extra rows are filled as -1
| Pixel properties | Quadrant properties | ||||||
|---|---|---|---|---|---|---|---|
| Quadrant | DetID | PixID | Counts | Sigma | Mean | Median | Sigma |
| A | 0 | 13 | 207327 | 427.92 | 2084 | 2068 | 479.7 |
| A | 0 | 31 | 46881 | 93.42 | 2084 | 2068 | 479.7 |
| A | 0 | 128 | 41871 | 82.98 | 2084 | 2068 | 479.7 |
| B | 0 | 191 | 836917 | 1706.65 | 2107 | 2081 | 489.2 |
| B | 0 | 219 | 534627 | 1088.68 | 2107 | 2081 | 489.2 |
| B | 0 | 228 | 507655 | 1033.54 | 2107 | 2081 | 489.2 |
| C | 0 | 219 | 2332553 | 4354.27 | 1823 | 1879 | 535.3 |
| C | 1 | 16 | 1448322 | 2702.31 | 1823 | 1879 | 535.3 |
| C | 1 | 192 | 674402 | 1256.44 | 1823 | 1879 | 535.3 |
| D | 0 | 226 | 6575317 | 16022.73 | 1368 | 1381 | 410.3 |
| D | 1 | 31 | 4233630 | 10315.31 | 1368 | 1381 | 410.3 |
| D | 1 | 66 | 349870 | 849.38 | 1368 | 1381 | 410.3 |
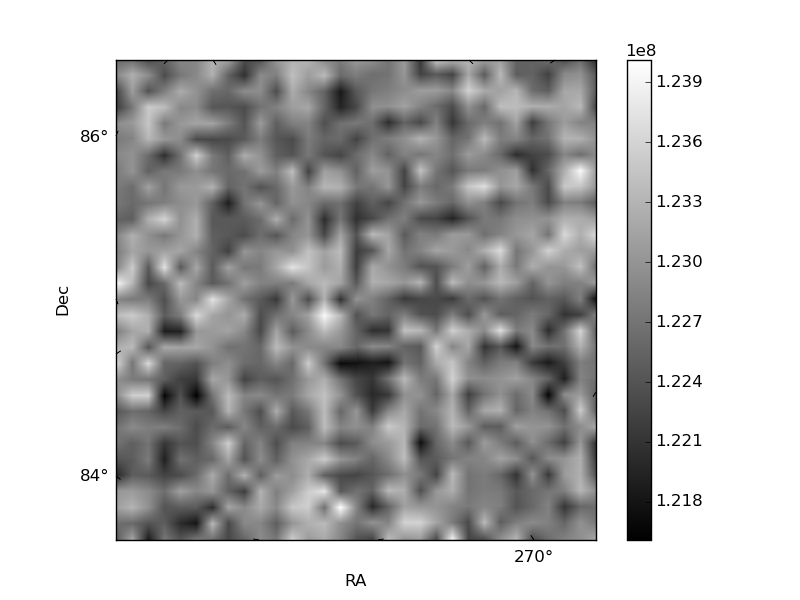
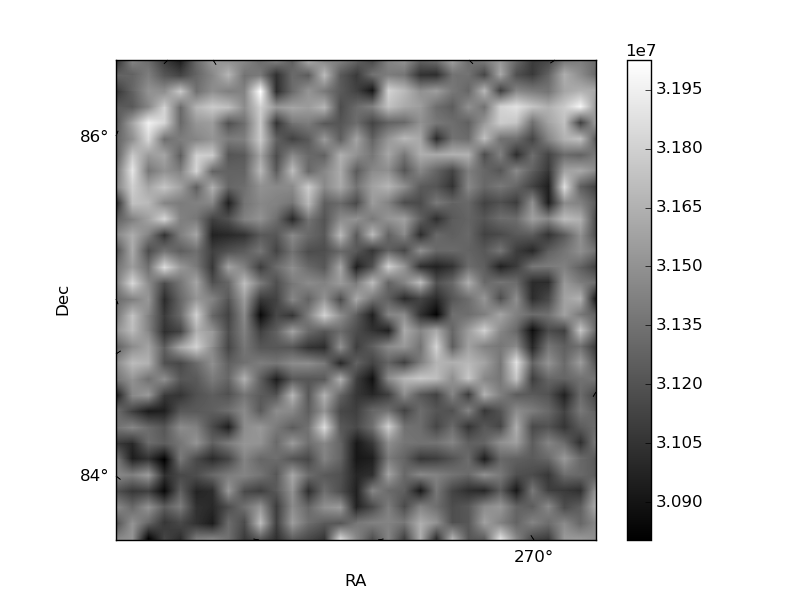
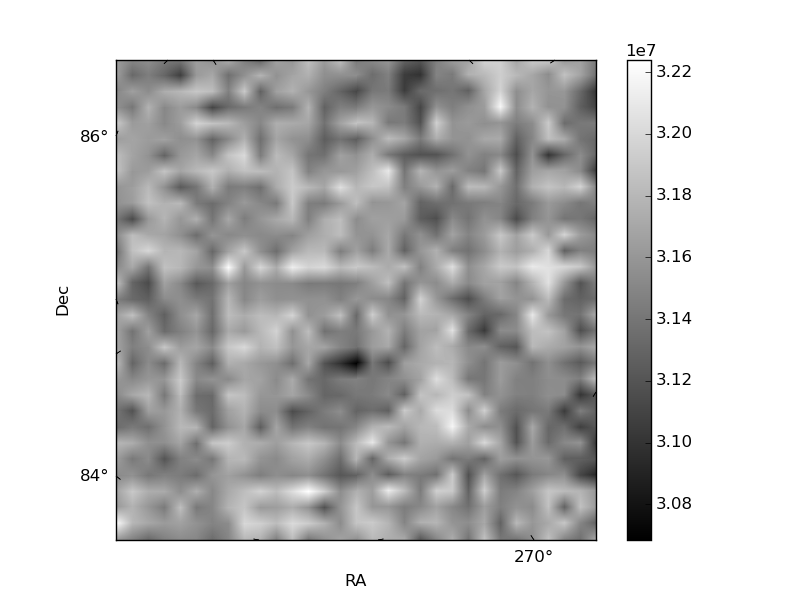
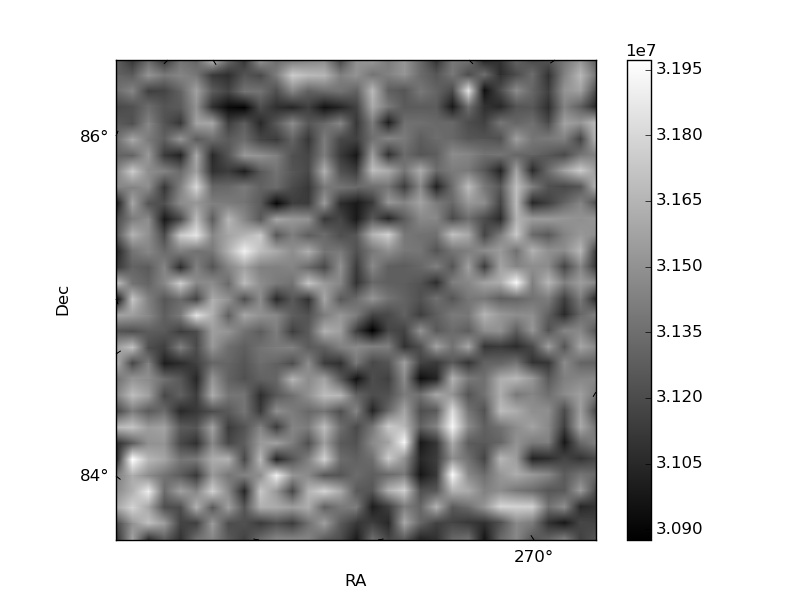
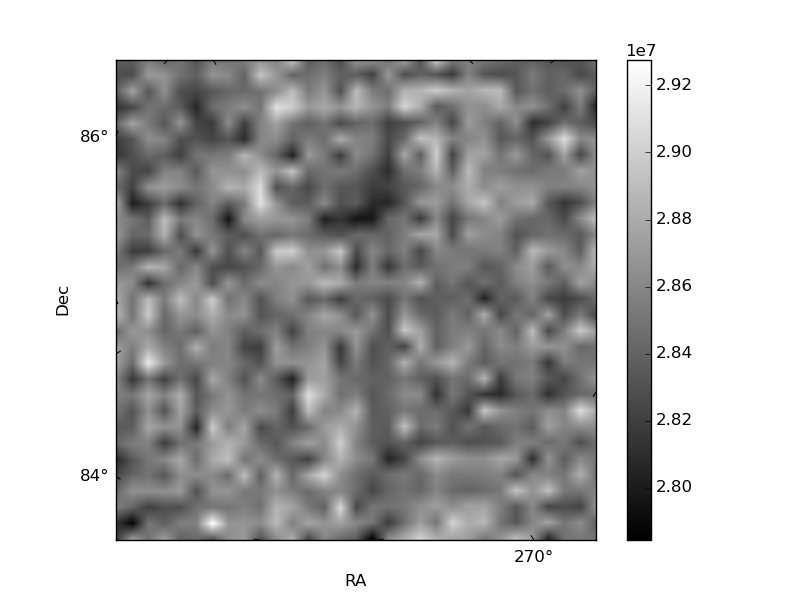
Histogram calculated using DETX and DETY for each event in the final _common_clean file
| Quadrant A | 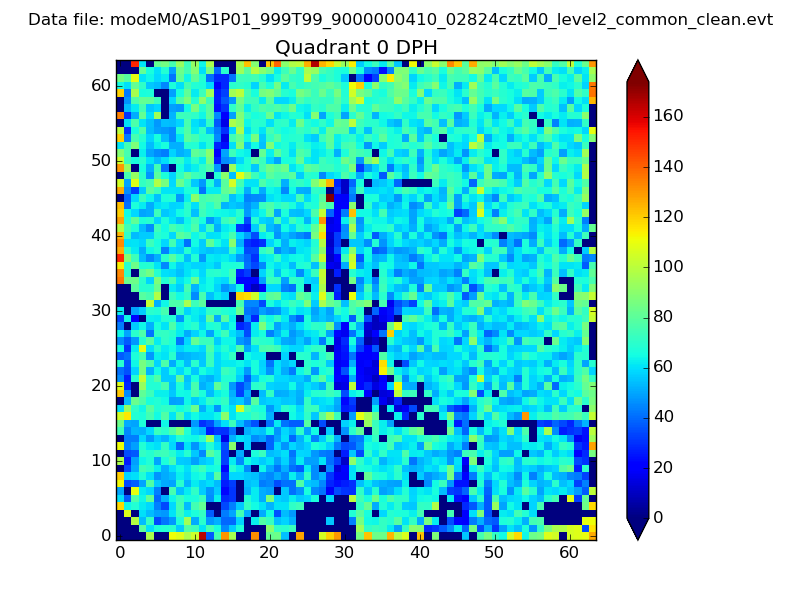 |
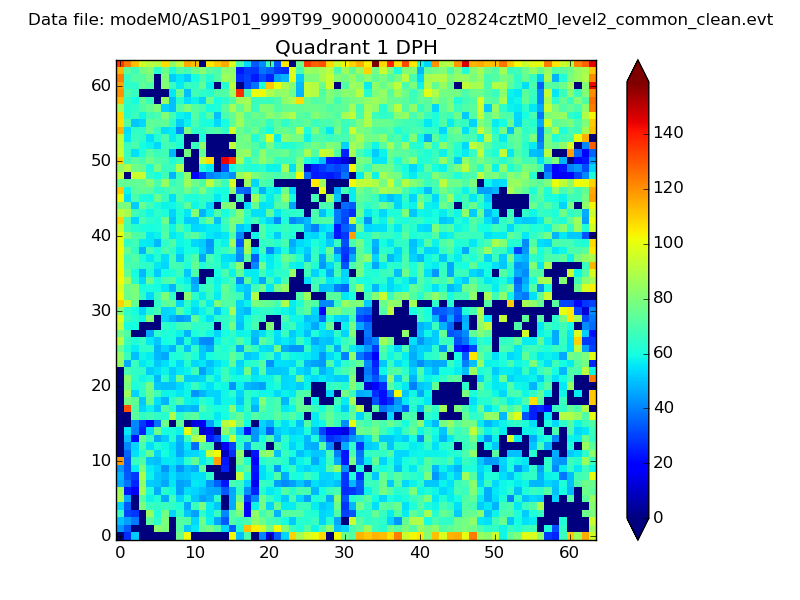 |
Quadrant B |
|---|---|---|---|
| Quadrant D | 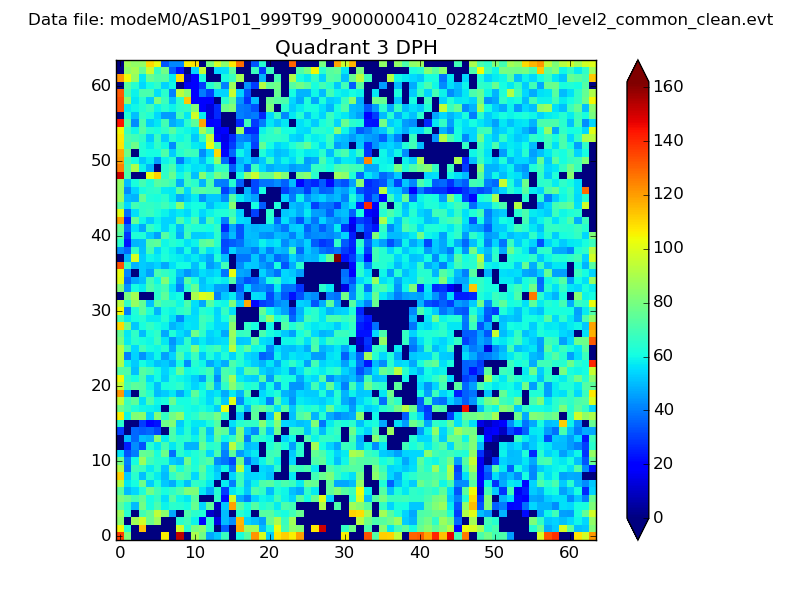 |
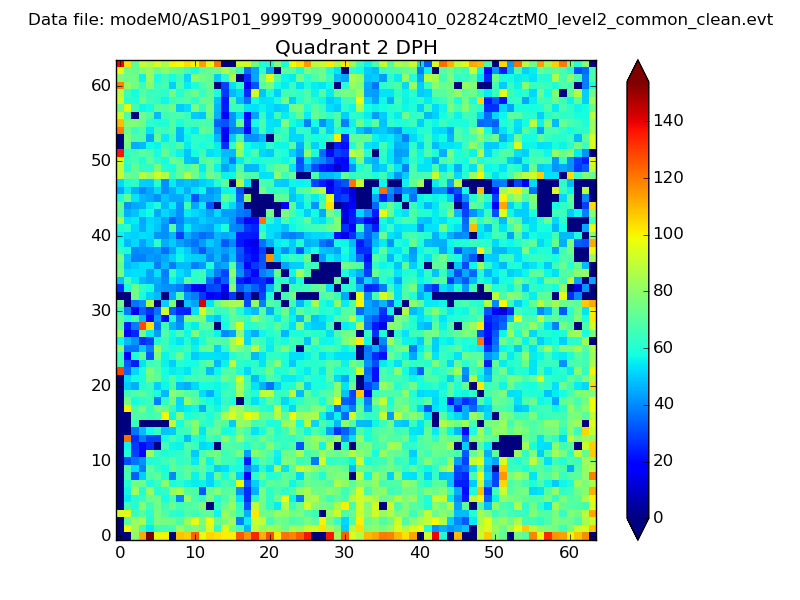 |
Quadrant C |
| Plot type | Count rate plots | Images |
|---|---|---|
| Comparison with Poisson distribution Blue bars denote a histogram of data divided into 1 sec bins. Red curve is a Poisson curve with rate = median count rate of data. |
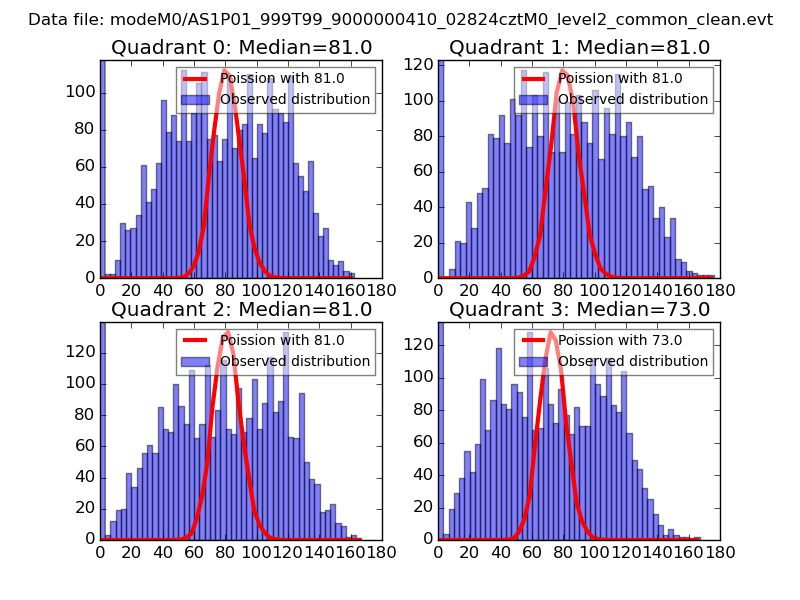 |
 |
| Quadrant-wise count rates Data is divided into 100 sec bins |
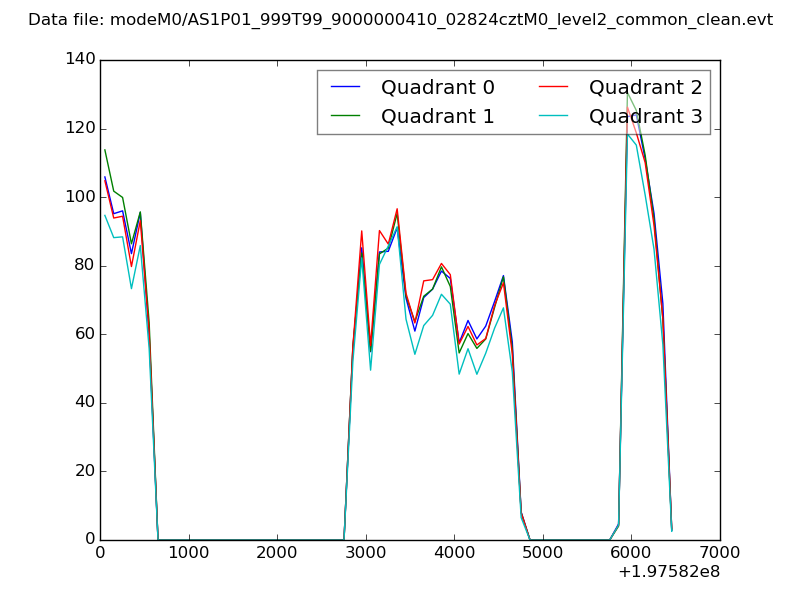 |
|
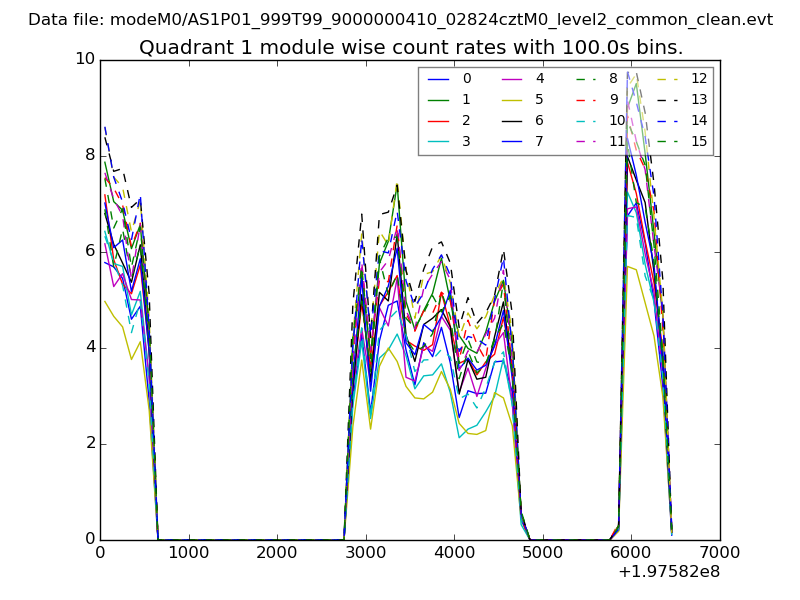
| Module-wise count rates for Quadrant A Data is divided into 100 sec bins |
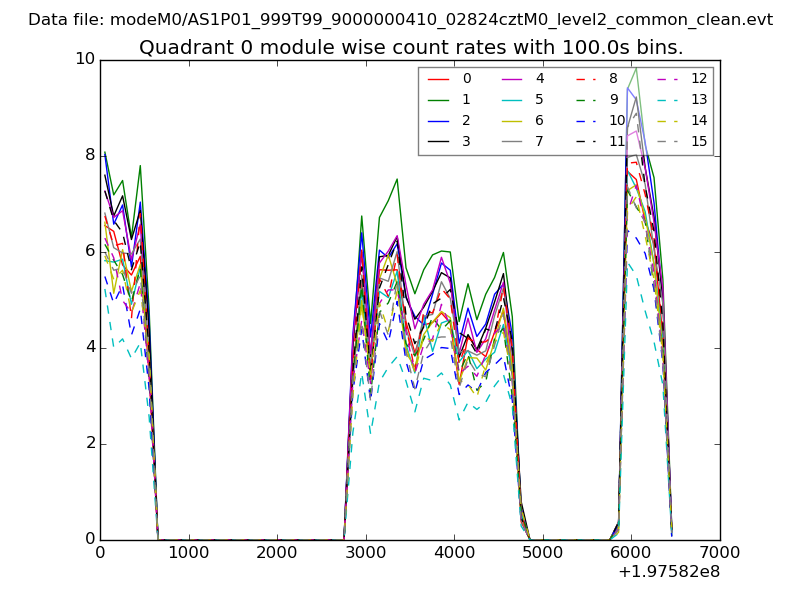 |
 |
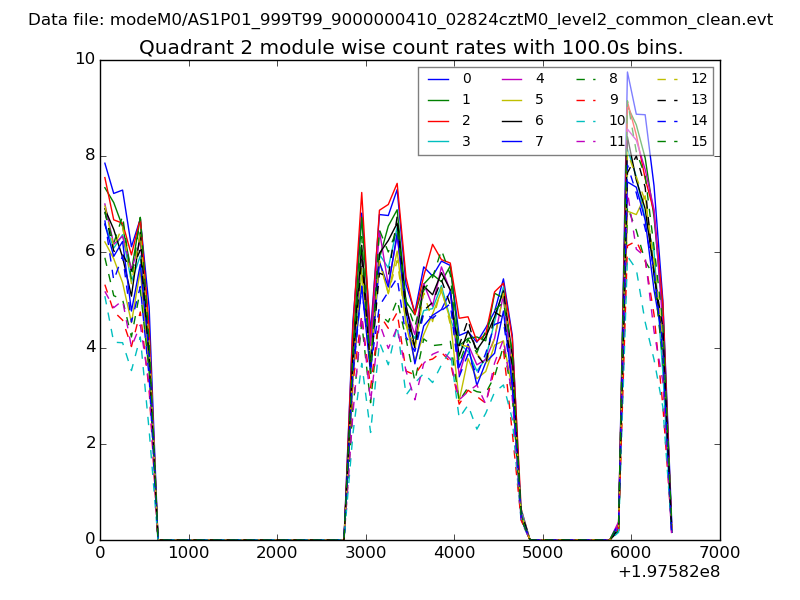
| Module-wise count rates for Quadrant B Data is divided into 100 sec bins |
 |
 |
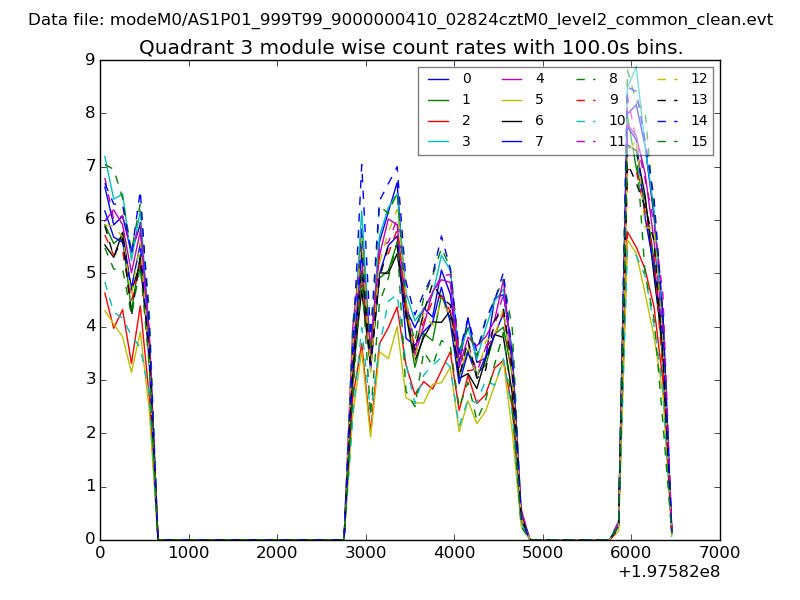
| Module-wise count rates for Quadrant C Data is divided into 100 sec bins |
 |
 |
| Module-wise count rates for Quadrant D Data is divided into 100 sec bins |
 |
 |
| Parameter | Plot |
|---|---|
| CZT HV Monitor | 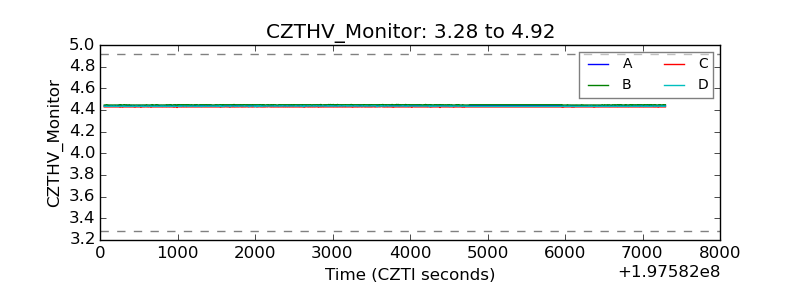 |
| D_VDD | 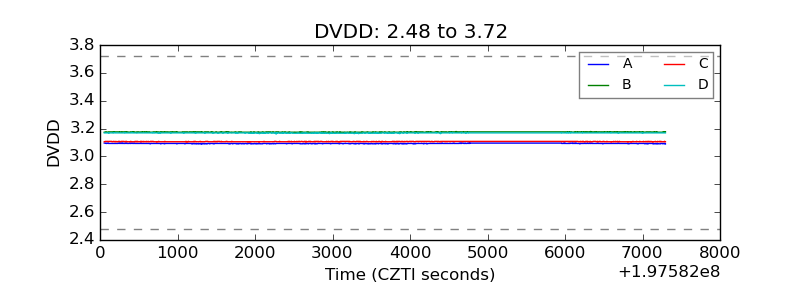 |
| Temperature 1 | 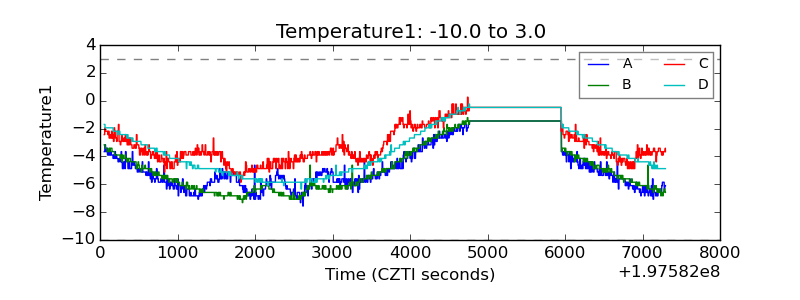 |
| Veto HV Monitor | 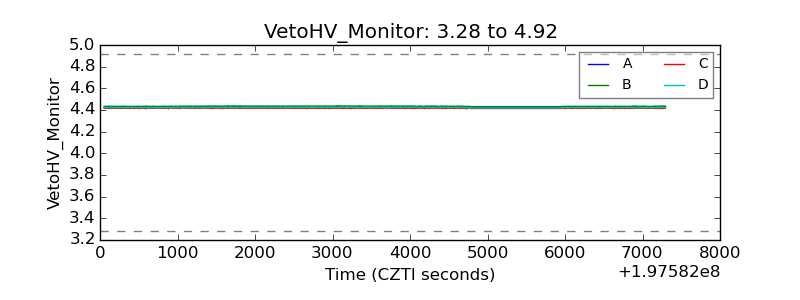 |
| Veto LLD | 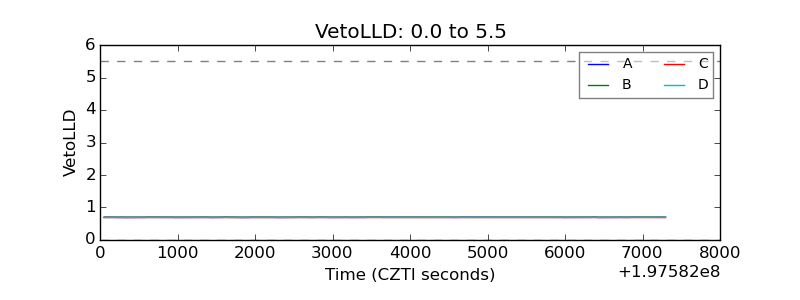 |
| Alpha Counter | 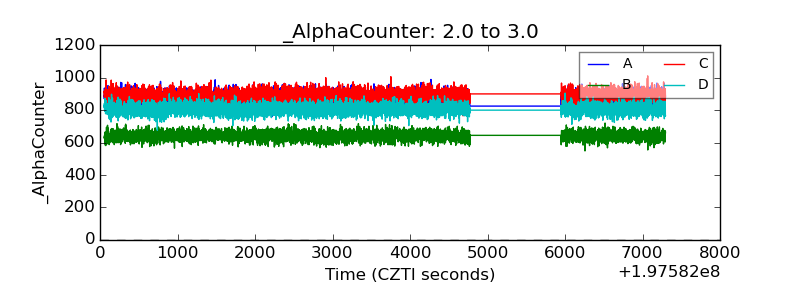 |
| _CPM_Rate | 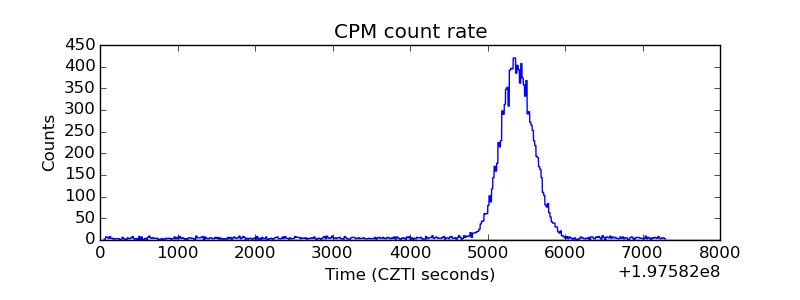 |
| CZT Counter | 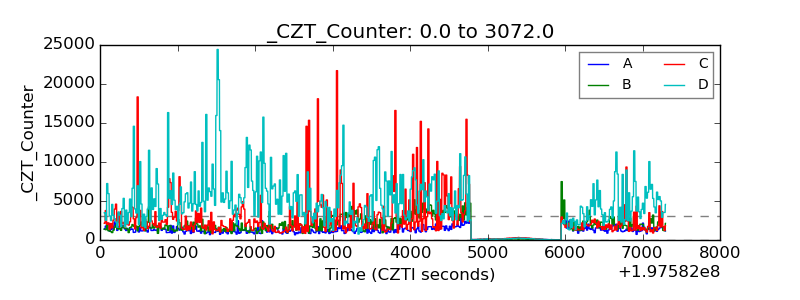 |
| +2.5 Volts monitor |  |
| +5 Volts monitor |  |
| Veto Counter | 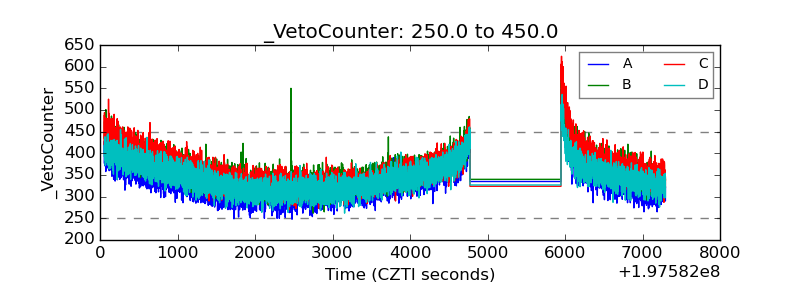 |