| Param | Original file | Final file |
|---|---|---|
| Filename | modeM0/AS1P01_999T99_9000000410_02825cztM0_level2.evt | modeM0/AS1P01_999T99_9000000410_02825cztM0_level2_quad_clean.evt |
| Size (bytes) | 1,704,781,440 | 49,579,200 |
| Size | 1.6 GB | 47.3 MB |
| Events in quadrant A | 8,549,682 | 315,401 |
| Events in quadrant B | 12,475,462 | 307,724 |
| Events in quadrant C | 12,935,088 | 253,007 |
| Events in quadrant D | 17,274,280 | 199,415 |
| Mode SS | |||
|---|---|---|---|
| Quadrant | BADHDUFLAG | Total packets | Discarded packets |
| A | 0 | 124 | 0 |
| B | 0 | 124 | 0 |
| C | 0 | 124 | 0 |
| D | 0 | 124 | 0 |
| Mode M9 | |||
|---|---|---|---|
| Quadrant | BADHDUFLAG | Total packets | Discarded packets |
| A | 0 | 8 | 0 |
| B | 0 | 8 | 0 |
| C | 0 | 8 | 0 |
| D | 0 | 8 | 0 |
| Mode M0 | |||
|---|---|---|---|
| Quadrant | BADHDUFLAG | Total packets | Discarded packets |
| A | 0 | 29698 | 2 |
| B | 0 | 41411 | 1 |
| C | 0 | 42989 | 1 |
| D | 0 | 56295 | 1 |
| Quadrant | Total seconds | Saturated seconds | Saturation percentage |
|---|---|---|---|
| A | 6062 | 31 | 0.511382% |
| B | 6062 | 801 | 13.213461% |
| C | 6062 | 1890 | 31.177829% |
| D | 6062 | 4383 | 72.302870% |
Noise dominated data is calculated using 1-second bins in cleaned event files. If a bin has >2000 counts, and if more than 50% of those come from <1% of pixels, then it is considered to be noise-dominated and hence unusable.
| Quadrant | # 1 sec bins | Bins with >0 counts | Bins with >2000 counts | High rate bins dominated by noise | Noise dominated (total time) | Noise dominated (detector-on time) | Marked lightcurve |
|---|---|---|---|---|---|---|---|
| A | 6907 | 6063 | 536 | 536 | 7.76% | 8.84% |  |
| B | 6907 | 6063 | 2864 | 2864 | 41.47% | 47.24% |  |
| C | 6907 | 6063 | 2922 | 2922 | 42.30% | 48.19% |  |
| D | 6907 | 6063 | 5467 | 5467 | 79.15% | 90.17% | 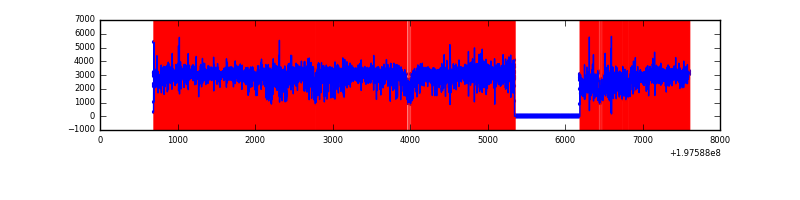 |
Top three noisy pixels from each quadrant. If the there are fewer than three noisy pixels in the level2.evt file, extra rows are filled as -1
| Pixel properties | Quadrant properties | ||||||
|---|---|---|---|---|---|---|---|
| Quadrant | DetID | PixID | Counts | Sigma | Mean | Median | Sigma |
| A | 0 | 13 | 220202 | 453.89 | 2082 | 2065 | 480.6 |
| A | 0 | 31 | 70224 | 141.82 | 2082 | 2065 | 480.6 |
| A | 0 | 50 | 55321 | 110.81 | 2082 | 2065 | 480.6 |
| B | 0 | 182 | 789831 | 1593.99 | 2129 | 2109 | 494.2 |
| B | 0 | 219 | 769474 | 1552.79 | 2129 | 2109 | 494.2 |
| B | 1 | 158 | 375699 | 755.97 | 2129 | 2109 | 494.2 |
| C | 0 | 219 | 3373090 | 6724.68 | 1699 | 1752 | 501.3 |
| C | 1 | 16 | 1400770 | 2790.57 | 1699 | 1752 | 501.3 |
| C | 7 | 159 | 996430 | 1984.05 | 1699 | 1752 | 501.3 |
| D | 0 | 226 | 6736975 | 16427.7 | 1371 | 1390 | 410.0 |
| D | 1 | 15 | 4106740 | 10012.71 | 1371 | 1390 | 410.0 |
| D | 1 | 31 | 359721 | 873.95 | 1371 | 1390 | 410.0 |
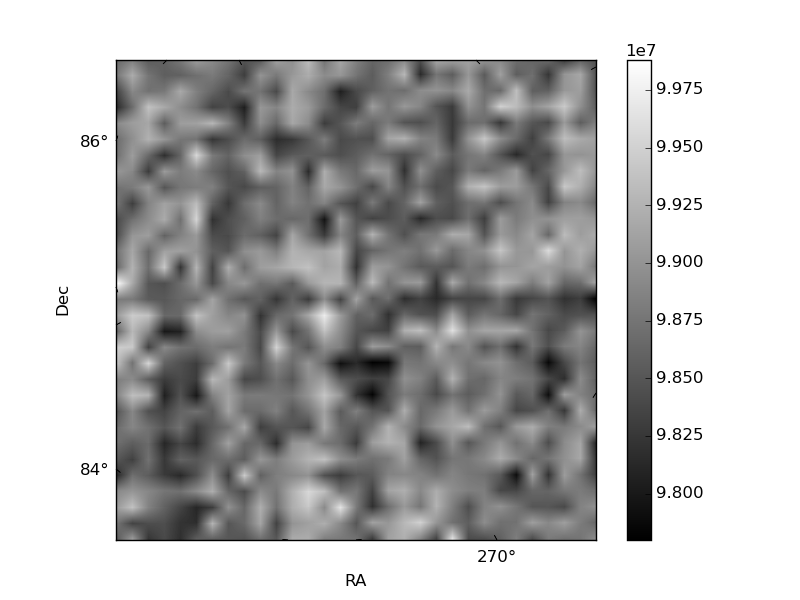
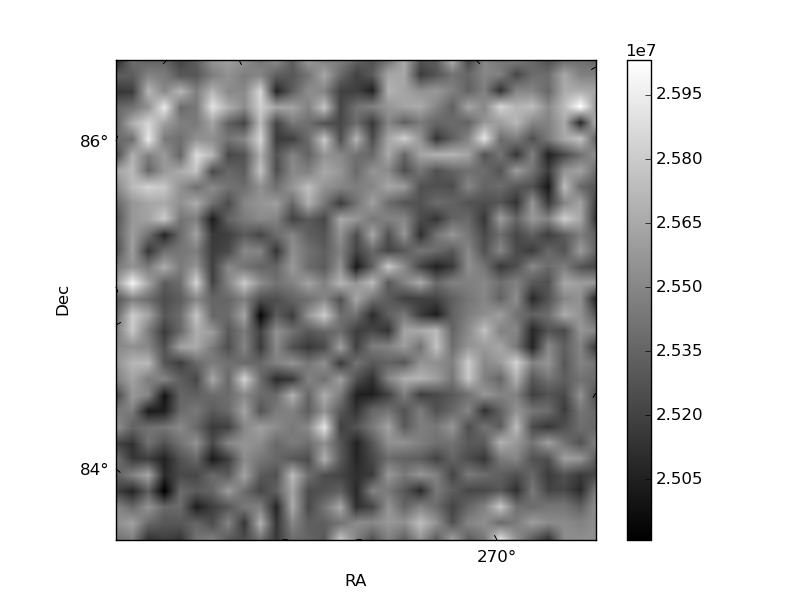
Histogram calculated using DETX and DETY for each event in the final _common_clean file
| Quadrant A | 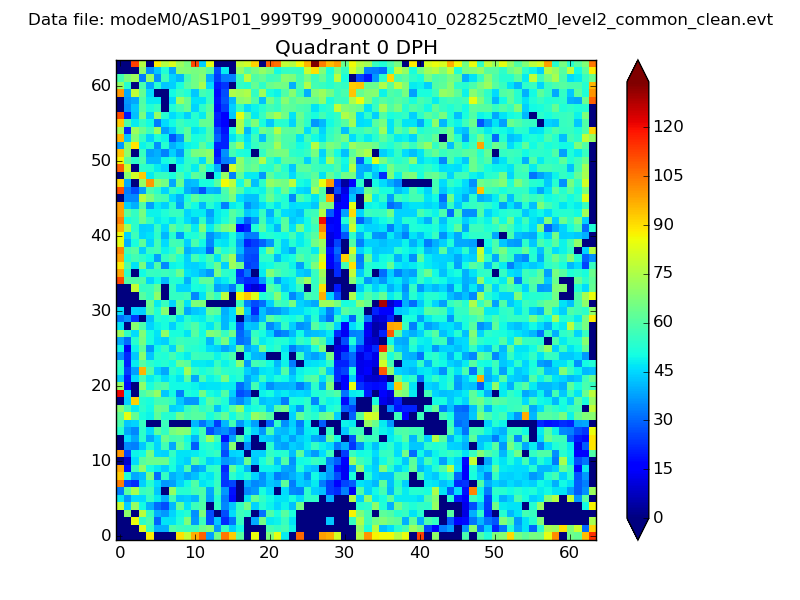 |
 |
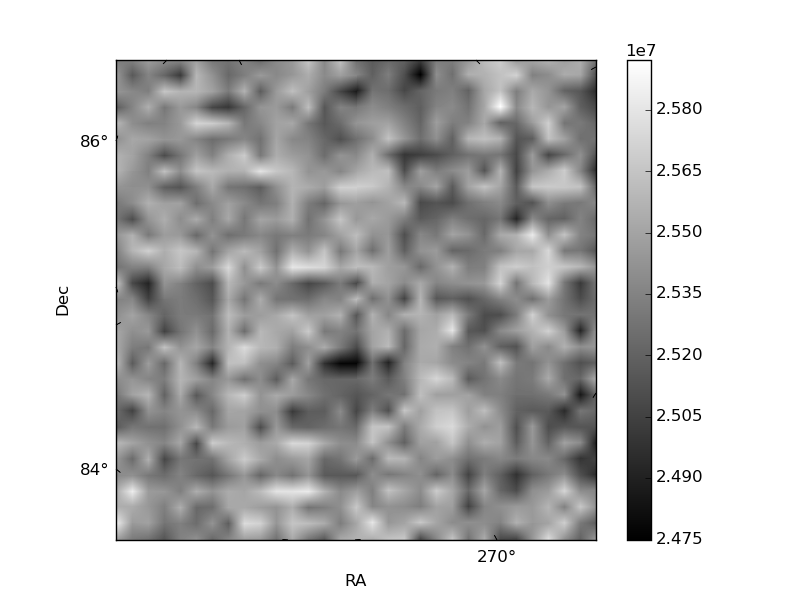
Quadrant B |
|---|---|---|---|
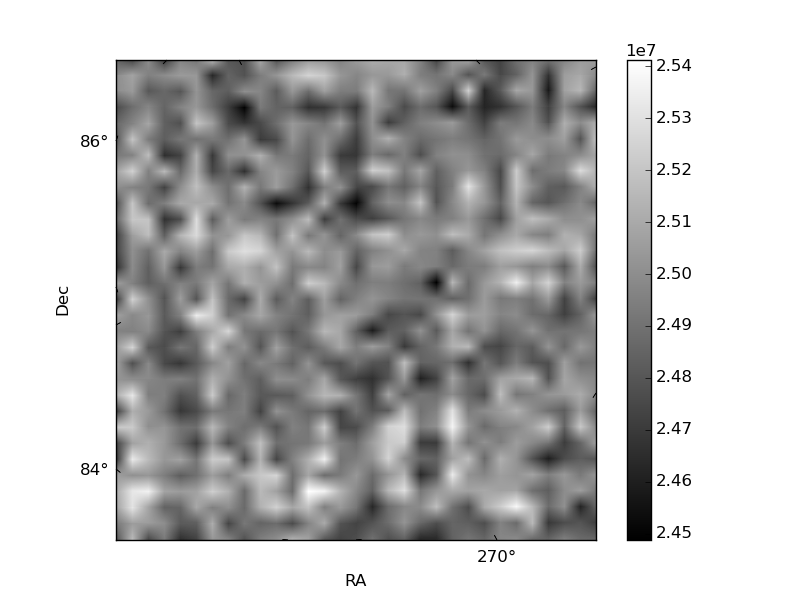
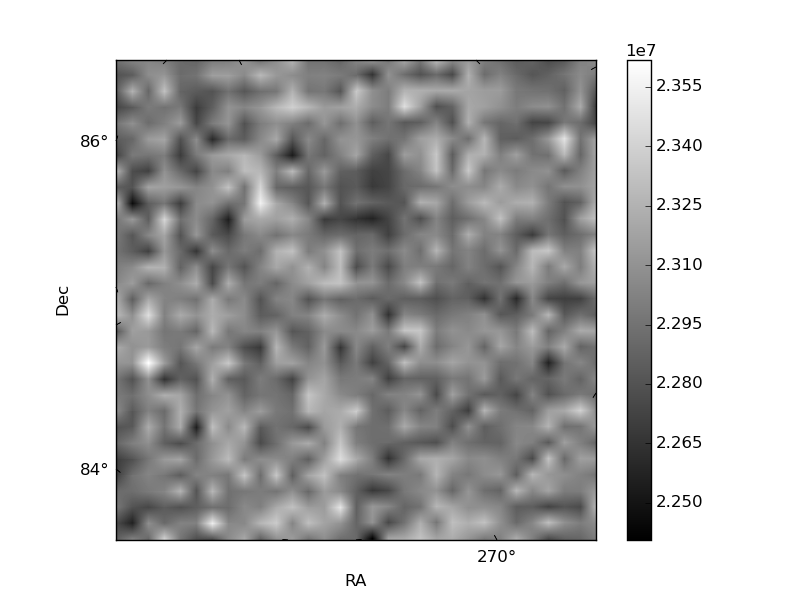
| Quadrant D | 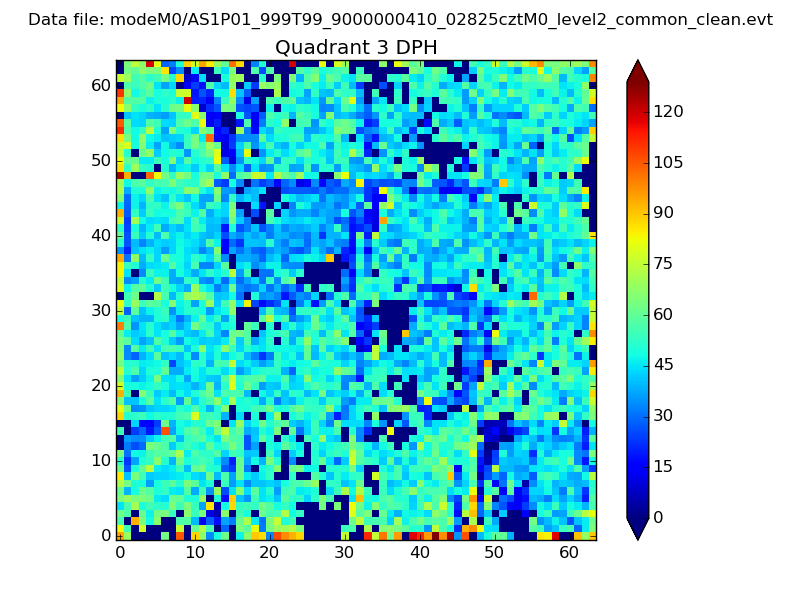 |
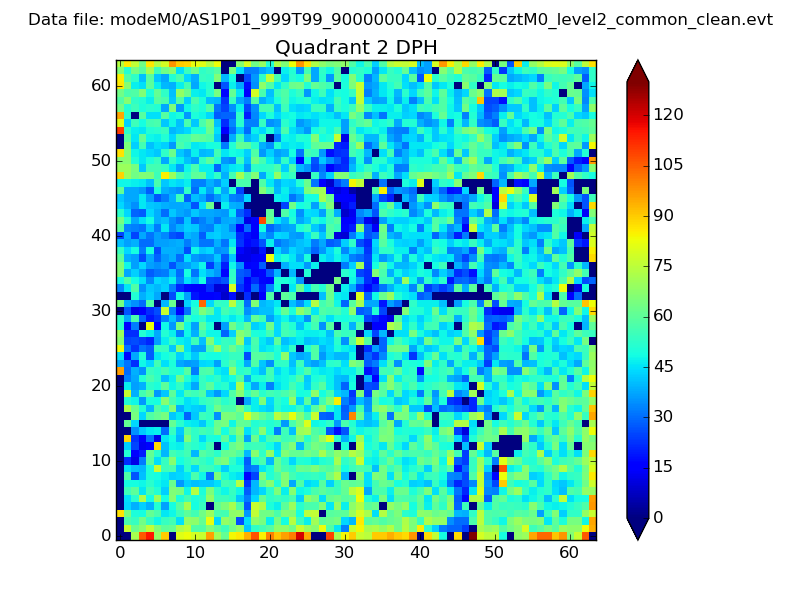 |
Quadrant C |
| Plot type | Count rate plots | Images |
|---|---|---|
| Comparison with Poisson distribution Blue bars denote a histogram of data divided into 1 sec bins. Red curve is a Poisson curve with rate = median count rate of data. |
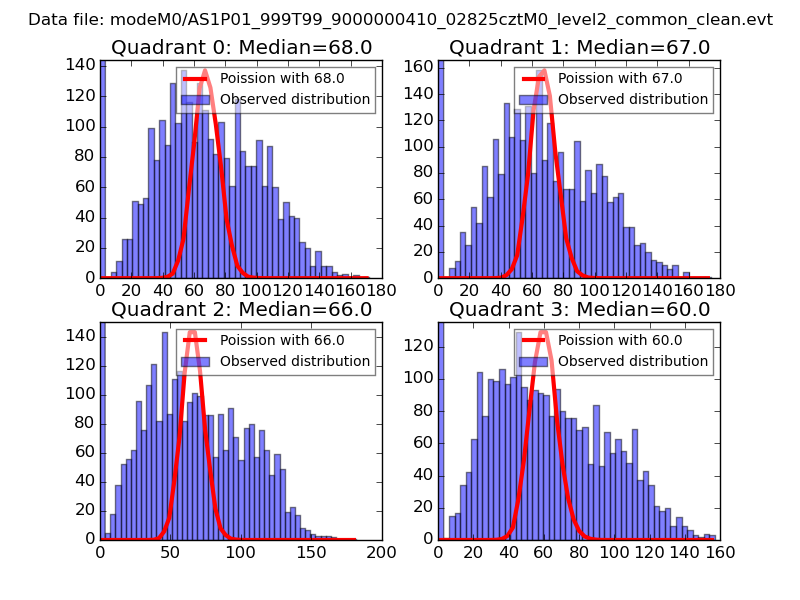 |
 |
| Quadrant-wise count rates Data is divided into 100 sec bins |
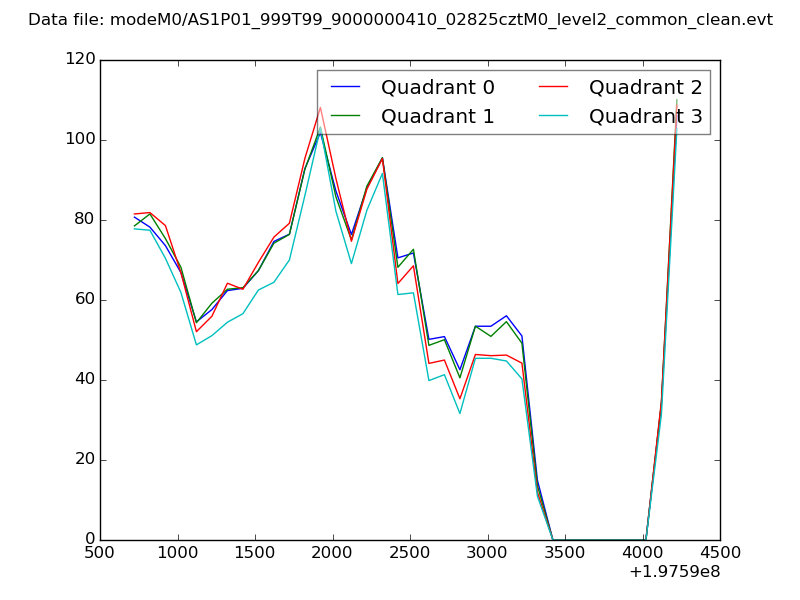 |
|
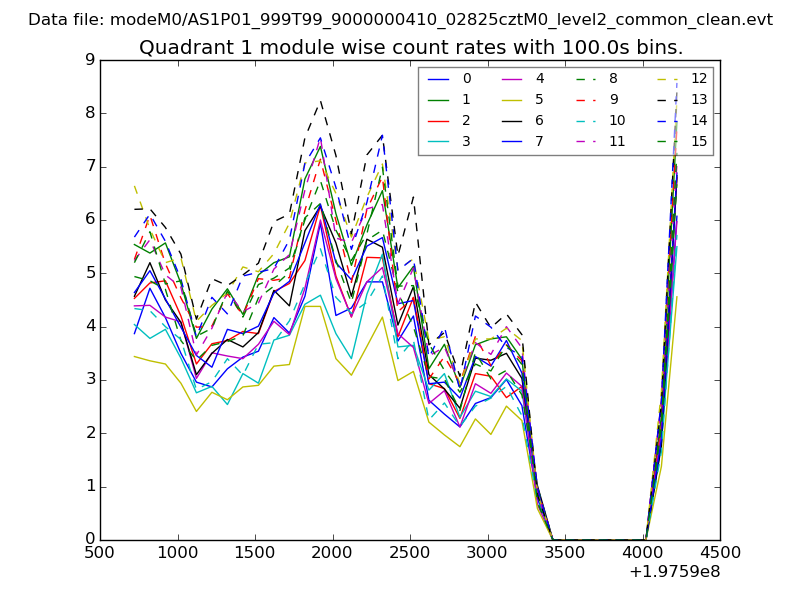
| Module-wise count rates for Quadrant A Data is divided into 100 sec bins |
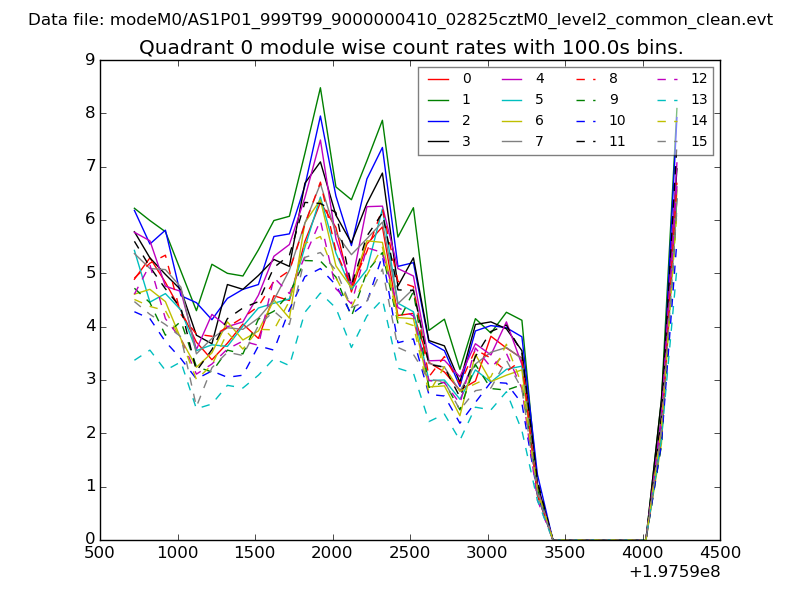 |
 |
| Module-wise count rates for Quadrant B Data is divided into 100 sec bins |
 |
 |
| Module-wise count rates for Quadrant C Data is divided into 100 sec bins |
 |
 |
| Module-wise count rates for Quadrant D Data is divided into 100 sec bins |
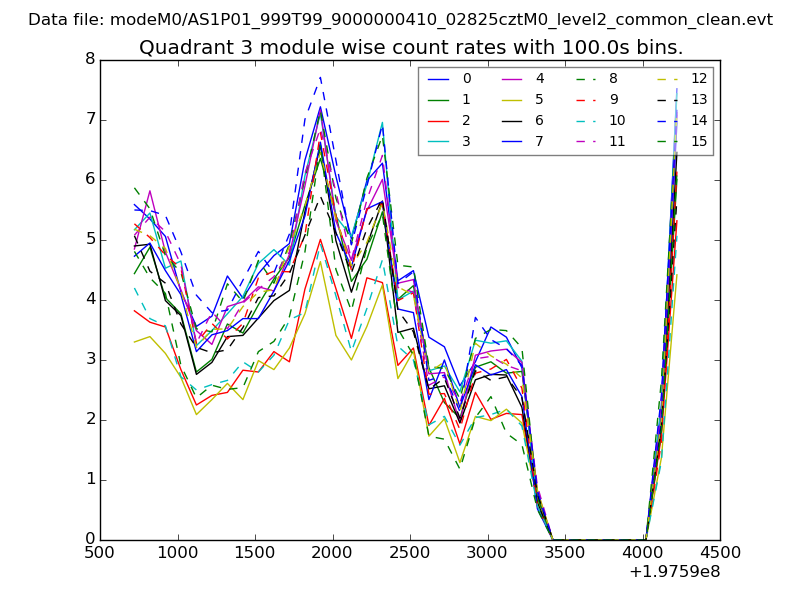 |
 |
| Parameter | Plot |
|---|---|
| CZT HV Monitor | 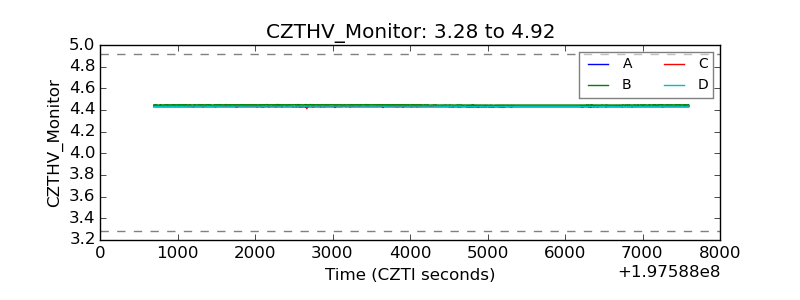 |
| D_VDD | 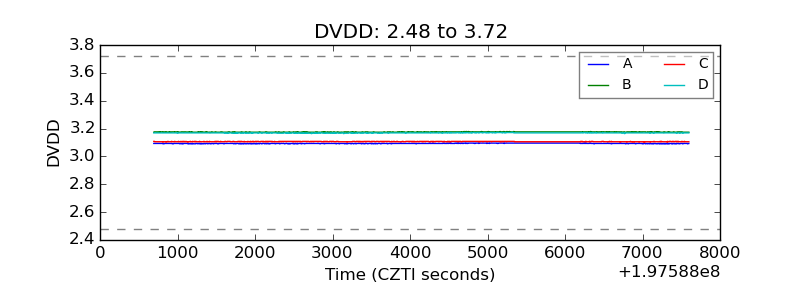 |
| Temperature 1 |  |
| Veto HV Monitor | 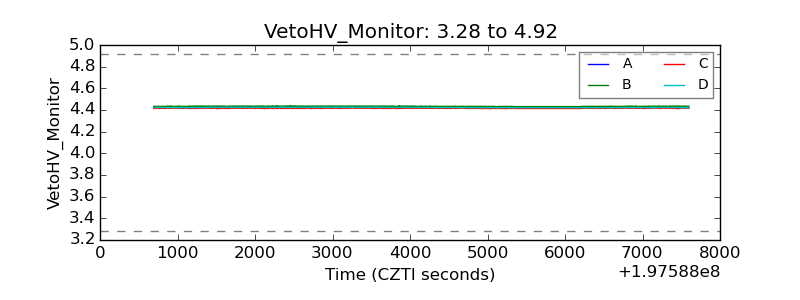 |
| Veto LLD | 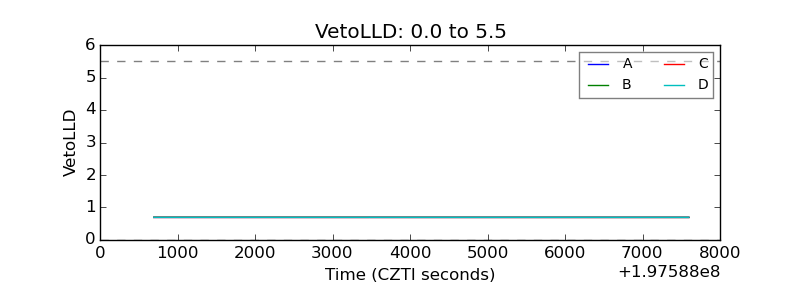 |
| Alpha Counter | 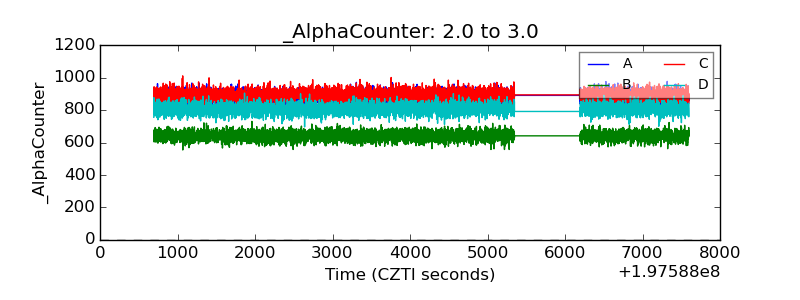 |
| _CPM_Rate | 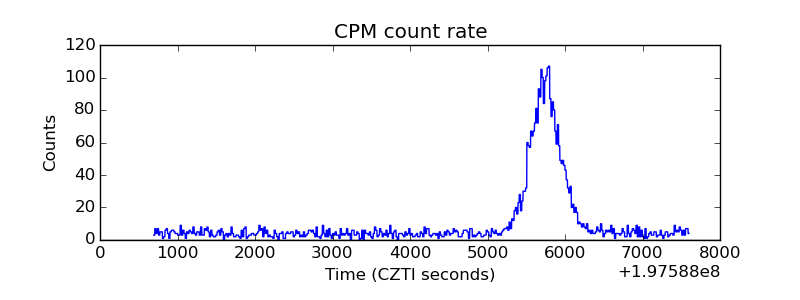 |
| CZT Counter | 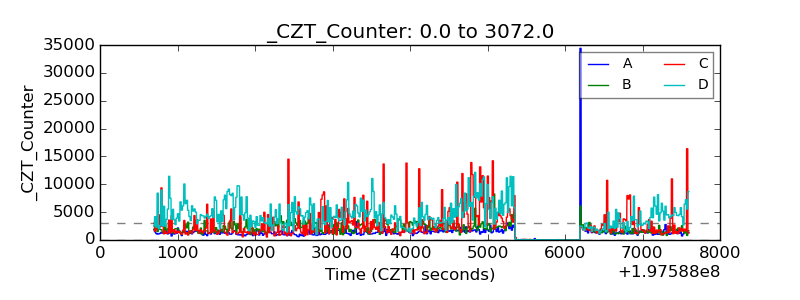 |
| +2.5 Volts monitor |  |
| +5 Volts monitor |  |
| Veto Counter | 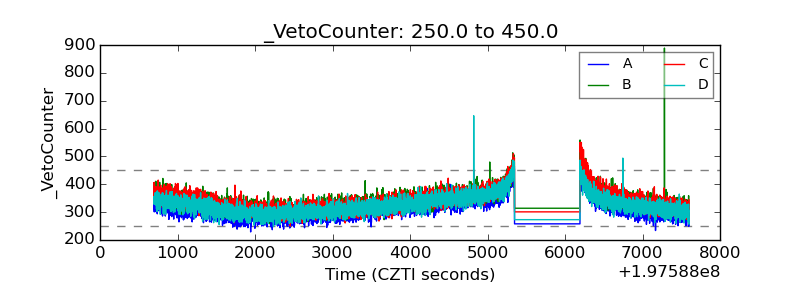 |