| Param | Original file | Final file |
|---|---|---|
| Filename | modeM0/AS1P01_999T99_9000000410_02827cztM0_level2.evt | modeM0/AS1P01_999T99_9000000410_02827cztM0_level2_quad_clean.evt |
| Size (bytes) | 1,995,655,680 | 62,844,480 |
| Size | 1.9 GB | 59.9 MB |
| Events in quadrant A | 10,308,367 | 405,531 |
| Events in quadrant B | 14,696,936 | 378,080 |
| Events in quadrant C | 18,449,824 | 246,526 |
| Events in quadrant D | 16,512,544 | 366,200 |
| Mode SS | |||
|---|---|---|---|
| Quadrant | BADHDUFLAG | Total packets | Discarded packets |
| A | 0 | 146 | 0 |
| B | 0 | 146 | 0 |
| C | 0 | 146 | 0 |
| D | 0 | 146 | 0 |
| Mode M9 | |||
|---|---|---|---|
| Quadrant | BADHDUFLAG | Total packets | Discarded packets |
| A | 0 | 1 | 0 |
| B | 0 | 1 | 0 |
| C | 0 | 1 | 0 |
| D | 0 | 1 | 0 |
| Mode M0 | |||
|---|---|---|---|
| Quadrant | BADHDUFLAG | Total packets | Discarded packets |
| A | 0 | 35715 | 2 |
| B | 0 | 48846 | 1 |
| C | 0 | 60549 | 1 |
| D | 0 | 54430 | 1 |
| Quadrant | Total seconds | Saturated seconds | Saturation percentage |
|---|---|---|---|
| A | 7248 | 89 | 1.227925% |
| B | 7248 | 924 | 12.748344% |
| C | 7248 | 3969 | 54.759934% |
| D | 7248 | 2064 | 28.476821% |
Noise dominated data is calculated using 1-second bins in cleaned event files. If a bin has >2000 counts, and if more than 50% of those come from <1% of pixels, then it is considered to be noise-dominated and hence unusable.
| Quadrant | # 1 sec bins | Bins with >0 counts | Bins with >2000 counts | High rate bins dominated by noise | Noise dominated (total time) | Noise dominated (detector-on time) | Marked lightcurve |
|---|---|---|---|---|---|---|---|
| A | 7313 | 7250 | 714 | 714 | 9.76% | 9.85% | 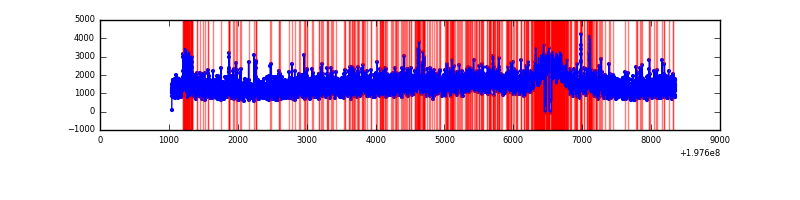 |
| B | 7313 | 7250 | 3298 | 3298 | 45.10% | 45.49% | 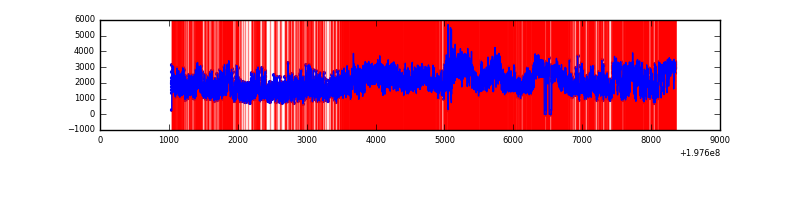 |
| C | 7313 | 7250 | 4842 | 4842 | 66.21% | 66.79% | 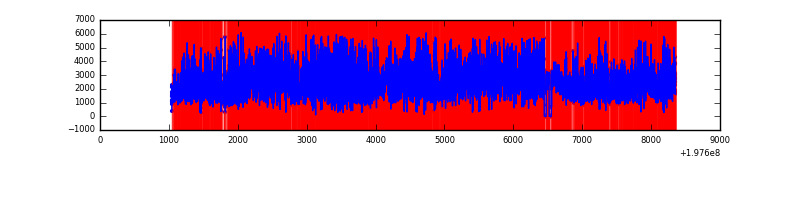 |
| D | 7313 | 7250 | 4370 | 4370 | 59.76% | 60.28% | 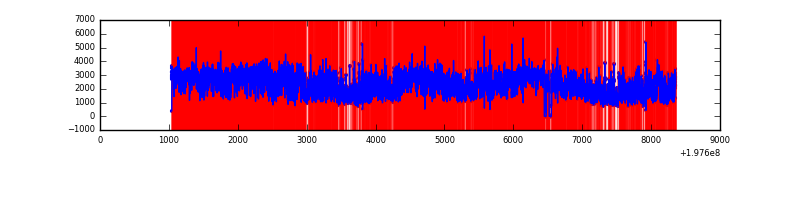 |
Top three noisy pixels from each quadrant. If the there are fewer than three noisy pixels in the level2.evt file, extra rows are filled as -1
| Pixel properties | Quadrant properties | ||||||
|---|---|---|---|---|---|---|---|
| Quadrant | DetID | PixID | Counts | Sigma | Mean | Median | Sigma |
| A | 0 | 31 | 151957 | 249.39 | 2562 | 2539 | 599.1 |
| A | 0 | 50 | 125841 | 205.8 | 2562 | 2539 | 599.1 |
| A | 0 | 226 | 68310 | 109.78 | 2562 | 2539 | 599.1 |
| B | 0 | 191 | 1711648 | 2804.76 | 2568 | 2544 | 609.4 |
| B | 0 | 219 | 784611 | 1283.43 | 2568 | 2544 | 609.4 |
| B | 3 | 10 | 674939 | 1103.45 | 2568 | 2544 | 609.4 |
| C | 0 | 64 | 7819210 | 15334.22 | 1740 | 1796 | 509.8 |
| C | 0 | 219 | 1397212 | 2737.17 | 1740 | 1796 | 509.8 |
| C | 1 | 16 | 770484 | 1507.82 | 1740 | 1796 | 509.8 |
| D | 0 | 226 | 4047516 | 6162.66 | 2185 | 2216 | 656.4 |
| D | 1 | 66 | 2474980 | 3767.04 | 2185 | 2216 | 656.4 |
| D | 1 | 83 | 758351 | 1151.9 | 2185 | 2216 | 656.4 |
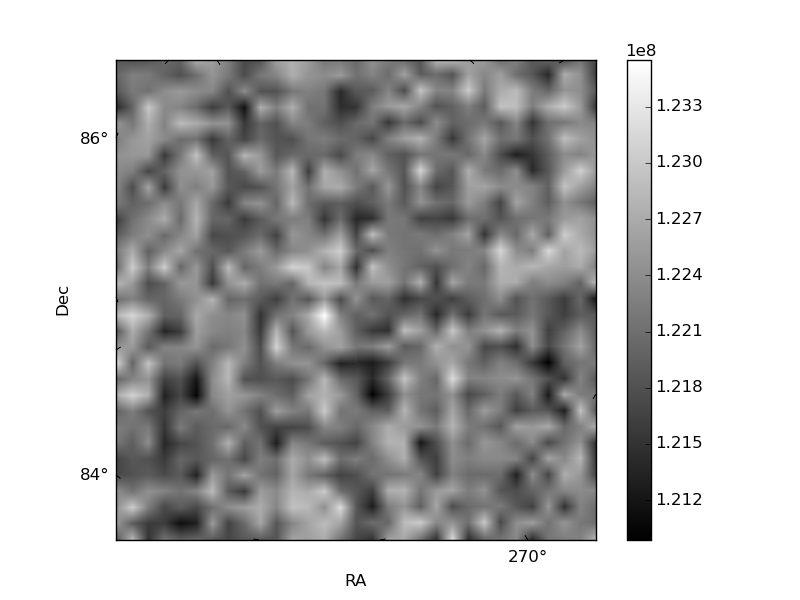
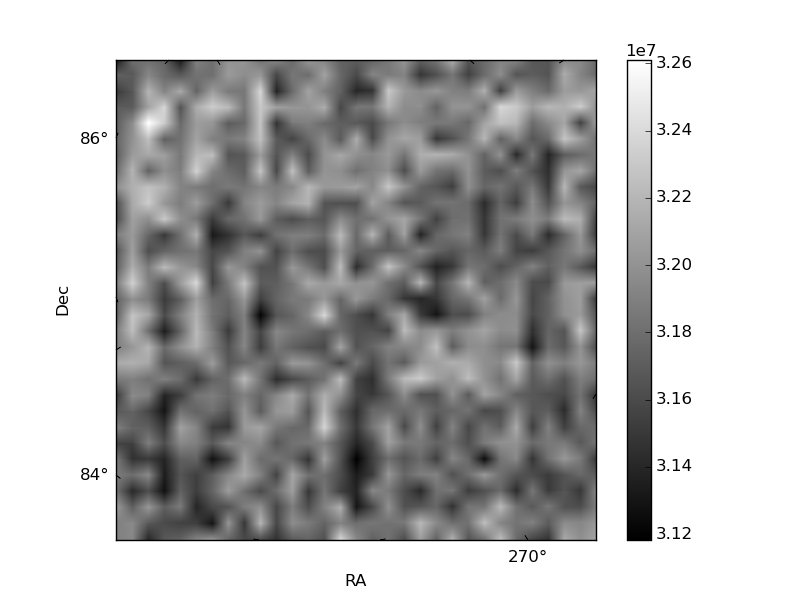
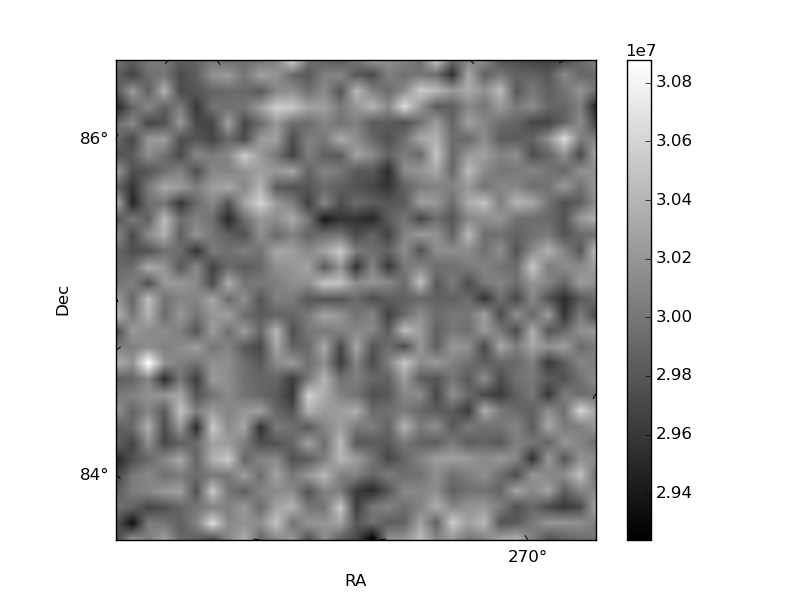
Histogram calculated using DETX and DETY for each event in the final _common_clean file
| Quadrant A | 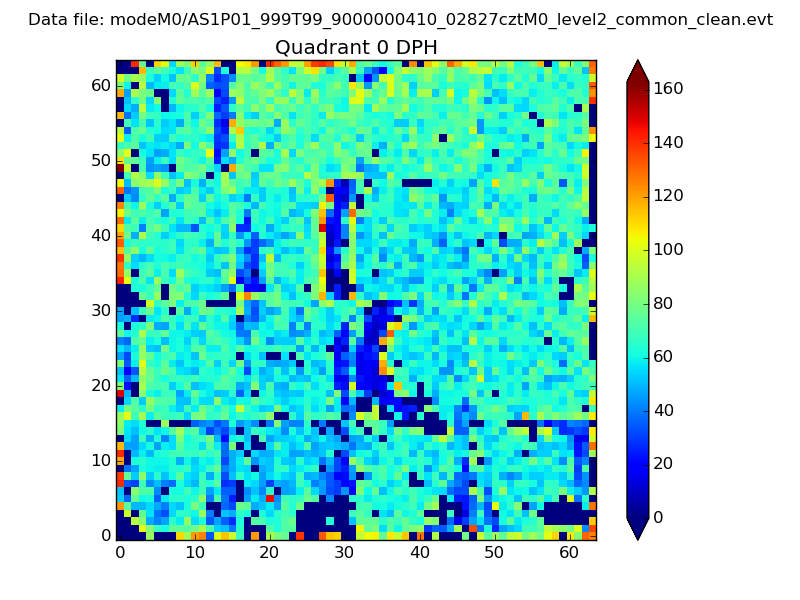 |
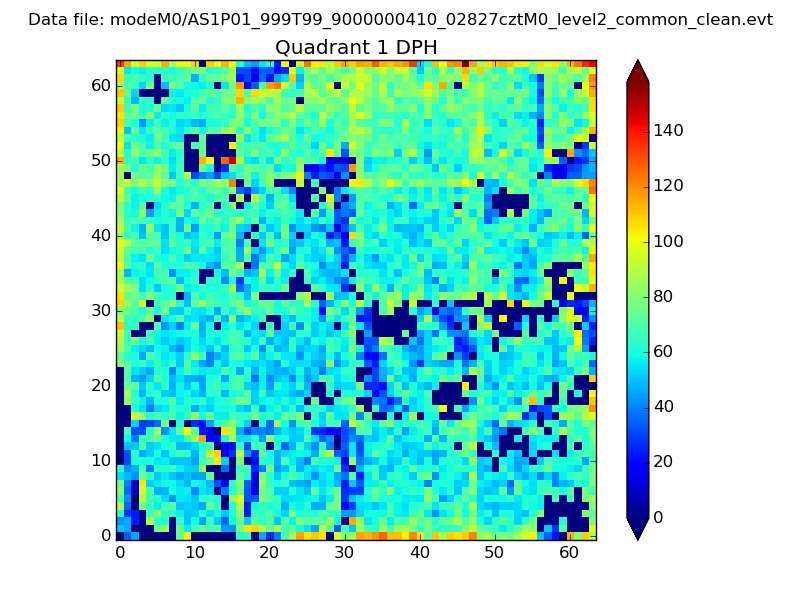 |
Quadrant B |
|---|---|---|---|
| Quadrant D |  |
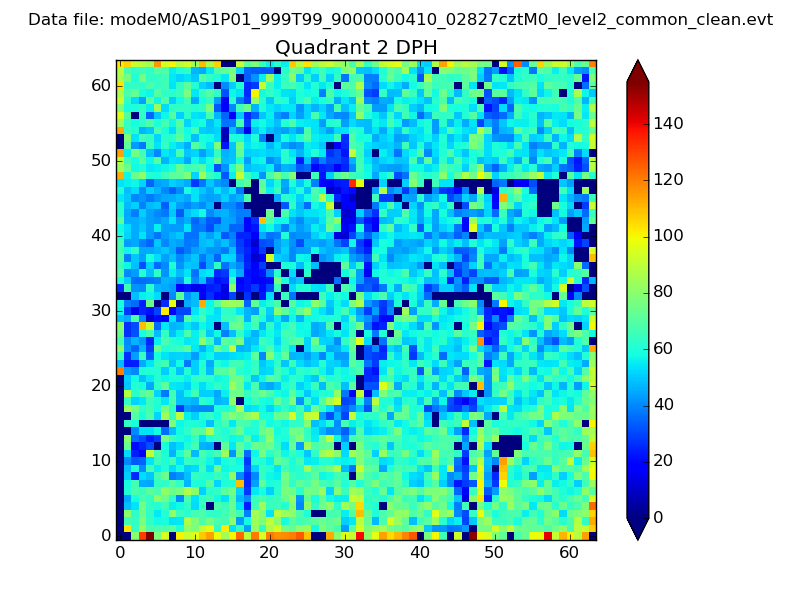 |
Quadrant C |
| Plot type | Count rate plots | Images |
|---|---|---|
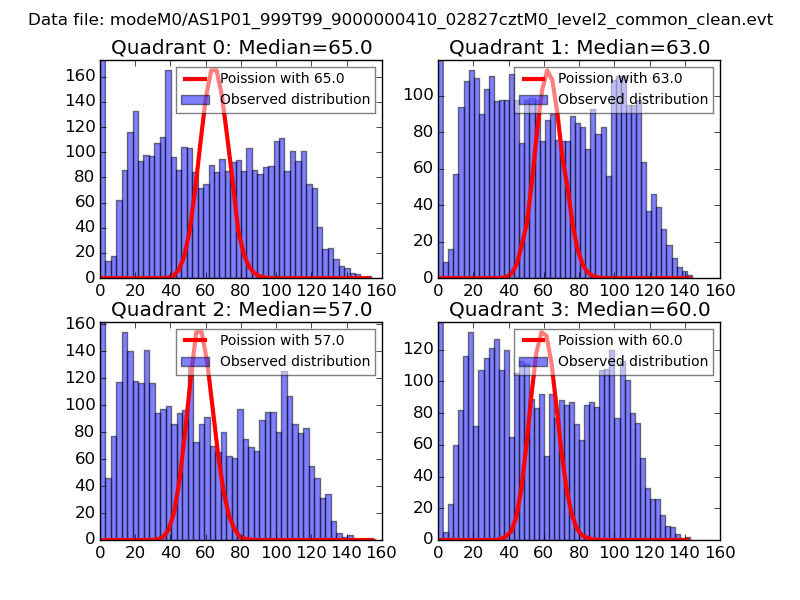
| Comparison with Poisson distribution Blue bars denote a histogram of data divided into 1 sec bins. Red curve is a Poisson curve with rate = median count rate of data. |
 |
 |
| Quadrant-wise count rates Data is divided into 100 sec bins |
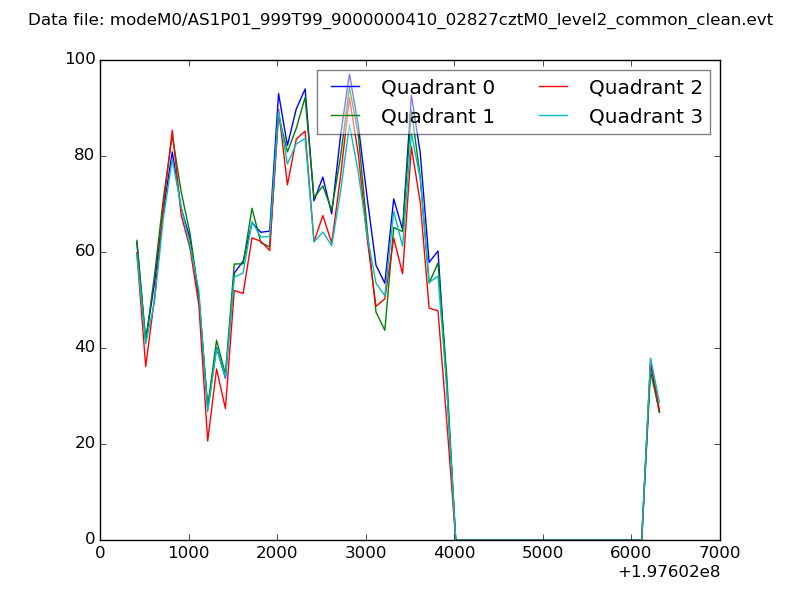 |
|
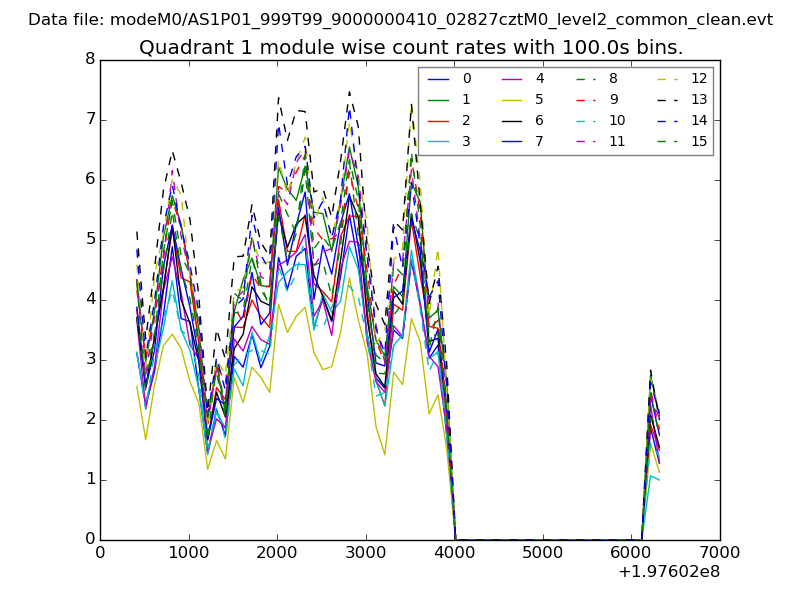
| Module-wise count rates for Quadrant A Data is divided into 100 sec bins |
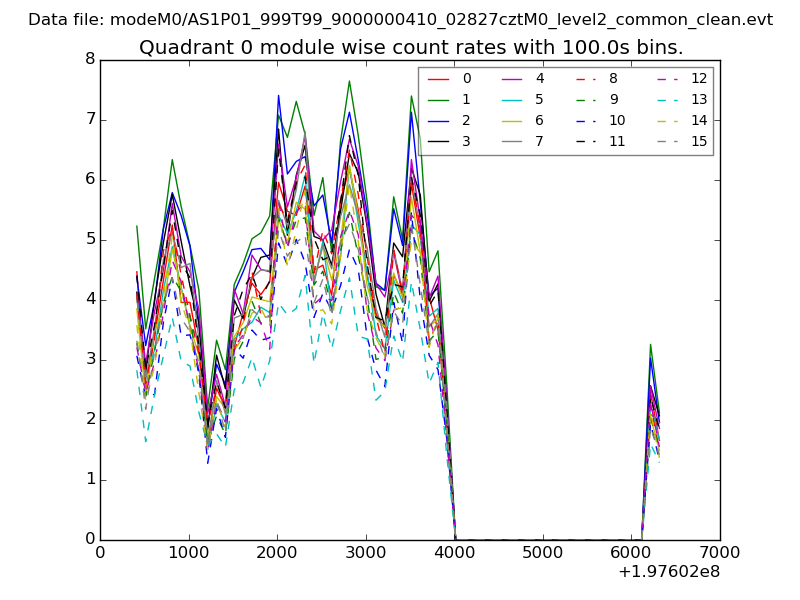 |
 |
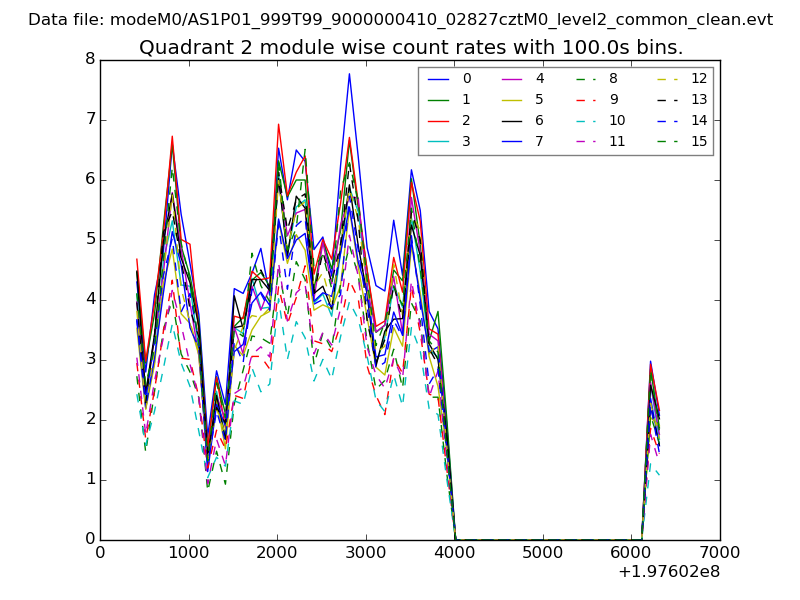
| Module-wise count rates for Quadrant B Data is divided into 100 sec bins |
 |
 |
| Module-wise count rates for Quadrant C Data is divided into 100 sec bins |
 |
 |
| Module-wise count rates for Quadrant D Data is divided into 100 sec bins |
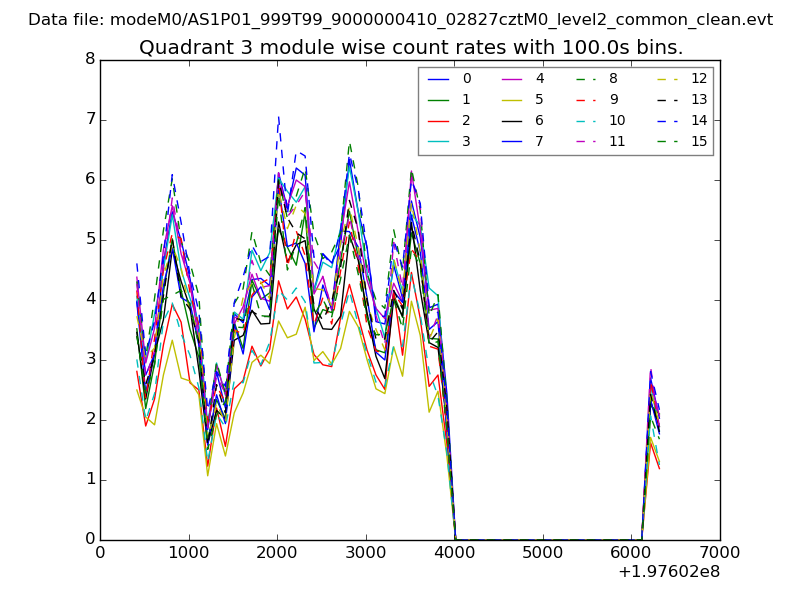 |
 |
| Parameter | Plot |
|---|---|
| CZT HV Monitor | 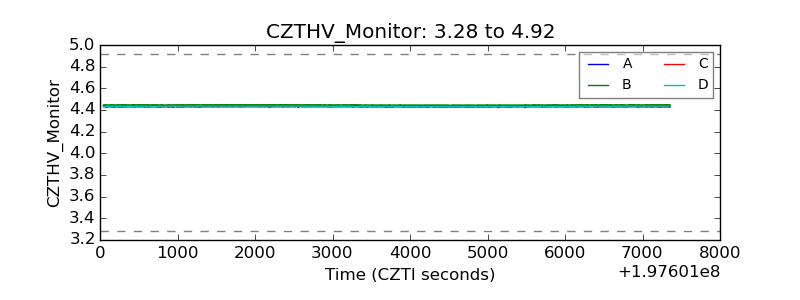 |
| D_VDD | 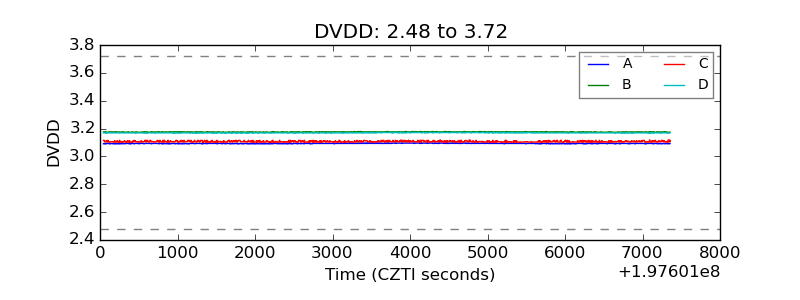 |
| Temperature 1 | 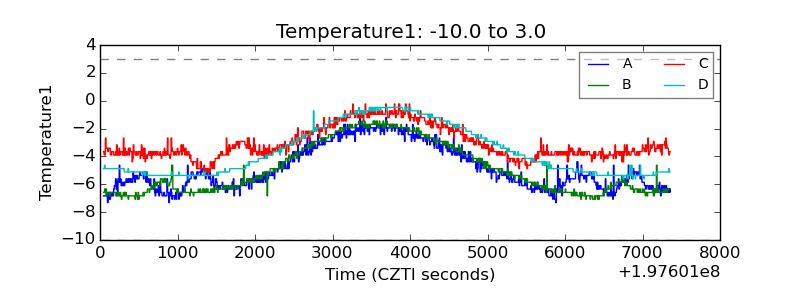 |
| Veto HV Monitor | 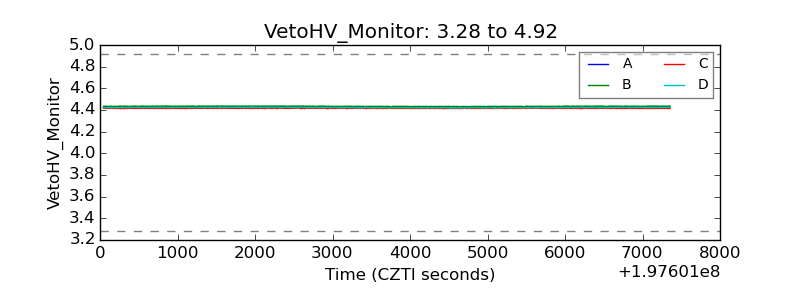 |
| Veto LLD | 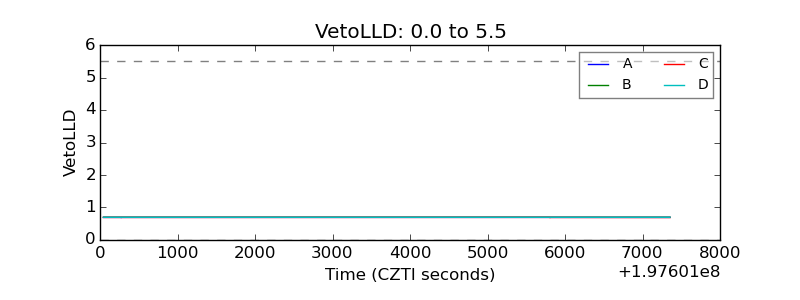 |
| Alpha Counter | 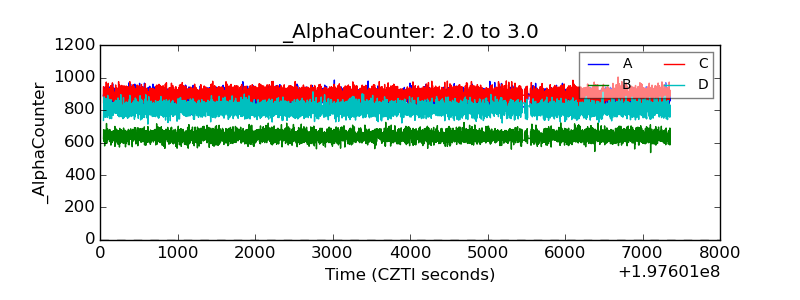 |
| _CPM_Rate | 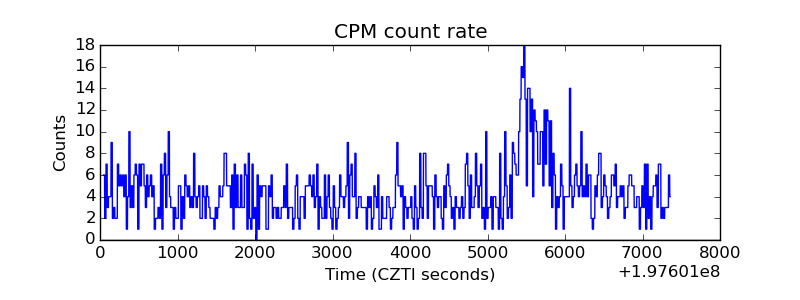 |
| CZT Counter |  |
| +2.5 Volts monitor |  |
| +5 Volts monitor |  |
| Veto Counter | 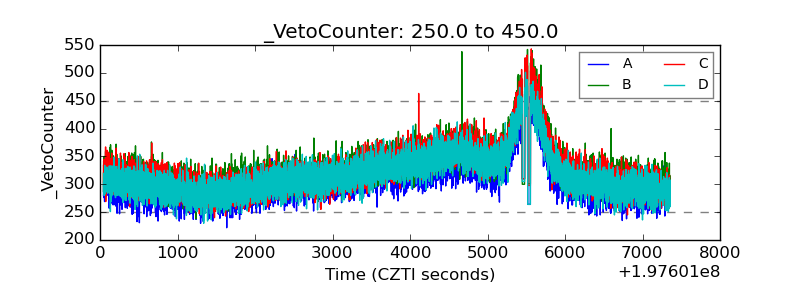 |