| Param | Original file | Final file |
|---|---|---|
| Filename | modeM0/AS1P01_999T99_9000000410_02828cztM0_level2.evt | modeM0/AS1P01_999T99_9000000410_02828cztM0_level2_quad_clean.evt |
| Size (bytes) | 1,864,949,760 | 68,849,280 |
| Size | 1.7 GB | 65.7 MB |
| Events in quadrant A | 9,920,425 | 443,581 |
| Events in quadrant B | 14,887,890 | 431,512 |
| Events in quadrant C | 15,778,947 | 340,905 |
| Events in quadrant D | 15,454,740 | 396,922 |
| Mode SS | |||
|---|---|---|---|
| Quadrant | BADHDUFLAG | Total packets | Discarded packets |
| A | 0 | 138 | 0 |
| B | 0 | 138 | 0 |
| C | 0 | 138 | 0 |
| D | 0 | 138 | 0 |
| Mode M9 | |||
|---|---|---|---|
| Quadrant | BADHDUFLAG | Total packets | Discarded packets |
| A | 0 | 1 | 0 |
| B | 0 | 1 | 0 |
| C | 0 | 1 | 0 |
| D | 0 | 1 | 0 |
| Mode M0 | |||
|---|---|---|---|
| Quadrant | BADHDUFLAG | Total packets | Discarded packets |
| A | 0 | 34261 | 2 |
| B | 0 | 49008 | 1 |
| C | 0 | 52039 | 1 |
| D | 0 | 50947 | 1 |
| Quadrant | Total seconds | Saturated seconds | Saturation percentage |
|---|---|---|---|
| A | 6742 | 218 | 3.233462% |
| B | 6742 | 1035 | 15.351528% |
| C | 6742 | 2707 | 40.151290% |
| D | 6742 | 2213 | 32.824088% |
Noise dominated data is calculated using 1-second bins in cleaned event files. If a bin has >2000 counts, and if more than 50% of those come from <1% of pixels, then it is considered to be noise-dominated and hence unusable.
| Quadrant | # 1 sec bins | Bins with >0 counts | Bins with >2000 counts | High rate bins dominated by noise | Noise dominated (total time) | Noise dominated (detector-on time) | Marked lightcurve |
|---|---|---|---|---|---|---|---|
| A | 6897 | 6743 | 780 | 780 | 11.31% | 11.57% | 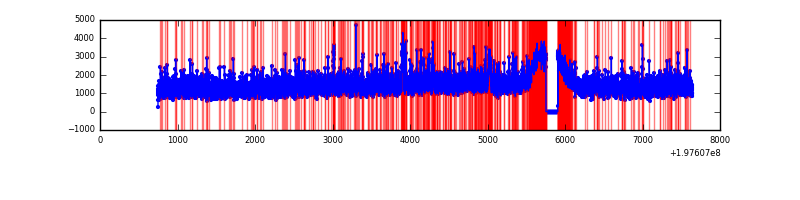 |
| B | 6897 | 6743 | 4110 | 4110 | 59.59% | 60.95% | 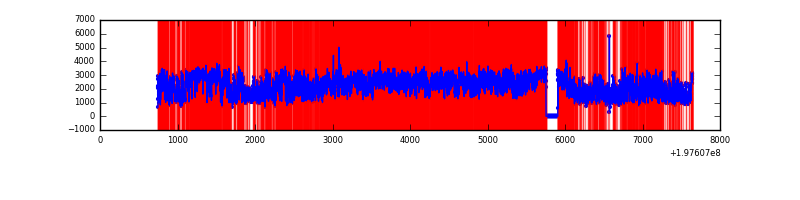 |
| C | 6897 | 6743 | 3822 | 3822 | 55.42% | 56.68% | 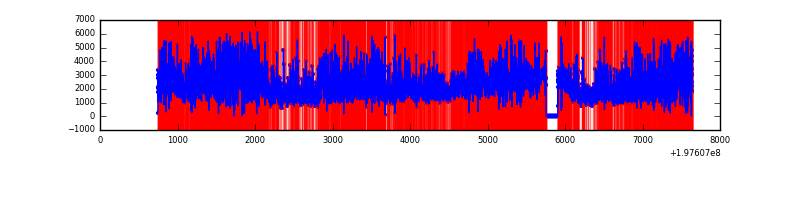 |
| D | 6897 | 6743 | 4012 | 4012 | 58.17% | 59.50% | 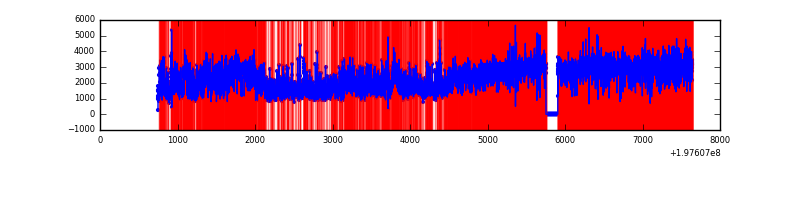 |
Top three noisy pixels from each quadrant. If the there are fewer than three noisy pixels in the level2.evt file, extra rows are filled as -1
| Pixel properties | Quadrant properties | ||||||
|---|---|---|---|---|---|---|---|
| Quadrant | DetID | PixID | Counts | Sigma | Mean | Median | Sigma |
| A | 0 | 31 | 207196 | 362.61 | 2433 | 2413 | 564.7 |
| A | 0 | 63 | 203640 | 356.32 | 2433 | 2413 | 564.7 |
| A | 0 | 226 | 58881 | 99.99 | 2433 | 2413 | 564.7 |
| B | 0 | 219 | 2316307 | 3976.67 | 2464 | 2443 | 581.9 |
| B | 3 | 10 | 880504 | 1509.06 | 2464 | 2443 | 581.9 |
| B | 3 | 11 | 308180 | 525.45 | 2464 | 2443 | 581.9 |
| C | 0 | 219 | 5513319 | 10035.97 | 1861 | 1917 | 549.2 |
| C | 1 | 16 | 861653 | 1565.53 | 1861 | 1917 | 549.2 |
| C | 1 | 192 | 832603 | 1512.64 | 1861 | 1917 | 549.2 |
| D | 0 | 226 | 3849063 | 6371.43 | 2006 | 2038 | 603.8 |
| D | 1 | 66 | 2330015 | 3855.59 | 2006 | 2038 | 603.8 |
| D | 1 | 83 | 838332 | 1385.07 | 2006 | 2038 | 603.8 |
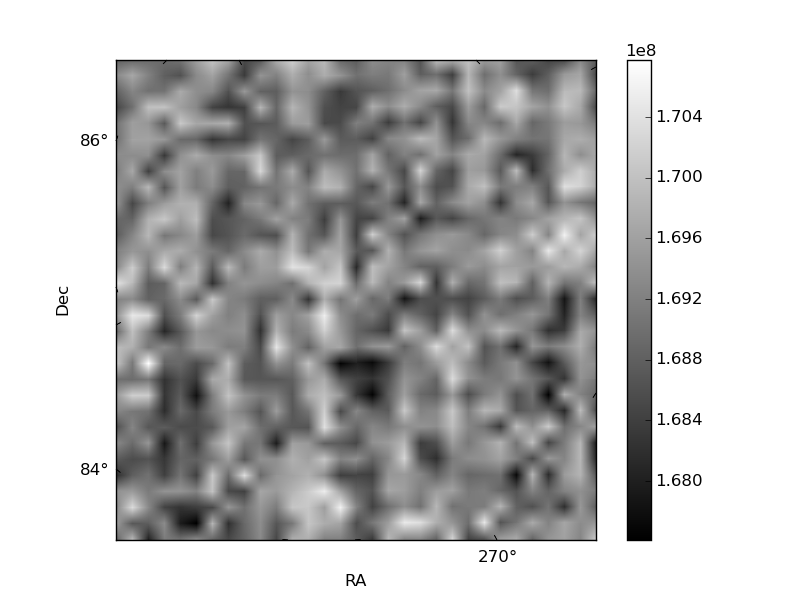
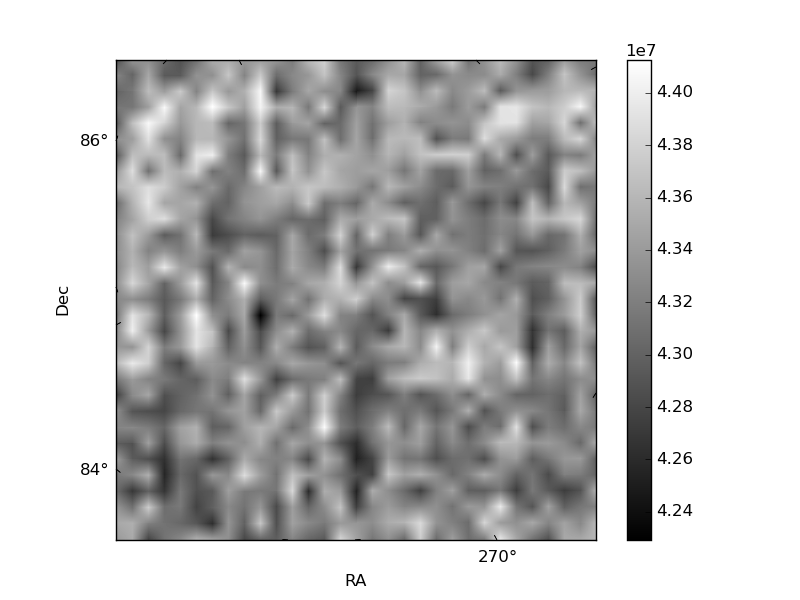
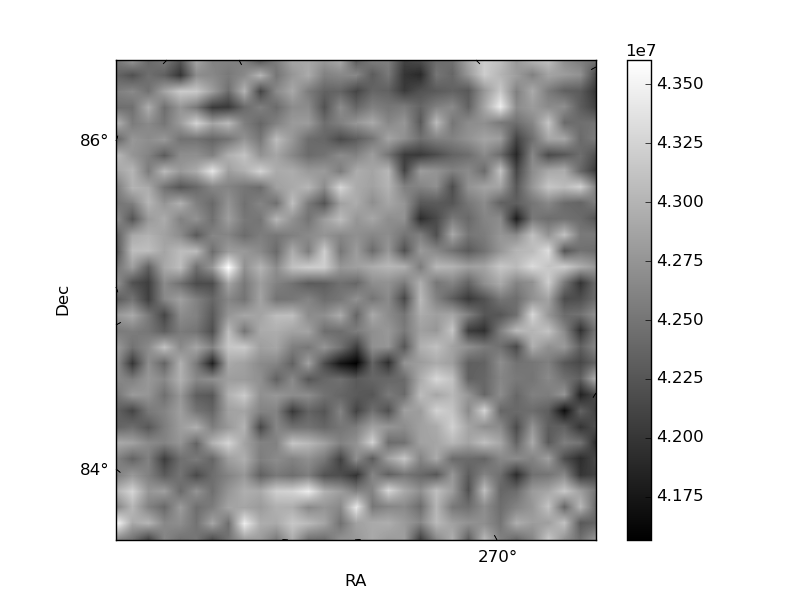
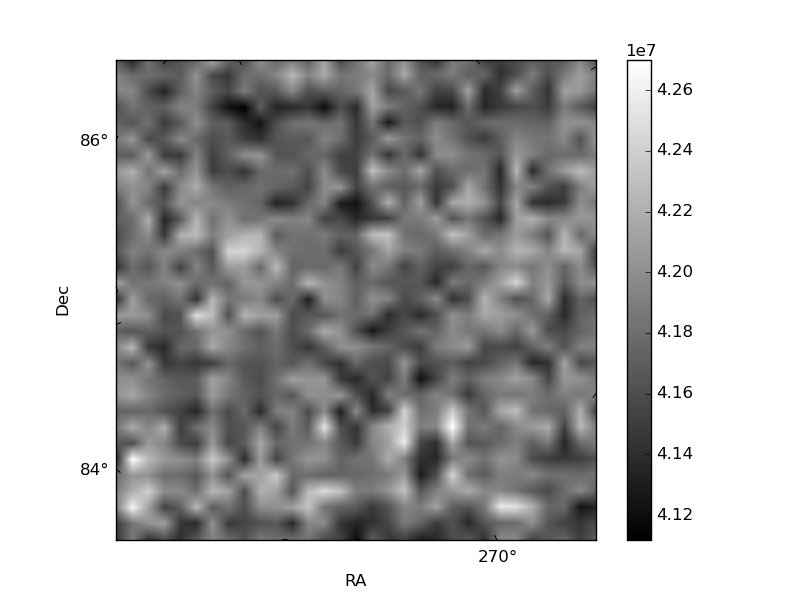
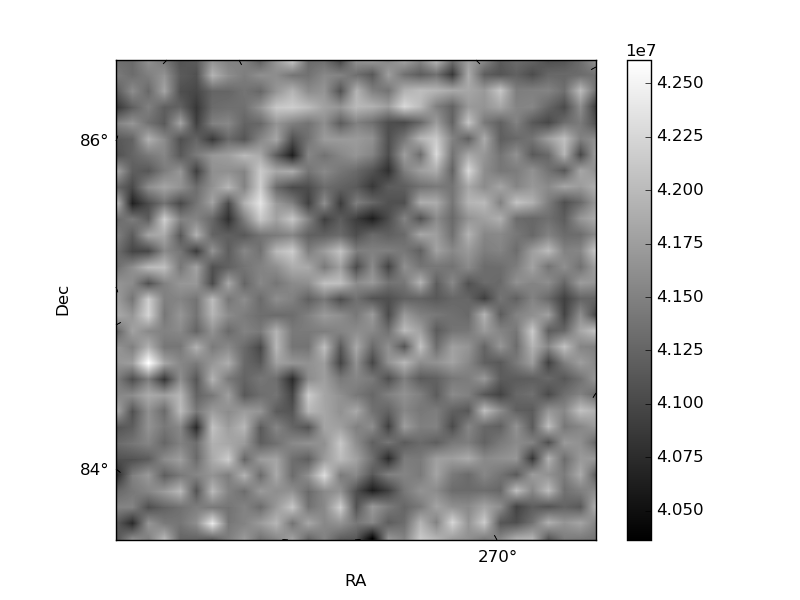
Histogram calculated using DETX and DETY for each event in the final _common_clean file
| Quadrant A | 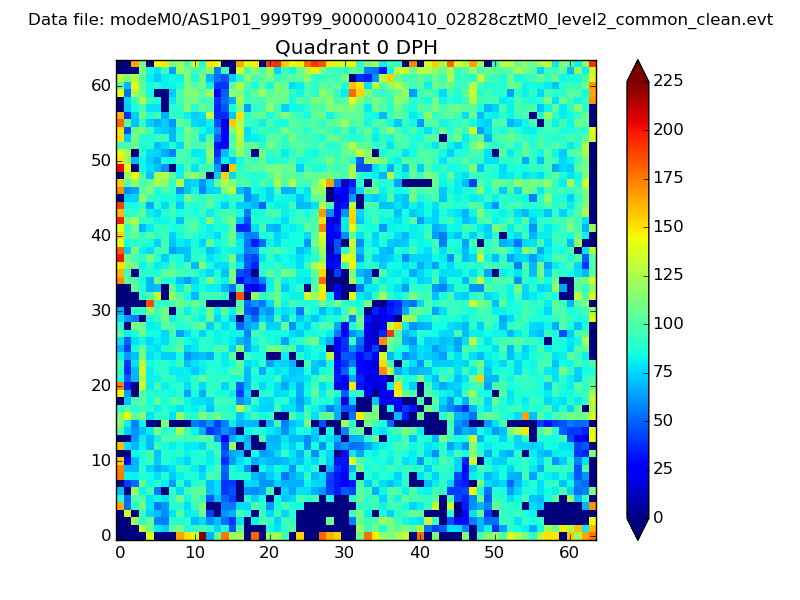 |
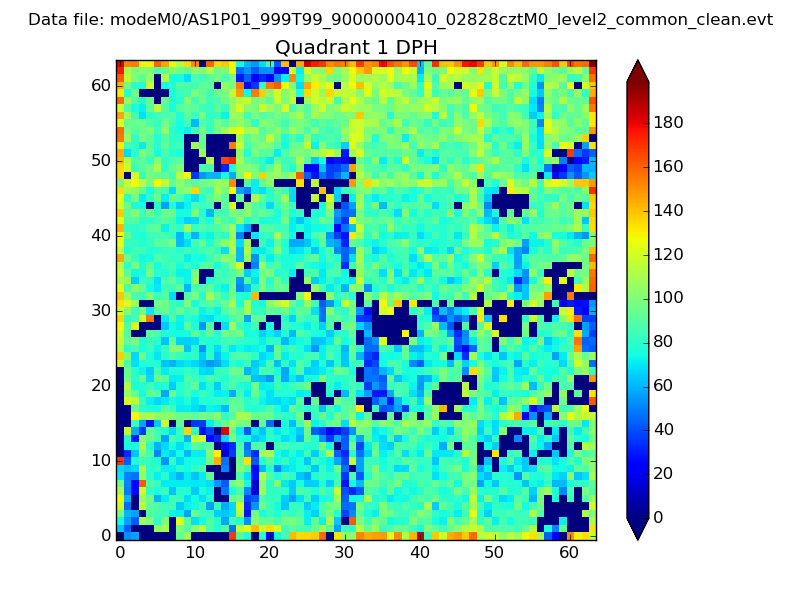 |
Quadrant B |
|---|---|---|---|
| Quadrant D | 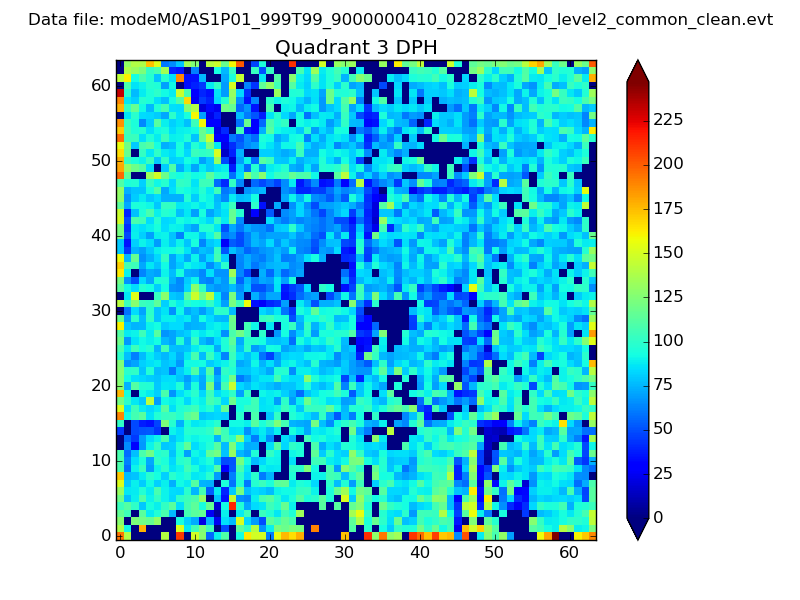 |
 |
Quadrant C |
| Plot type | Count rate plots | Images |
|---|---|---|
| Comparison with Poisson distribution Blue bars denote a histogram of data divided into 1 sec bins. Red curve is a Poisson curve with rate = median count rate of data. |
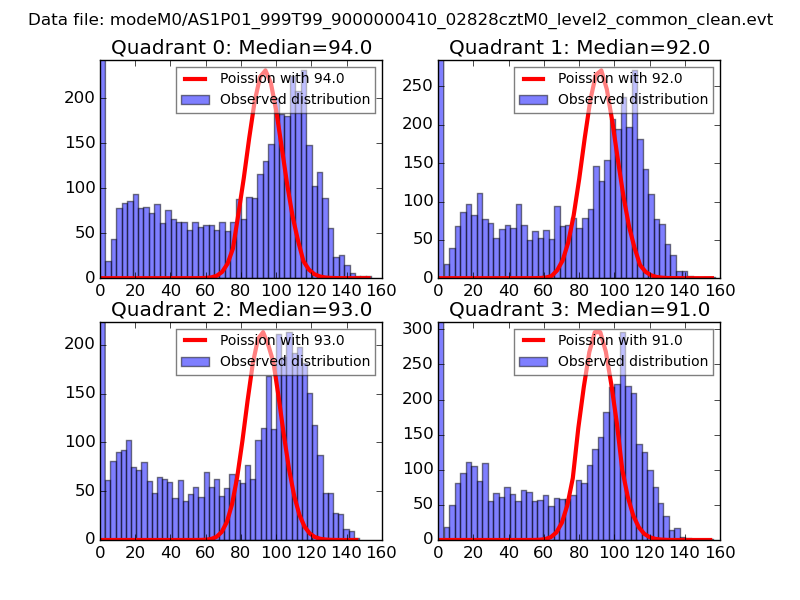 |
 |
| Quadrant-wise count rates Data is divided into 100 sec bins |
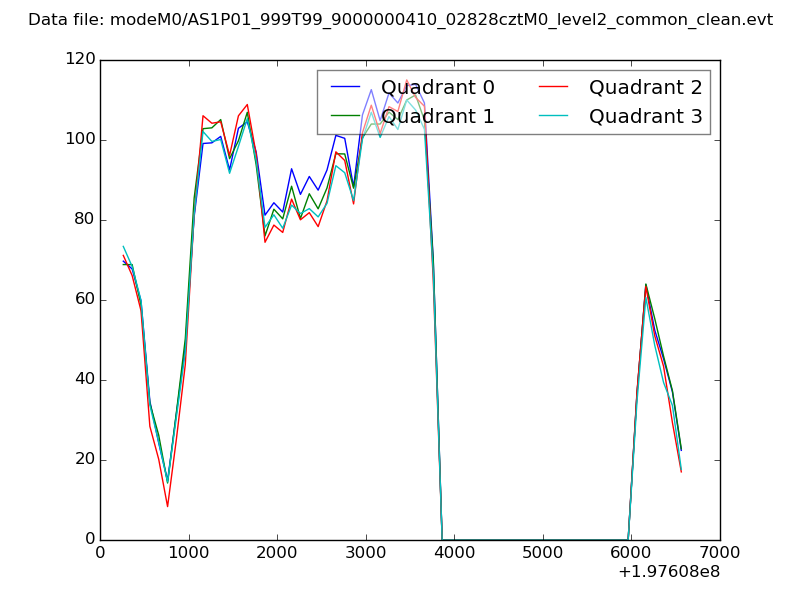 |
|
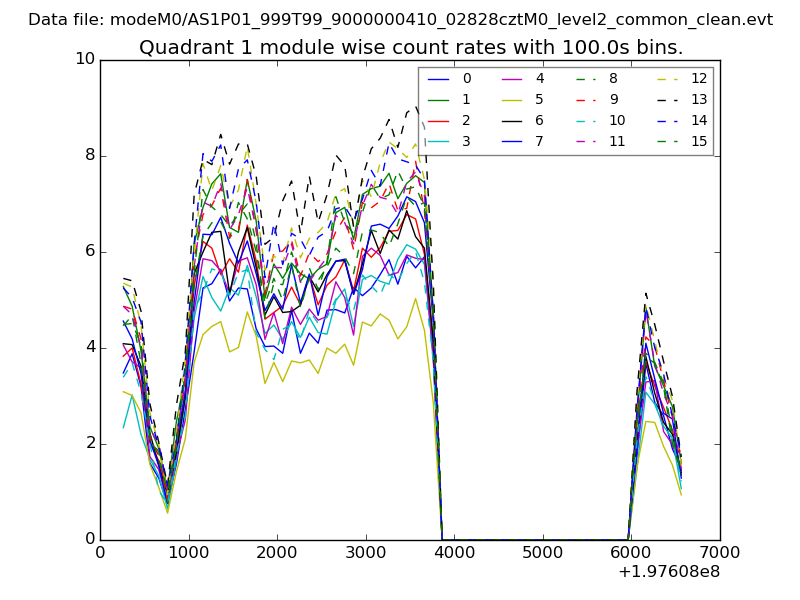
| Module-wise count rates for Quadrant A Data is divided into 100 sec bins |
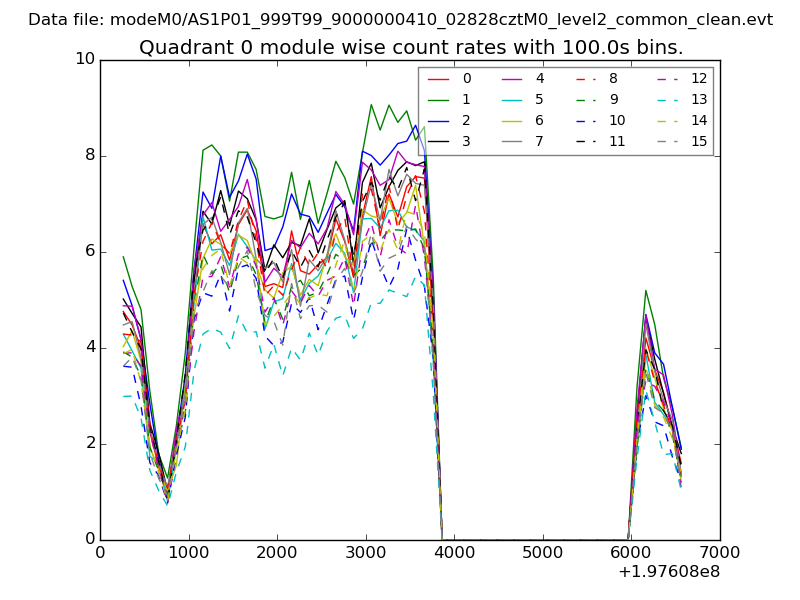 |
 |
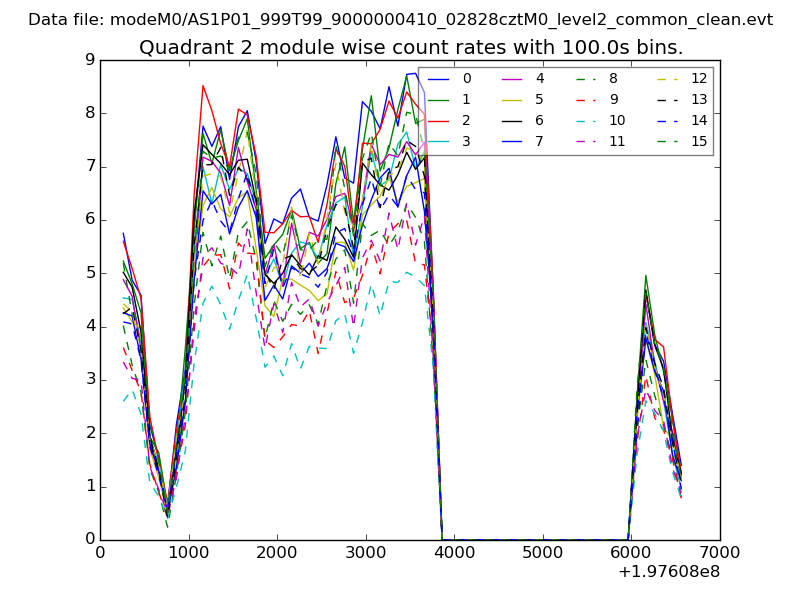
| Module-wise count rates for Quadrant B Data is divided into 100 sec bins |
 |
 |
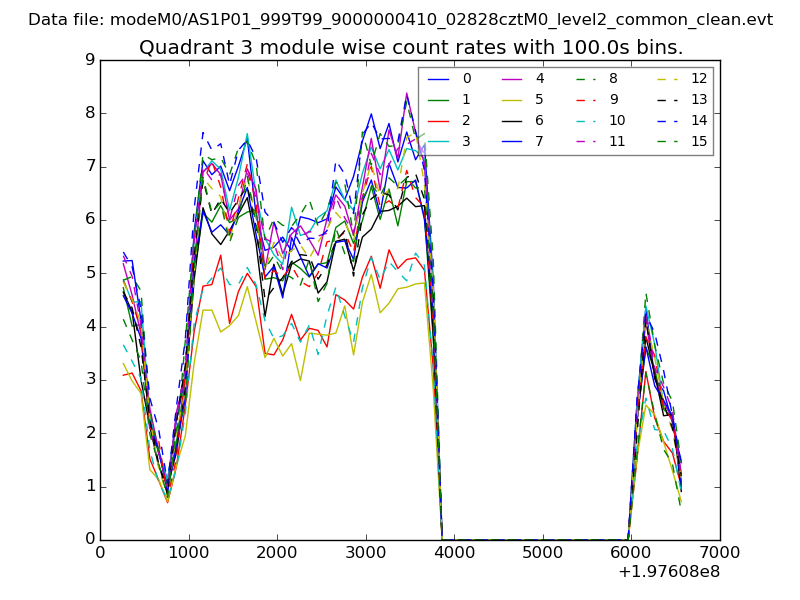
| Module-wise count rates for Quadrant C Data is divided into 100 sec bins |
 |
 |
| Module-wise count rates for Quadrant D Data is divided into 100 sec bins |
 |
 |
| Parameter | Plot |
|---|---|
| CZT HV Monitor | 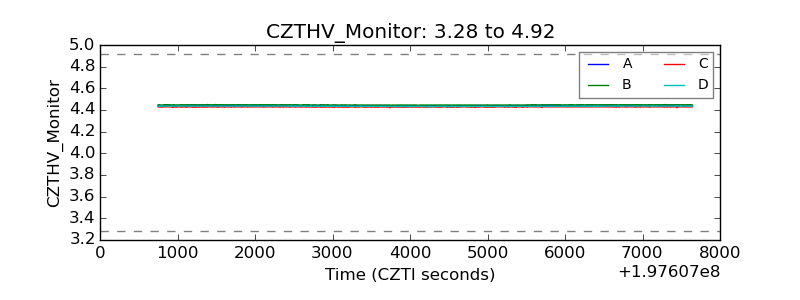 |
| D_VDD | 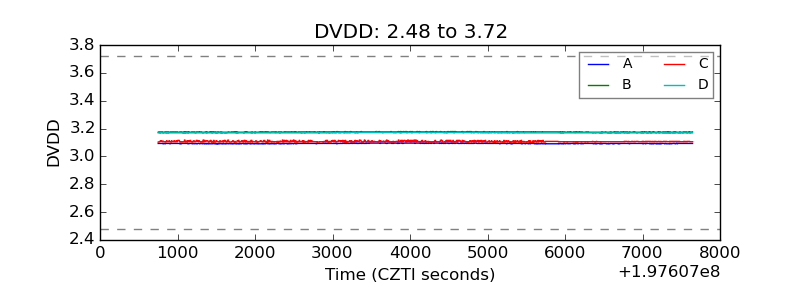 |
| Temperature 1 | 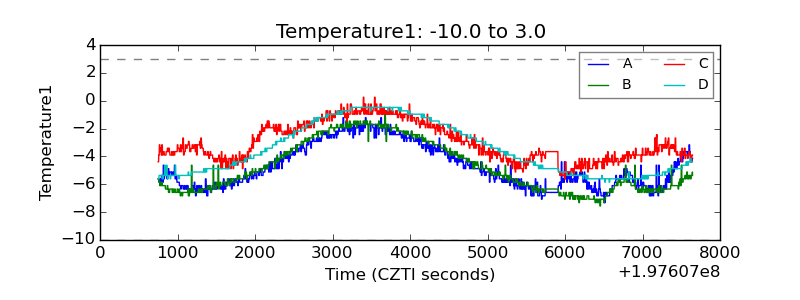 |
| Veto HV Monitor | 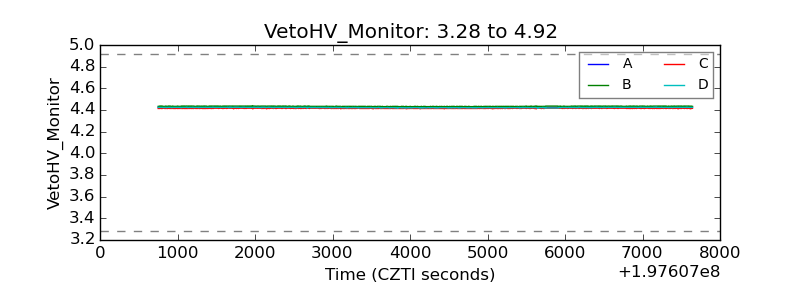 |
| Veto LLD | 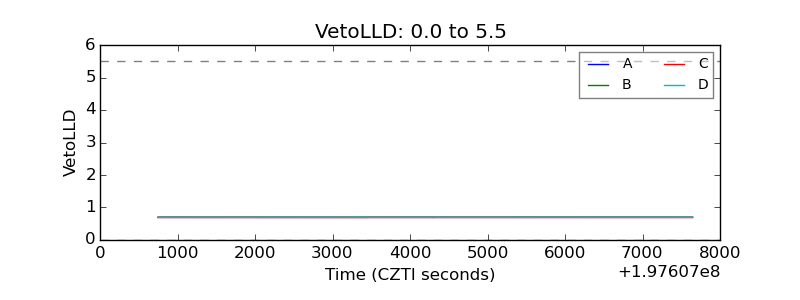 |
| Alpha Counter | 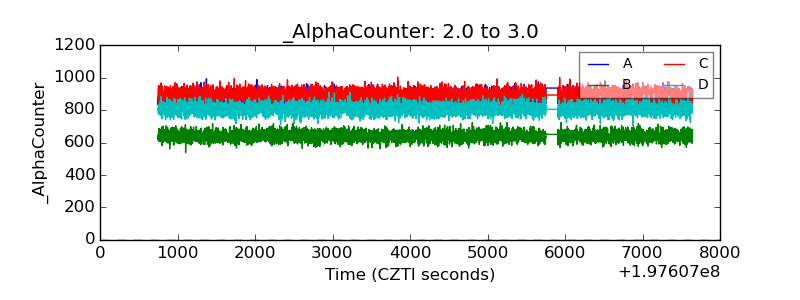 |
| _CPM_Rate | 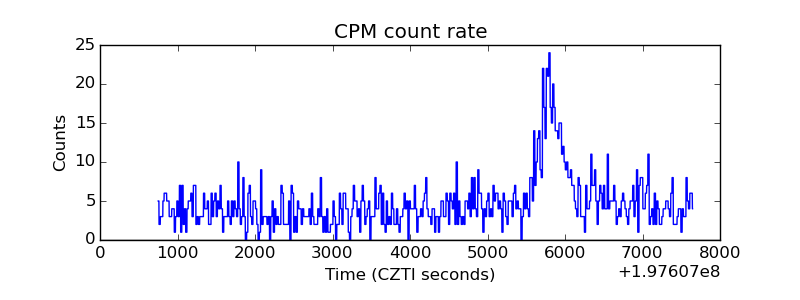 |
| CZT Counter | 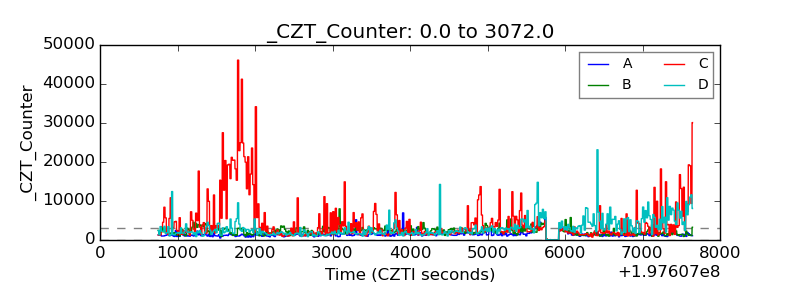 |
| +2.5 Volts monitor | 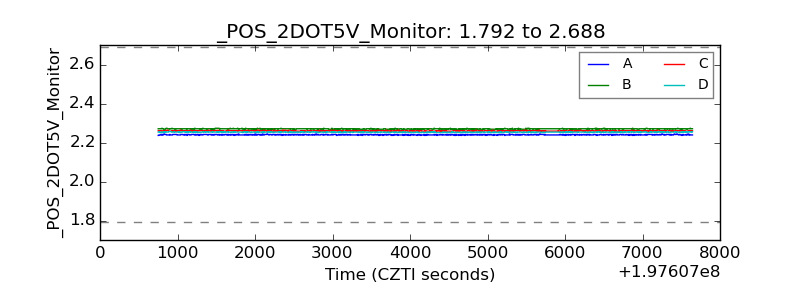 |
| +5 Volts monitor | 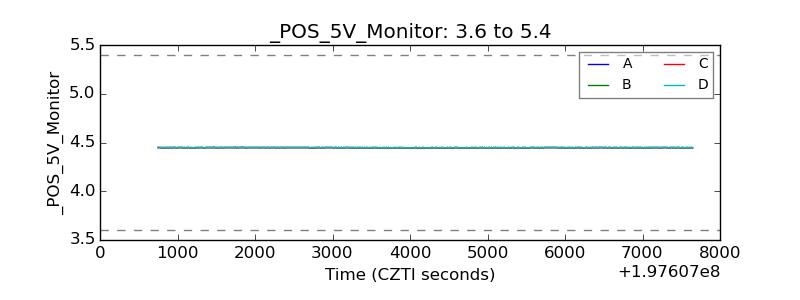 |
| Veto Counter | 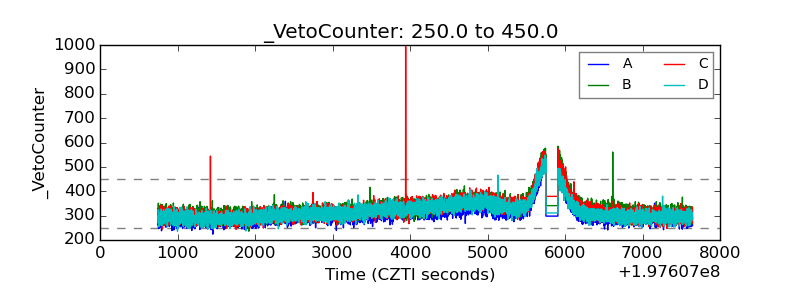 |