| Param | Original file | Final file |
|---|---|---|
| Filename | modeM0/AS1P01_999T99_9000000410_02830cztM0_level2.evt | modeM0/AS1P01_999T99_9000000410_02830cztM0_level2_quad_clean.evt |
| Size (bytes) | 1,364,316,480 | 56,139,840 |
| Size | 1.3 GB | 53.5 MB |
| Events in quadrant A | 7,111,061 | 385,819 |
| Events in quadrant B | 9,950,099 | 382,867 |
| Events in quadrant C | 12,969,134 | 258,442 |
| Events in quadrant D | 10,966,757 | 325,163 |
| Mode SS | |||
|---|---|---|---|
| Quadrant | BADHDUFLAG | Total packets | Discarded packets |
| A | 0 | 100 | 0 |
| B | 0 | 100 | 0 |
| C | 0 | 100 | 0 |
| D | 0 | 100 | 0 |
| Mode M0 | |||
|---|---|---|---|
| Quadrant | BADHDUFLAG | Total packets | Discarded packets |
| A | 0 | 24628 | 1 |
| B | 0 | 32992 | 0 |
| C | 0 | 42466 | 0 |
| D | 0 | 36253 | 0 |
| Quadrant | Total seconds | Saturated seconds | Saturation percentage |
|---|---|---|---|
| A | 4925 | 75 | 1.522843% |
| B | 4925 | 398 | 8.081218% |
| C | 4925 | 2862 | 58.111675% |
| D | 4925 | 1537 | 31.208122% |
Noise dominated data is calculated using 1-second bins in cleaned event files. If a bin has >2000 counts, and if more than 50% of those come from <1% of pixels, then it is considered to be noise-dominated and hence unusable.
| Quadrant | # 1 sec bins | Bins with >0 counts | Bins with >2000 counts | High rate bins dominated by noise | Noise dominated (total time) | Noise dominated (detector-on time) | Marked lightcurve |
|---|---|---|---|---|---|---|---|
| A | 4925 | 4925 | 408 | 408 | 8.28% | 8.28% | 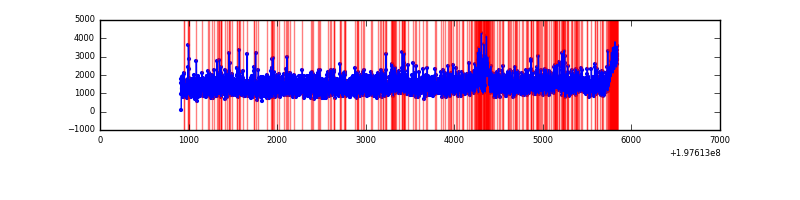 |
| B | 4925 | 4925 | 2315 | 2315 | 47.01% | 47.01% | 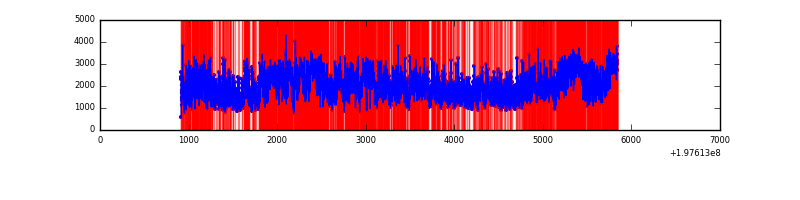 |
| C | 4925 | 4925 | 3494 | 3494 | 70.94% | 70.94% | 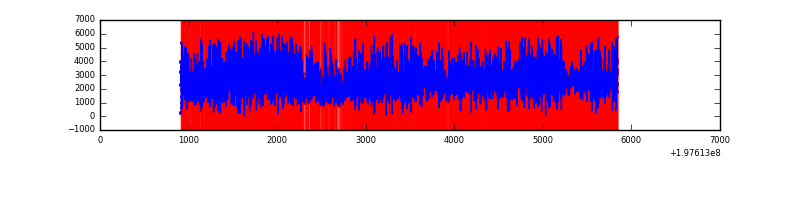 |
| D | 4925 | 4925 | 2685 | 2685 | 54.52% | 54.52% | 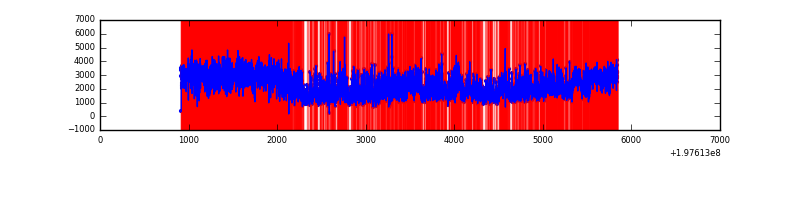 |
Top three noisy pixels from each quadrant. If the there are fewer than three noisy pixels in the level2.evt file, extra rows are filled as -1
| Pixel properties | Quadrant properties | ||||||
|---|---|---|---|---|---|---|---|
| Quadrant | DetID | PixID | Counts | Sigma | Mean | Median | Sigma |
| A | 0 | 13 | 159175 | 383.71 | 1756 | 1737 | 410.3 |
| A | 0 | 31 | 80110 | 191.01 | 1756 | 1737 | 410.3 |
| A | 0 | 128 | 47139 | 110.65 | 1756 | 1737 | 410.3 |
| B | 0 | 219 | 1030866 | 2453.87 | 1771 | 1755 | 419.4 |
| B | 2 | 250 | 405585 | 962.92 | 1771 | 1755 | 419.4 |
| B | 3 | 10 | 312218 | 740.29 | 1771 | 1755 | 419.4 |
| C | 0 | 64 | 6395803 | 18818.18 | 1155 | 1196 | 339.8 |
| C | 0 | 219 | 718158 | 2109.89 | 1155 | 1196 | 339.8 |
| C | 1 | 16 | 500951 | 1470.69 | 1155 | 1196 | 339.8 |
| D | 0 | 226 | 2991010 | 6767.9 | 1465 | 1487 | 441.7 |
| D | 1 | 66 | 1810821 | 4096.1 | 1465 | 1487 | 441.7 |
| D | 1 | 83 | 167358 | 375.51 | 1465 | 1487 | 441.7 |
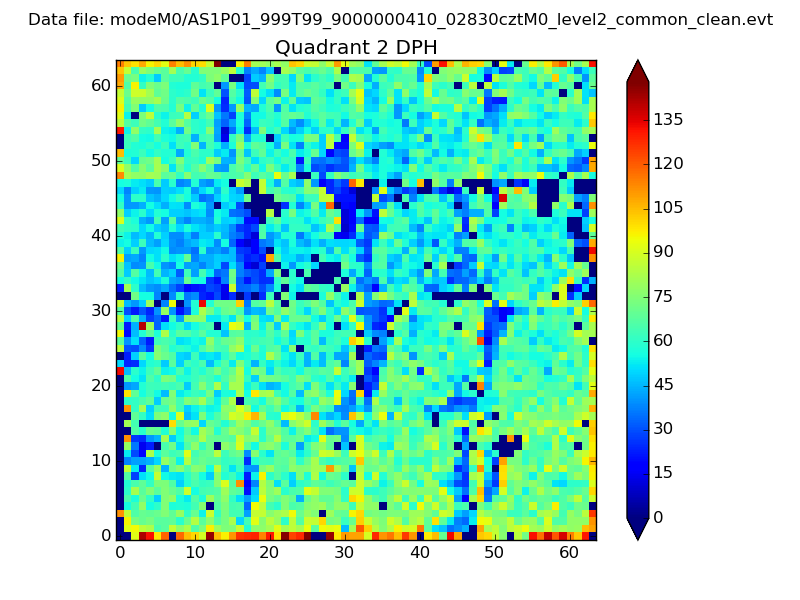
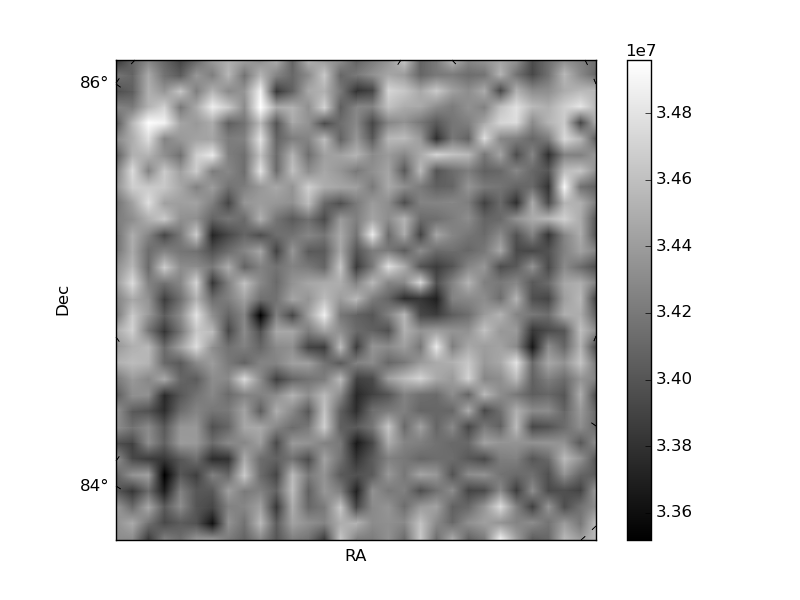
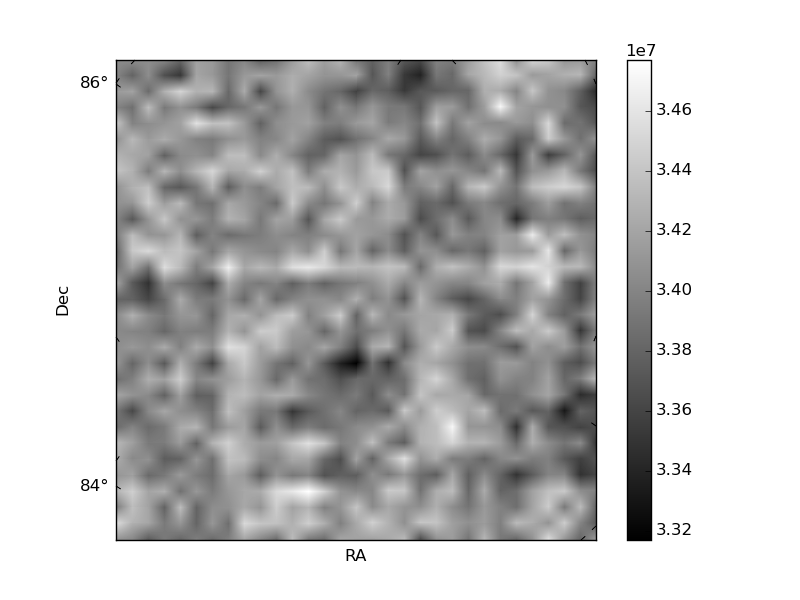
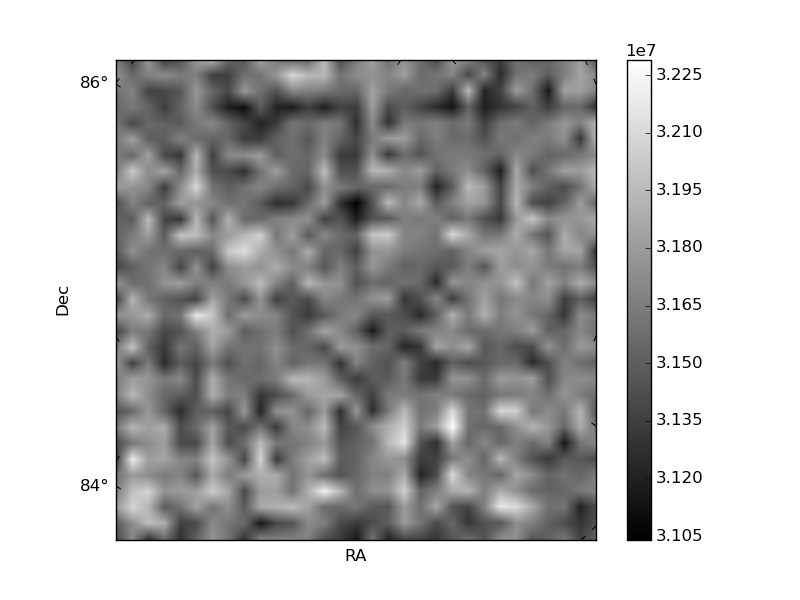
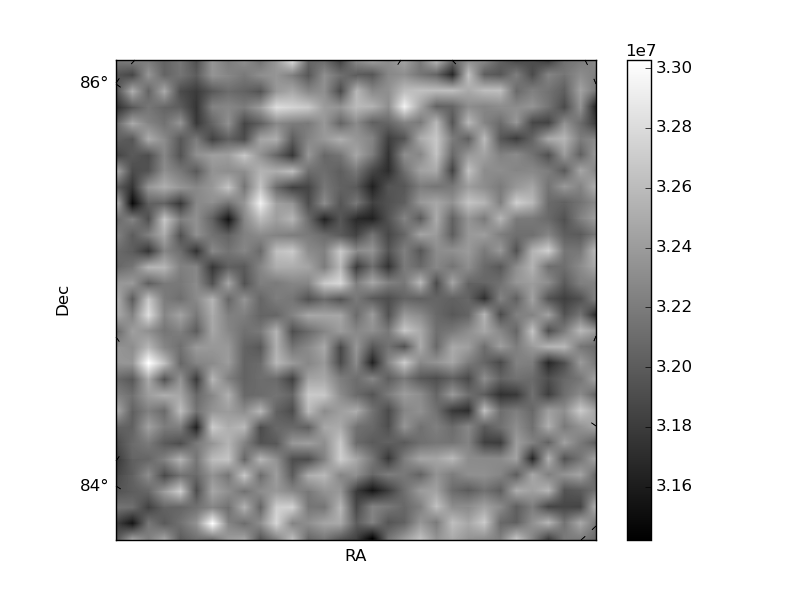
Histogram calculated using DETX and DETY for each event in the final _common_clean file
| Quadrant A | 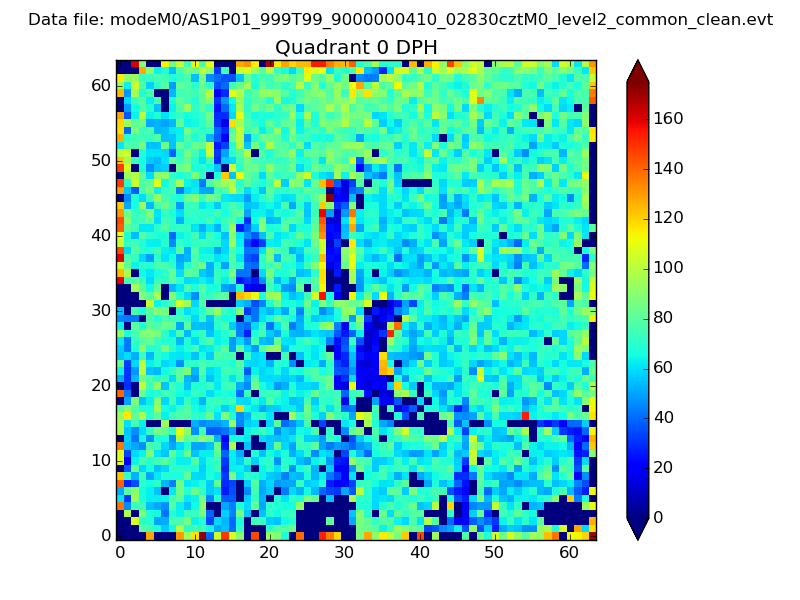 |
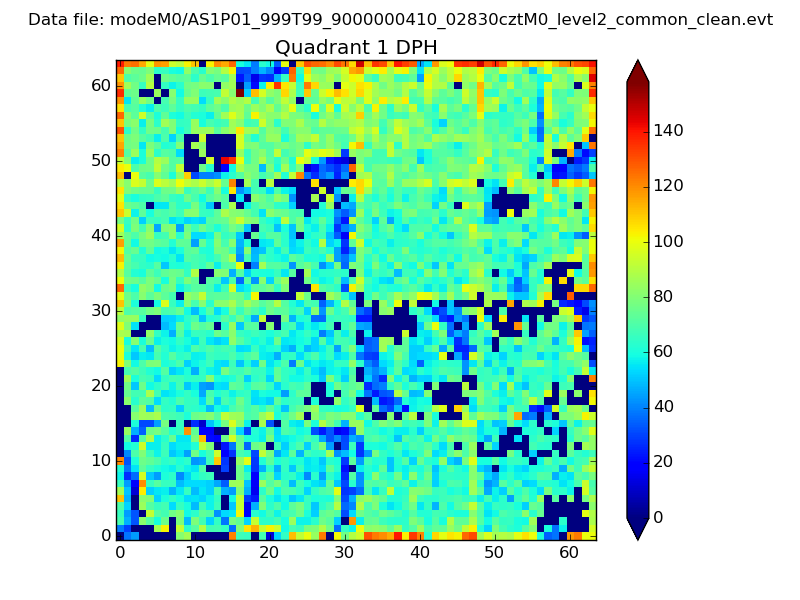 |
Quadrant B |
|---|---|---|---|
| Quadrant D | 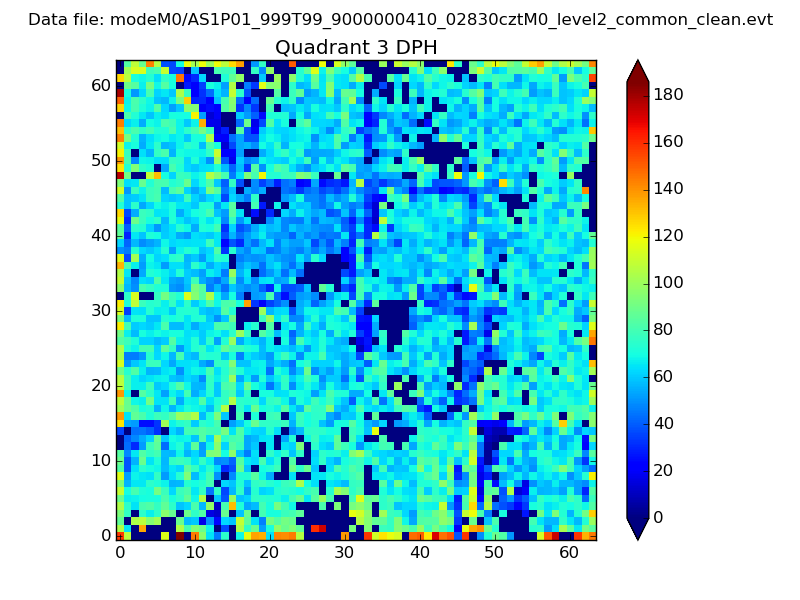 |
 |
Quadrant C |
| Plot type | Count rate plots | Images |
|---|---|---|
| Comparison with Poisson distribution Blue bars denote a histogram of data divided into 1 sec bins. Red curve is a Poisson curve with rate = median count rate of data. |
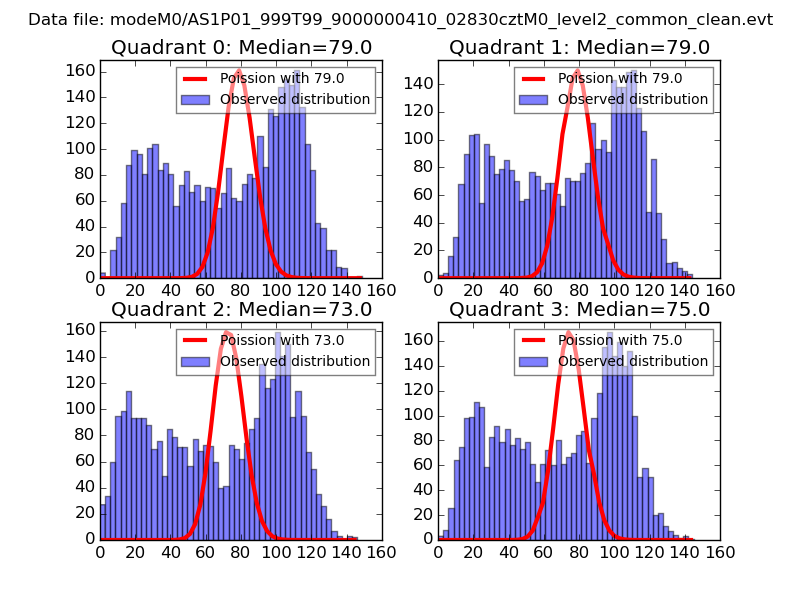 |
 |
| Quadrant-wise count rates Data is divided into 100 sec bins |
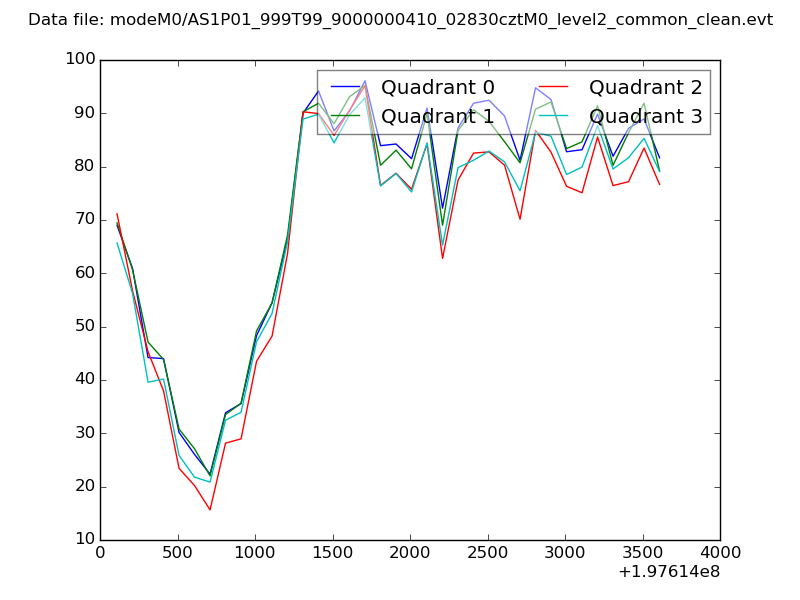 |
|
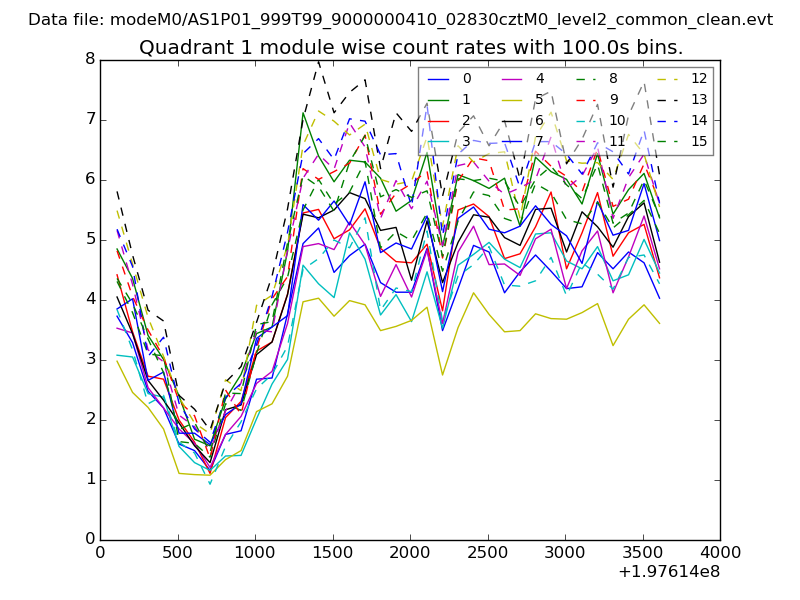
| Module-wise count rates for Quadrant A Data is divided into 100 sec bins |
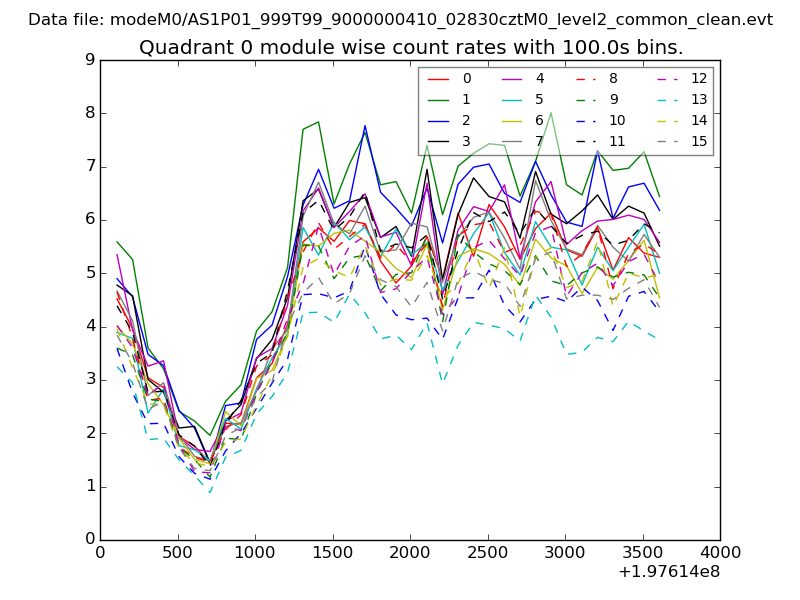 |
 |
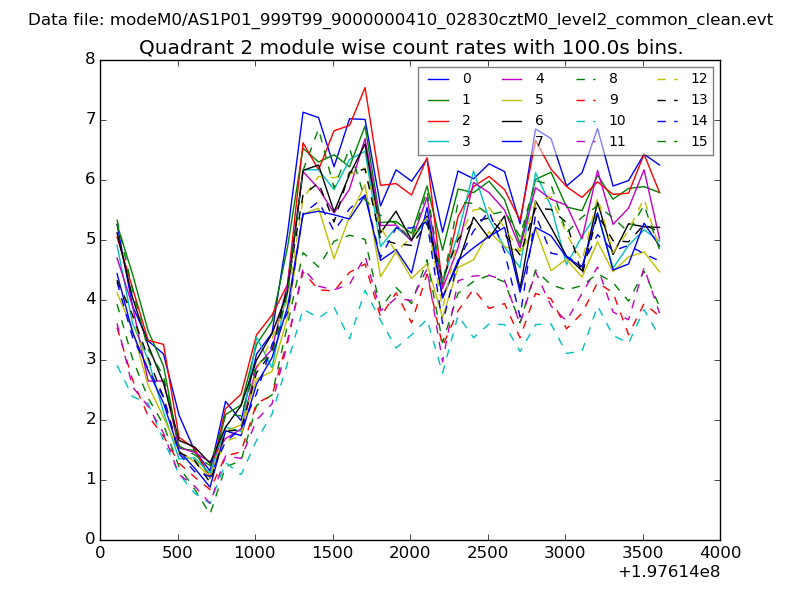
| Module-wise count rates for Quadrant B Data is divided into 100 sec bins |
 |
 |
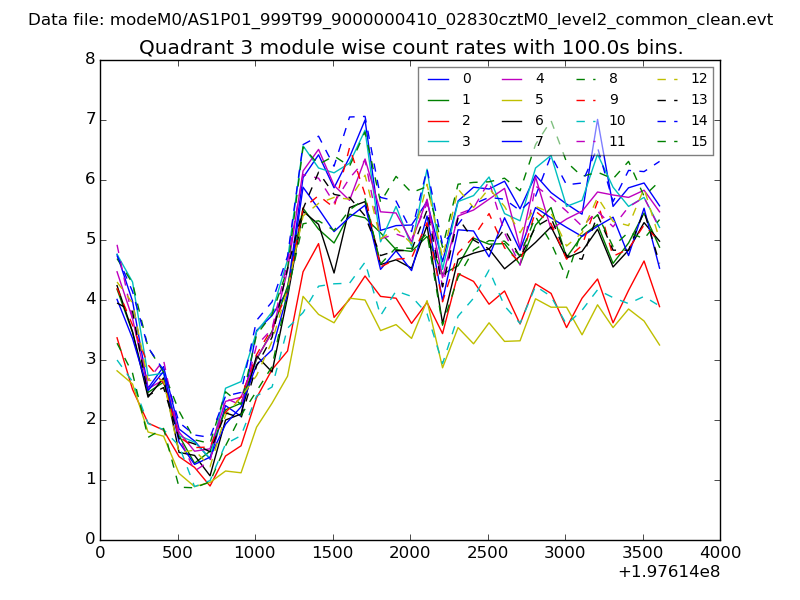
| Module-wise count rates for Quadrant C Data is divided into 100 sec bins |
 |
 |
| Module-wise count rates for Quadrant D Data is divided into 100 sec bins |
 |
 |
| Parameter | Plot |
|---|---|
| CZT HV Monitor | 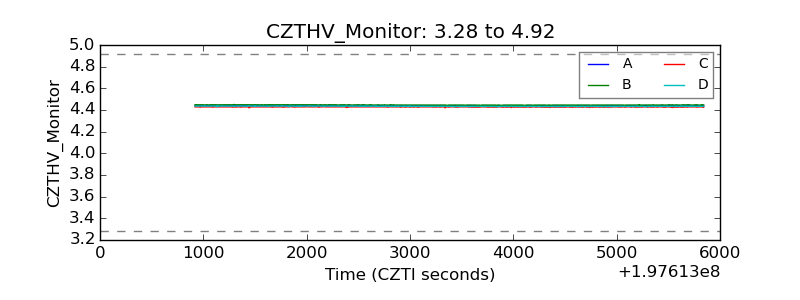 |
| D_VDD | 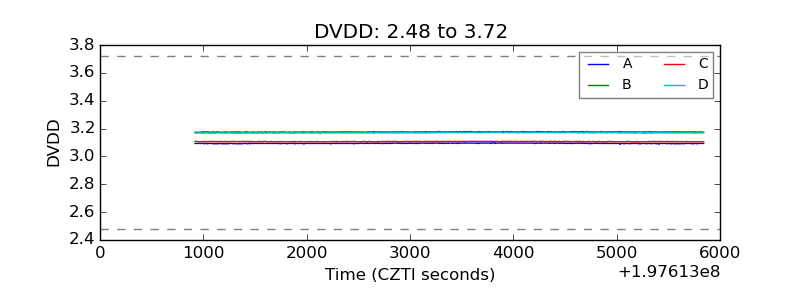 |
| Temperature 1 | 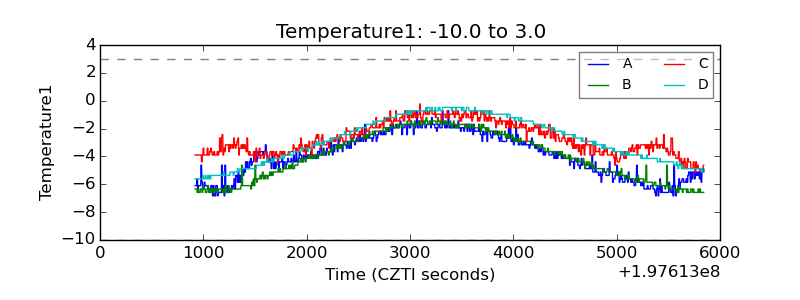 |
| Veto HV Monitor | 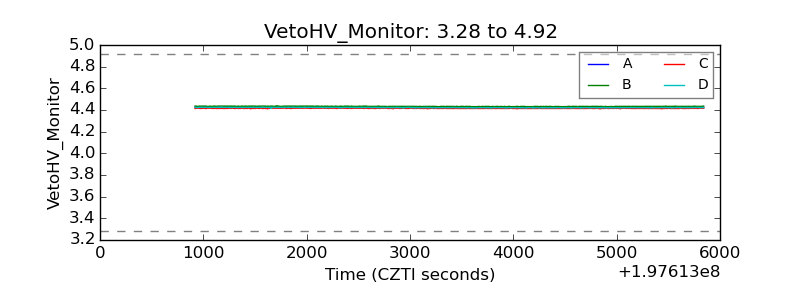 |
| Veto LLD | 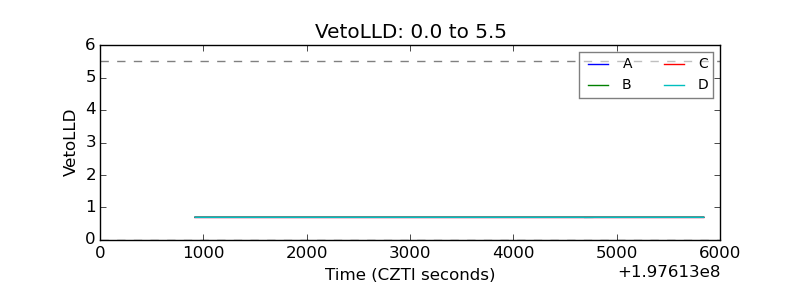 |
| Alpha Counter | 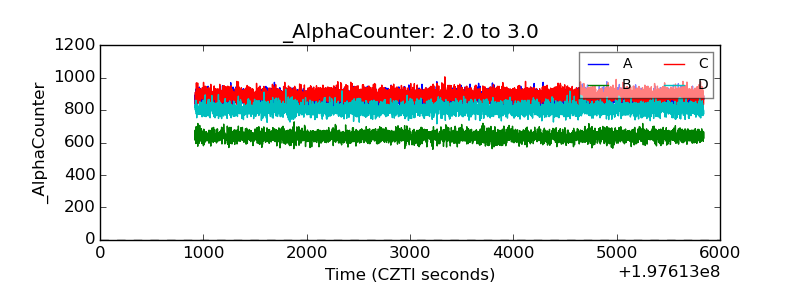 |
| _CPM_Rate | 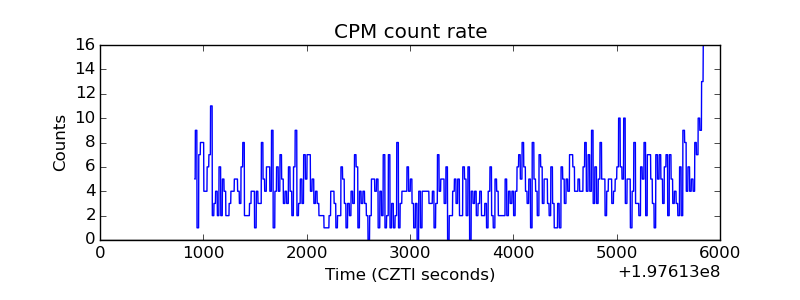 |
| CZT Counter | 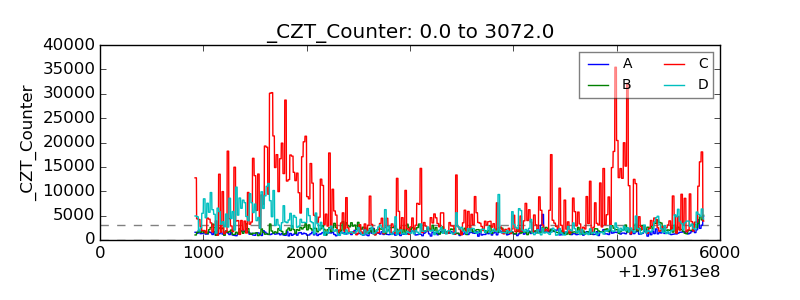 |
| +2.5 Volts monitor |  |
| +5 Volts monitor | 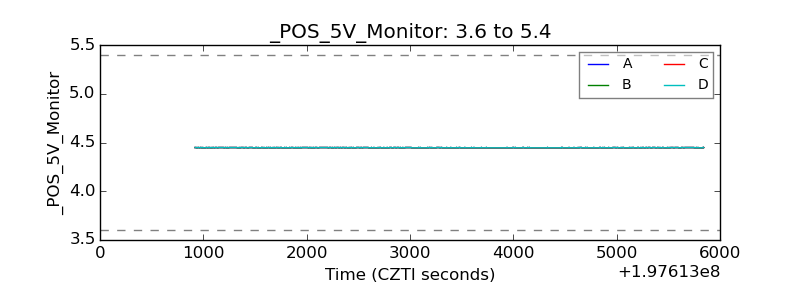 |
| Veto Counter | 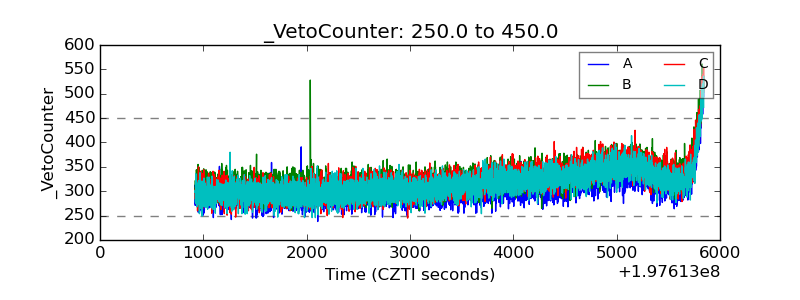 |