| Param | Original file | Final file |
|---|---|---|
| Filename | modeM0/AS1P01_999T99_9000000410_02832cztM0_level2.evt | modeM0/AS1P01_999T99_9000000410_02832cztM0_level2_quad_clean.evt |
| Size (bytes) | 754,398,720 | 57,119,040 |
| Size | 719.5 MB | 54.5 MB |
| Events in quadrant A | 2,697,279 | 391,680 |
| Events in quadrant B | 5,599,574 | 351,633 |
| Events in quadrant C | 5,658,382 | 352,829 |
| Events in quadrant D | 8,541,042 | 267,419 |
| Mode SS | |||
|---|---|---|---|
| Quadrant | BADHDUFLAG | Total packets | Discarded packets |
| A | 0 | 108 | 0 |
| B | 0 | 108 | 0 |
| C | 0 | 108 | 0 |
| D | 0 | 108 | 0 |
| Mode M9 | |||
|---|---|---|---|
| Quadrant | BADHDUFLAG | Total packets | Discarded packets |
| A | 0 | 21 | 0 |
| B | 0 | 21 | 0 |
| C | 0 | 21 | 0 |
| D | 0 | 21 | 0 |
| Mode M0 | |||
|---|---|---|---|
| Quadrant | BADHDUFLAG | Total packets | Discarded packets |
| A | 0 | 11698 | 3 |
| B | 0 | 20171 | 2 |
| C | 0 | 20369 | 2 |
| D | 0 | 29023 | 2 |
| Quadrant | Total seconds | Saturated seconds | Saturation percentage |
|---|---|---|---|
| A | 5232 | 125 | 2.389144% |
| B | 5188 | 886 | 17.077872% |
| C | 5208 | 1193 | 22.907066% |
| D | 5151 | 2611 | 50.689187% |
Noise dominated data is calculated using 1-second bins in cleaned event files. If a bin has >2000 counts, and if more than 50% of those come from <1% of pixels, then it is considered to be noise-dominated and hence unusable.
| Quadrant | # 1 sec bins | Bins with >0 counts | Bins with >2000 counts | High rate bins dominated by noise | Noise dominated (total time) | Noise dominated (detector-on time) | Marked lightcurve |
|---|---|---|---|---|---|---|---|
| A | 7387 | 5233 | 91 | 91 | 1.23% | 1.74% |  |
| B | 7387 | 5190 | 561 | 561 | 7.59% | 10.81% | 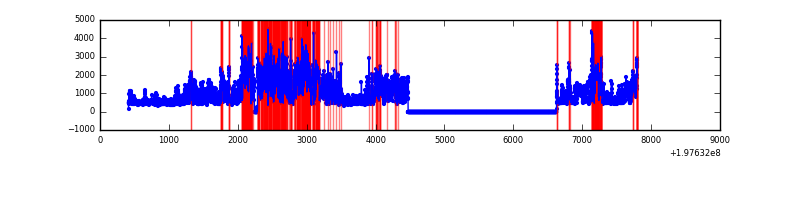 |
| C | 7387 | 5209 | 820 | 820 | 11.10% | 15.74% | 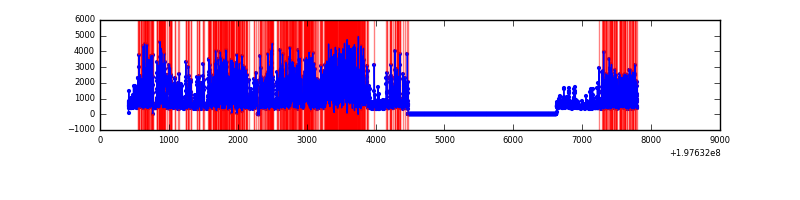 |
| D | 7387 | 5151 | 1811 | 1811 | 24.52% | 35.16% | 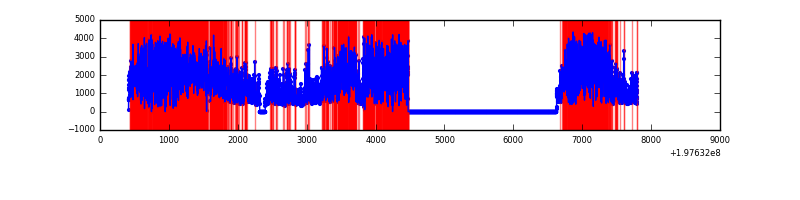 |
Top three noisy pixels from each quadrant. If the there are fewer than three noisy pixels in the level2.evt file, extra rows are filled as -1
| Pixel properties | Quadrant properties | ||||||
|---|---|---|---|---|---|---|---|
| Quadrant | DetID | PixID | Counts | Sigma | Mean | Median | Sigma |
| A | 0 | 5 | 342263 | 2934.17 | 564 | 552 | 116.5 |
| A | 0 | 13 | 81882 | 698.36 | 564 | 552 | 116.5 |
| A | 0 | 31 | 41091 | 348.1 | 564 | 552 | 116.5 |
| B | 0 | 4 | 1106881 | 10647.76 | 533 | 522 | 103.9 |
| B | 0 | 167 | 799376 | 7688.29 | 533 | 522 | 103.9 |
| B | 0 | 189 | 419268 | 4030.07 | 533 | 522 | 103.9 |
| C | 0 | 219 | 3225426 | 27767.98 | 490 | 492 | 116.1 |
| C | 1 | 16 | 135682 | 1164.04 | 490 | 492 | 116.1 |
| C | 1 | 192 | 114200 | 979.07 | 490 | 492 | 116.1 |
| D | 0 | 226 | 3457246 | 35295.79 | 394 | 385 | 97.9 |
| D | 1 | 66 | 2269105 | 23164.44 | 394 | 385 | 97.9 |
| D | 1 | 83 | 511059 | 5214.16 | 394 | 385 | 97.9 |
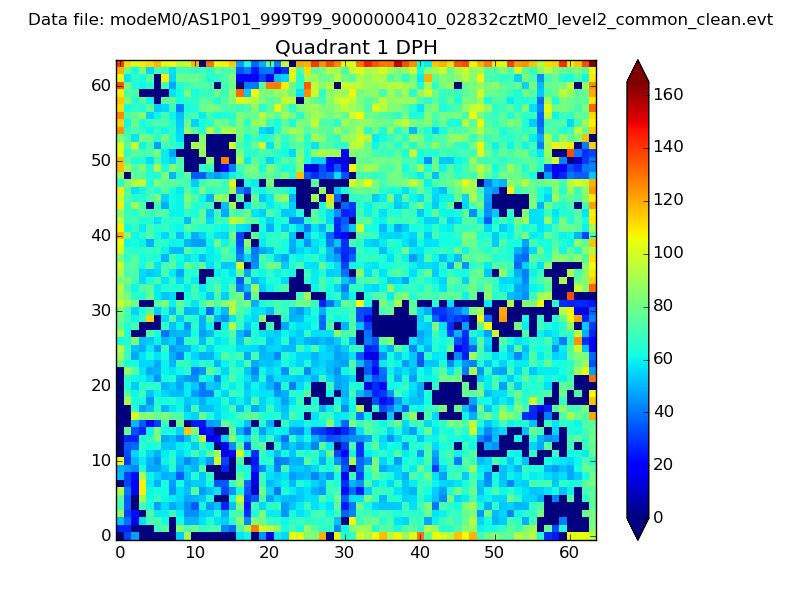
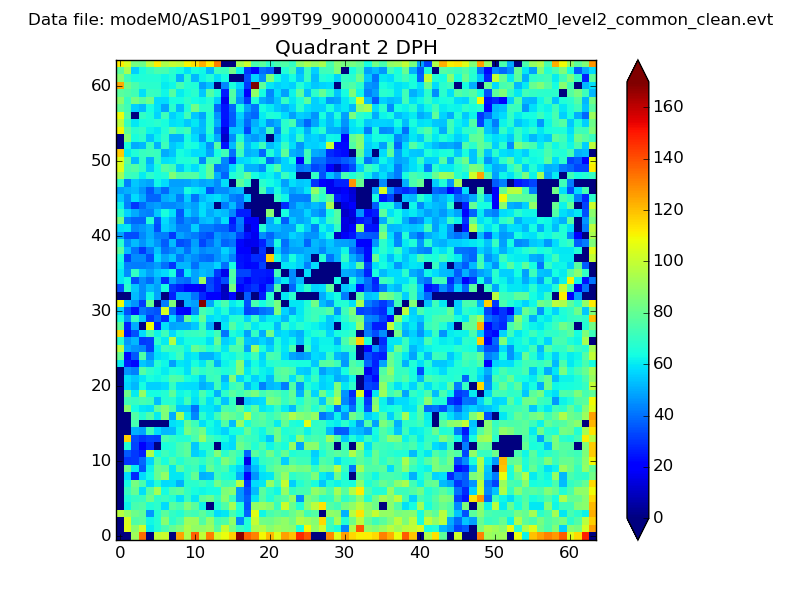
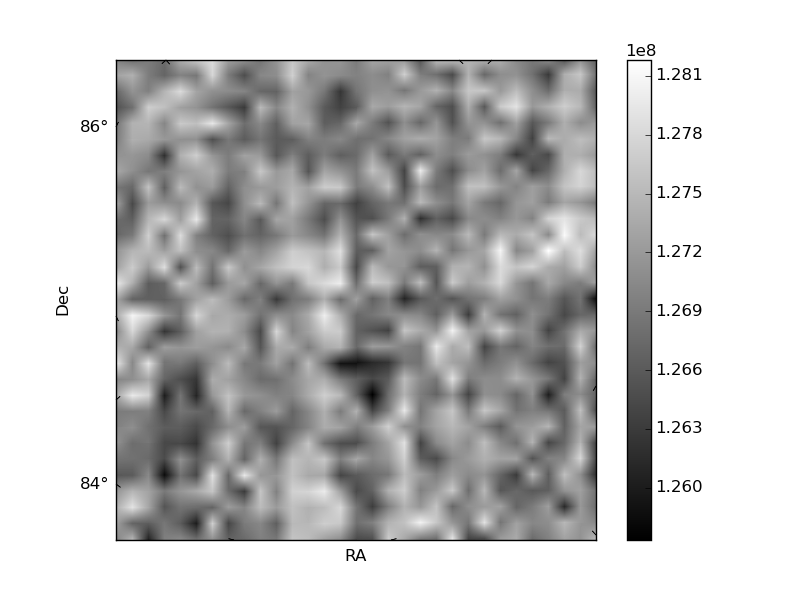
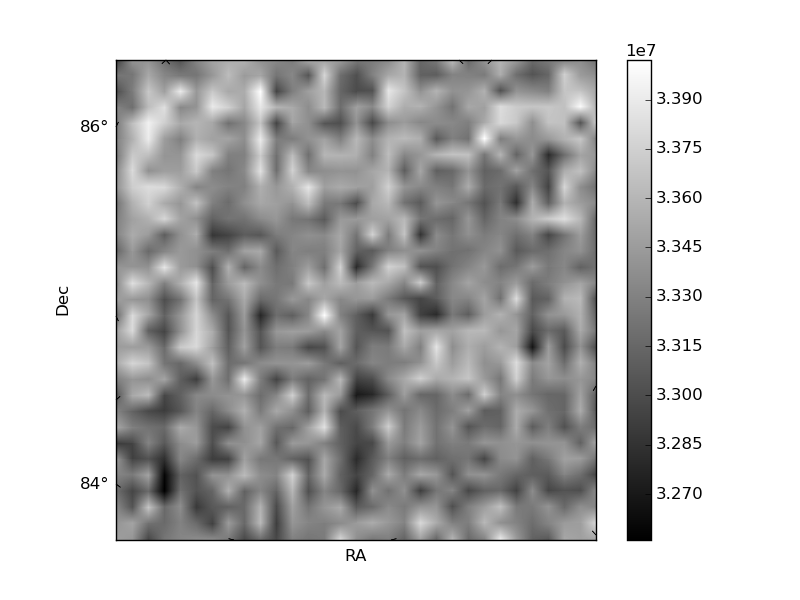
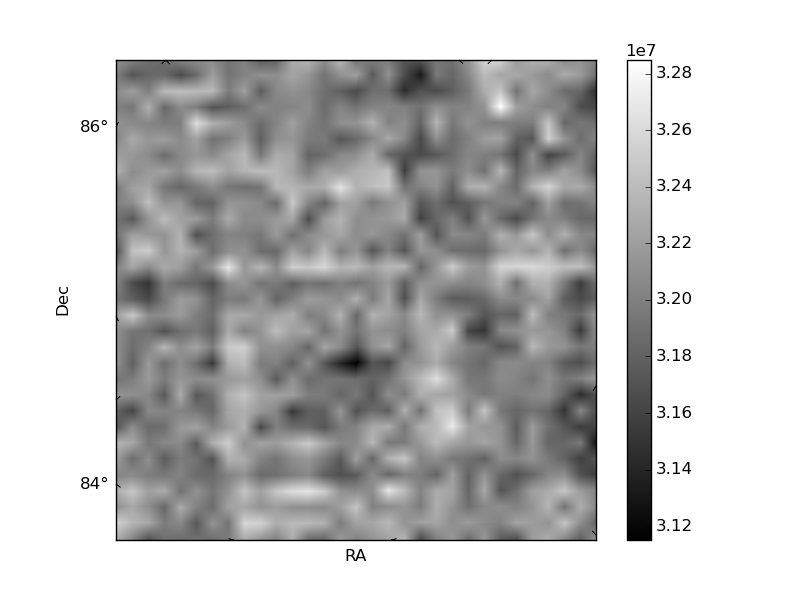
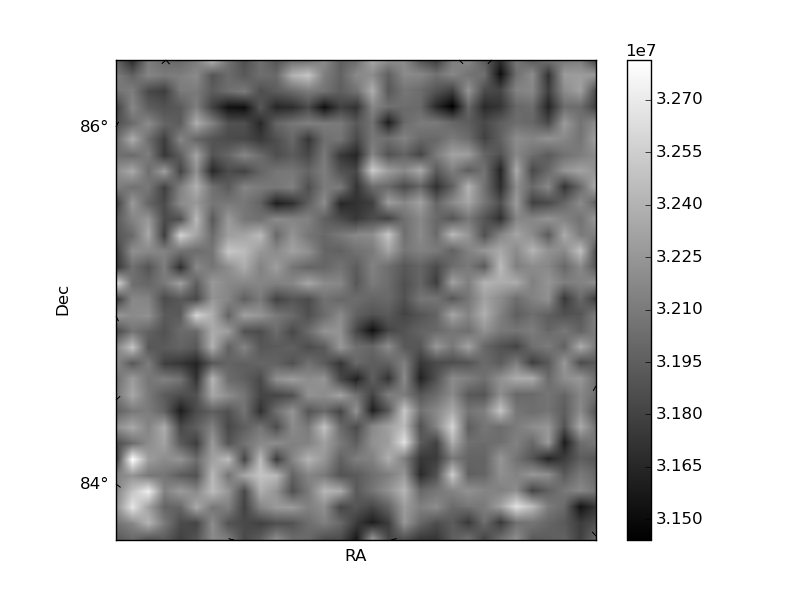
Histogram calculated using DETX and DETY for each event in the final _common_clean file
| Quadrant A | 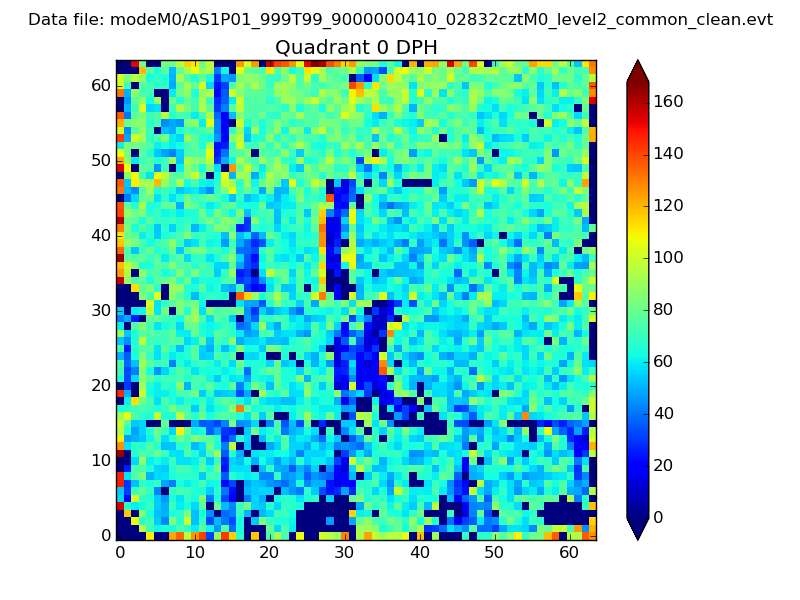 |
 |
Quadrant B |
|---|---|---|---|
| Quadrant D | 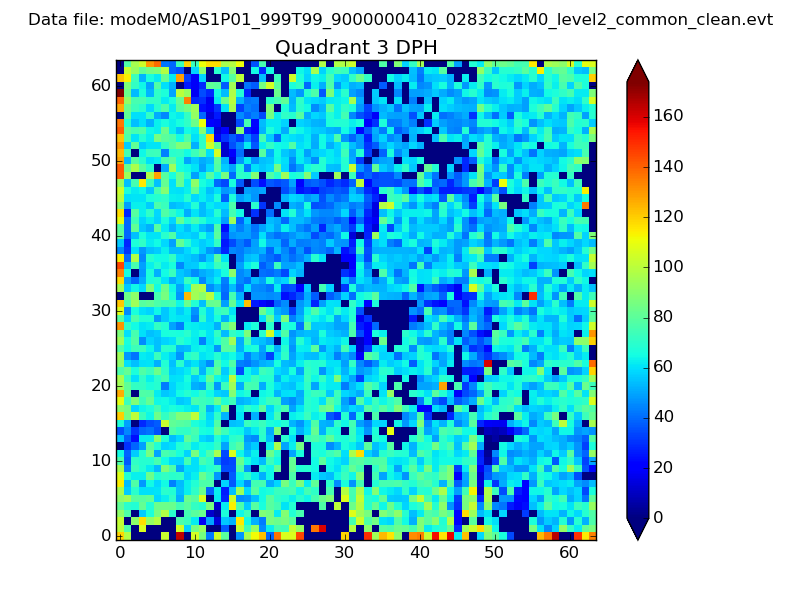 |
 |
Quadrant C |
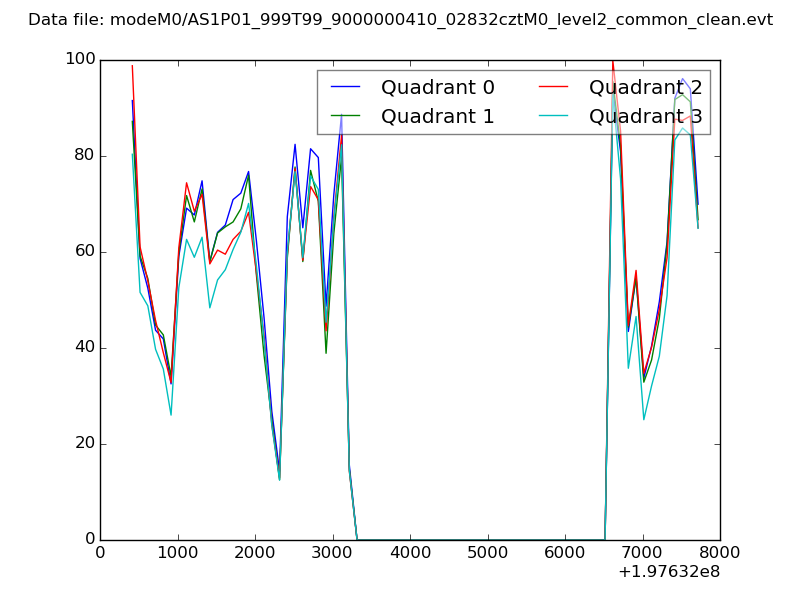
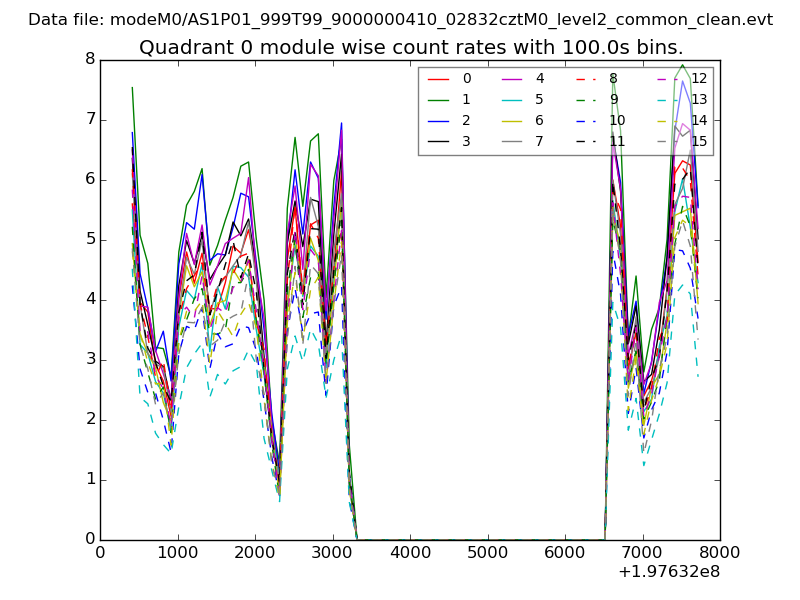
| Plot type | Count rate plots | Images |
|---|---|---|
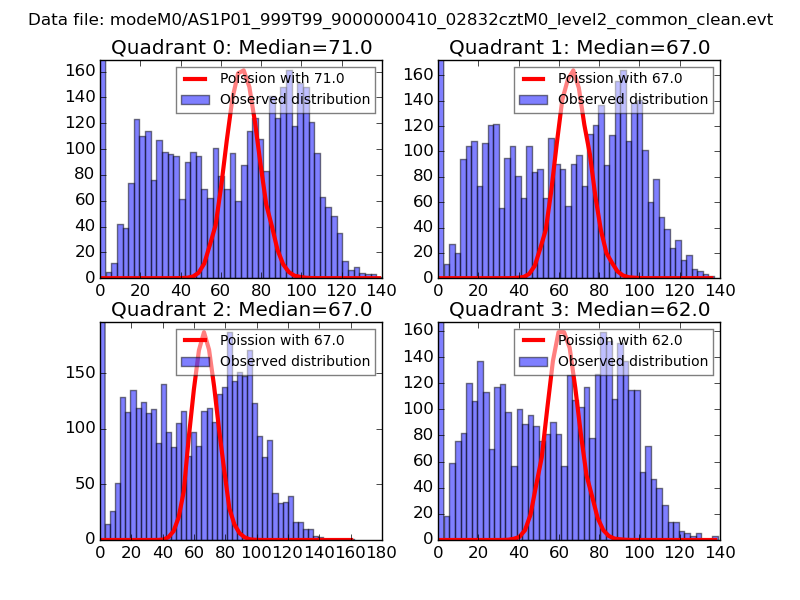
| Comparison with Poisson distribution Blue bars denote a histogram of data divided into 1 sec bins. Red curve is a Poisson curve with rate = median count rate of data. |
 |
 |
| Quadrant-wise count rates Data is divided into 100 sec bins |
 |
|
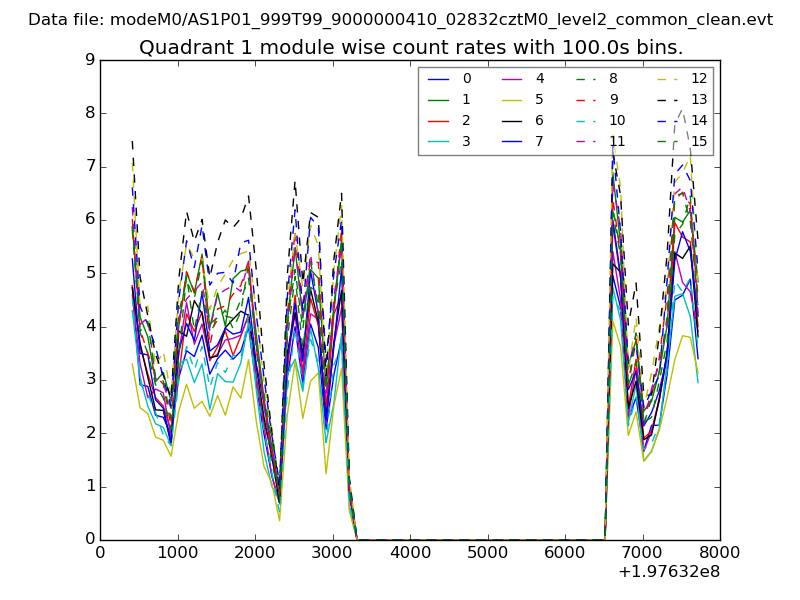
| Module-wise count rates for Quadrant A Data is divided into 100 sec bins |
 |
 |
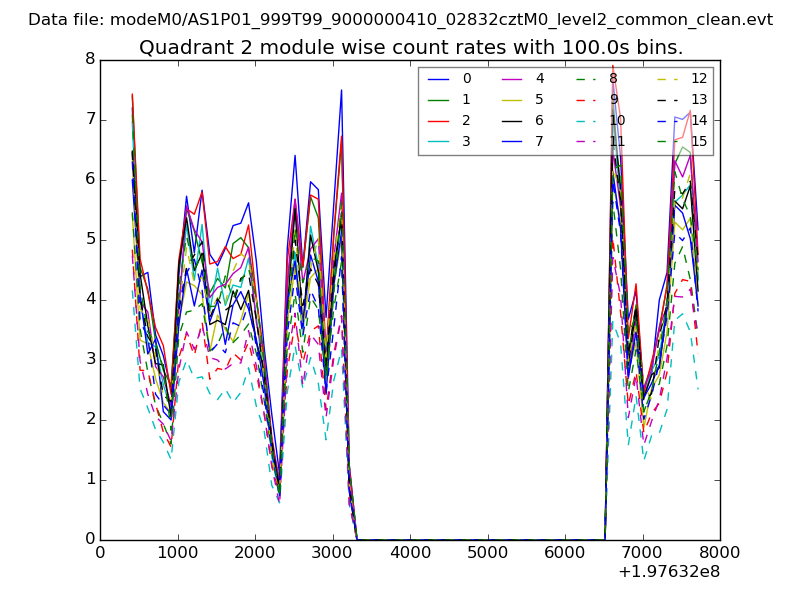
| Module-wise count rates for Quadrant B Data is divided into 100 sec bins |
 |
 |
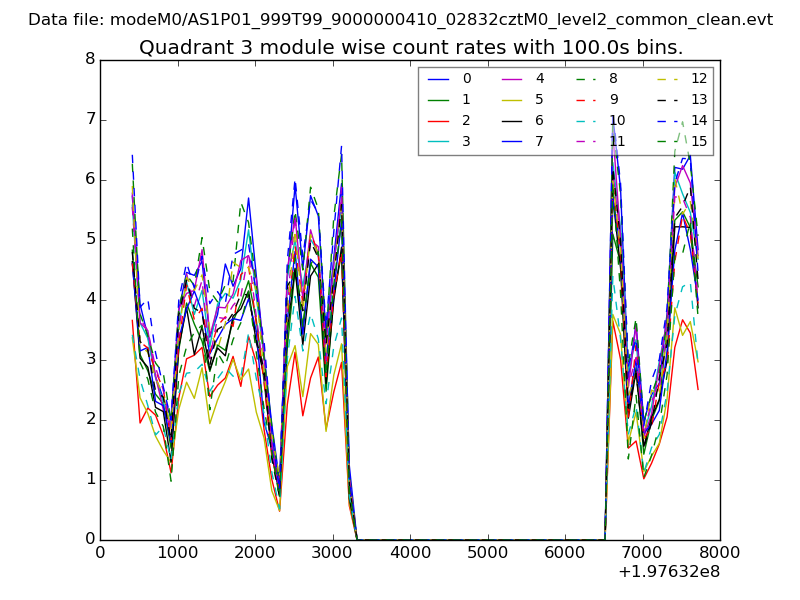
| Module-wise count rates for Quadrant C Data is divided into 100 sec bins |
 |
 |
| Module-wise count rates for Quadrant D Data is divided into 100 sec bins |
 |
 |
| Parameter | Plot |
|---|---|
| CZT HV Monitor | 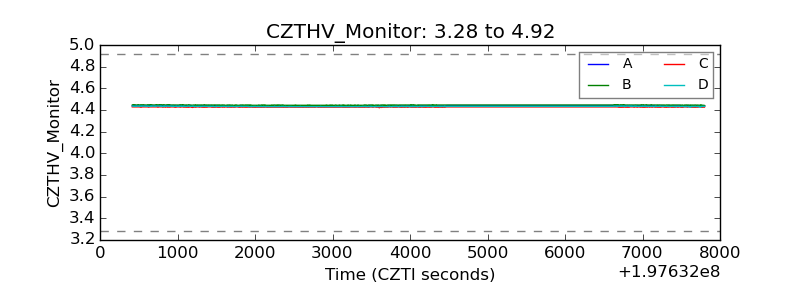 |
| D_VDD | 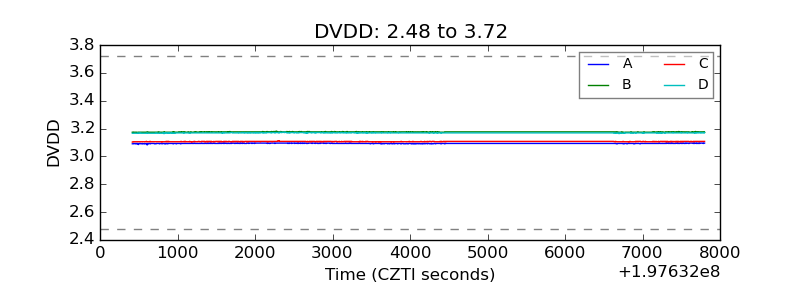 |
| Temperature 1 | 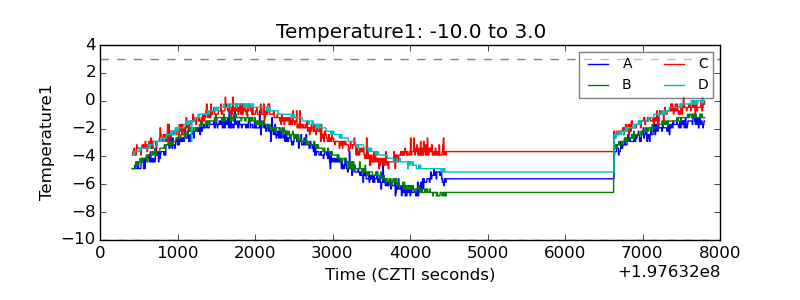 |
| Veto HV Monitor | 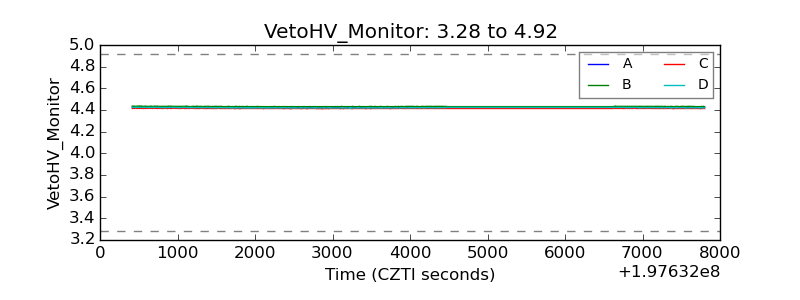 |
| Veto LLD | 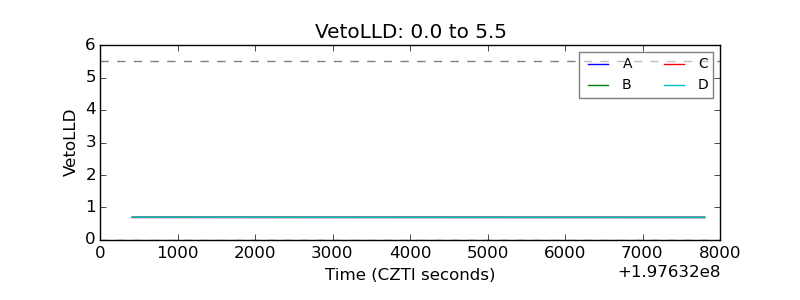 |
| Alpha Counter | 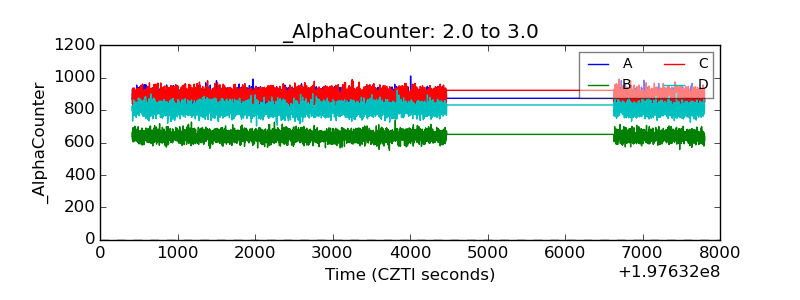 |
| _CPM_Rate | 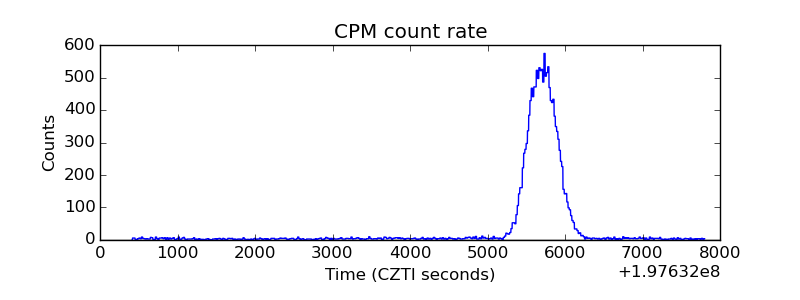 |
| CZT Counter | 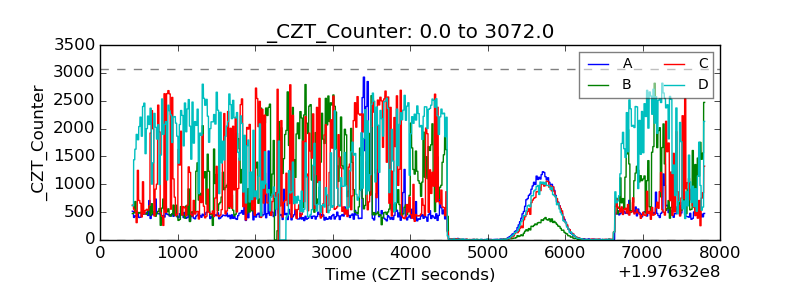 |
| +2.5 Volts monitor |  |
| +5 Volts monitor |  |
| Veto Counter | 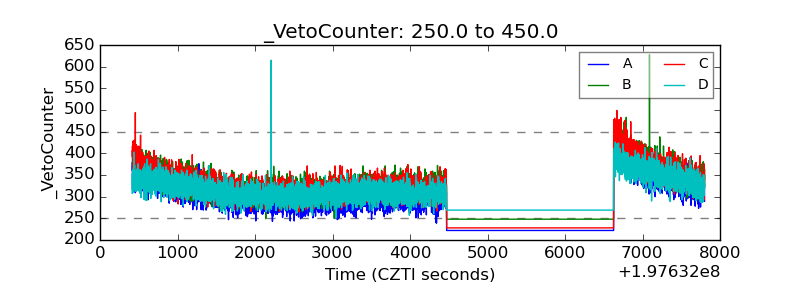 |