| Param | Original file | Final file |
|---|---|---|
| Filename | modeM0/AS1P01_999T99_9000000410_02835cztM0_level2.evt | modeM0/AS1P01_999T99_9000000410_02835cztM0_level2_quad_clean.evt |
| Size (bytes) | 701,913,600 | 49,919,040 |
| Size | 669.4 MB | 47.6 MB |
| Events in quadrant A | 2,620,297 | 312,854 |
| Events in quadrant B | 5,367,342 | 289,640 |
| Events in quadrant C | 5,516,793 | 291,807 |
| Events in quadrant D | 7,418,712 | 268,467 |
| Mode SS | |||
|---|---|---|---|
| Quadrant | BADHDUFLAG | Total packets | Discarded packets |
| A | 0 | 100 | 0 |
| B | 0 | 100 | 0 |
| C | 0 | 100 | 0 |
| D | 0 | 100 | 0 |
| Mode M9 | |||
|---|---|---|---|
| Quadrant | BADHDUFLAG | Total packets | Discarded packets |
| A | 0 | 22 | 0 |
| B | 0 | 22 | 0 |
| C | 0 | 22 | 0 |
| D | 0 | 22 | 0 |
| Mode M0 | |||
|---|---|---|---|
| Quadrant | BADHDUFLAG | Total packets | Discarded packets |
| A | 0 | 11263 | 2 |
| B | 0 | 19401 | 1 |
| C | 0 | 19730 | 1 |
| D | 0 | 25470 | 1 |
| Quadrant | Total seconds | Saturated seconds | Saturation percentage |
|---|---|---|---|
| A | 4963 | 107 | 2.155954% |
| B | 4963 | 625 | 12.593190% |
| C | 4963 | 1175 | 23.675196% |
| D | 4963 | 1748 | 35.220633% |
Noise dominated data is calculated using 1-second bins in cleaned event files. If a bin has >2000 counts, and if more than 50% of those come from <1% of pixels, then it is considered to be noise-dominated and hence unusable.
| Quadrant | # 1 sec bins | Bins with >0 counts | Bins with >2000 counts | High rate bins dominated by noise | Noise dominated (total time) | Noise dominated (detector-on time) | Marked lightcurve |
|---|---|---|---|---|---|---|---|
| A | 7119 | 4964 | 66 | 66 | 0.93% | 1.33% | 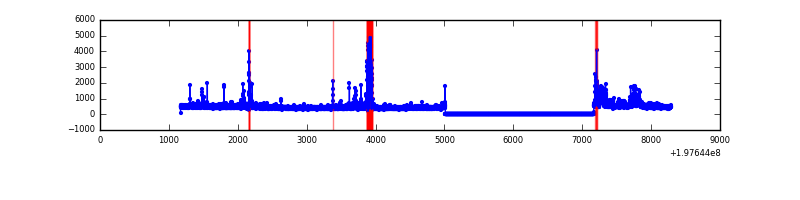 |
| B | 7119 | 4964 | 311 | 311 | 4.37% | 6.27% | 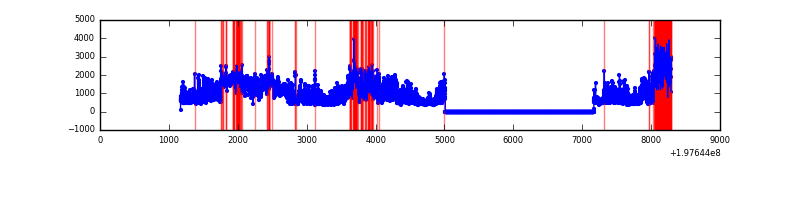 |
| C | 7119 | 4964 | 886 | 886 | 12.45% | 17.85% | 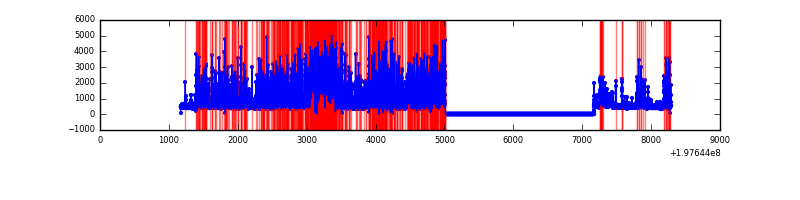 |
| D | 7119 | 4964 | 1325 | 1325 | 18.61% | 26.69% | 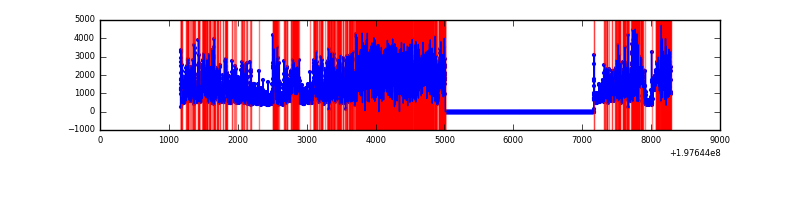 |
Top three noisy pixels from each quadrant. If the there are fewer than three noisy pixels in the level2.evt file, extra rows are filled as -1
| Pixel properties | Quadrant properties | ||||||
|---|---|---|---|---|---|---|---|
| Quadrant | DetID | PixID | Counts | Sigma | Mean | Median | Sigma |
| A | 0 | 5 | 295507 | 2687.15 | 539 | 527 | 109.8 |
| A | 0 | 13 | 84541 | 765.34 | 539 | 527 | 109.8 |
| A | 0 | 31 | 83357 | 754.55 | 539 | 527 | 109.8 |
| B | 0 | 168 | 701539 | 6859.24 | 528 | 517 | 102.2 |
| B | 0 | 219 | 535729 | 5236.85 | 528 | 517 | 102.2 |
| B | 0 | 229 | 456993 | 4466.45 | 528 | 517 | 102.2 |
| C | 0 | 219 | 3191086 | 28889.59 | 472 | 473 | 110.4 |
| C | 1 | 16 | 164815 | 1488.04 | 472 | 473 | 110.4 |
| C | 3 | 14 | 99806 | 899.42 | 472 | 473 | 110.4 |
| D | 0 | 226 | 2455813 | 22519.61 | 440 | 433 | 109.0 |
| D | 1 | 3 | 1572430 | 14417.63 | 440 | 433 | 109.0 |
| D | 1 | 4 | 657500 | 6026.31 | 440 | 433 | 109.0 |
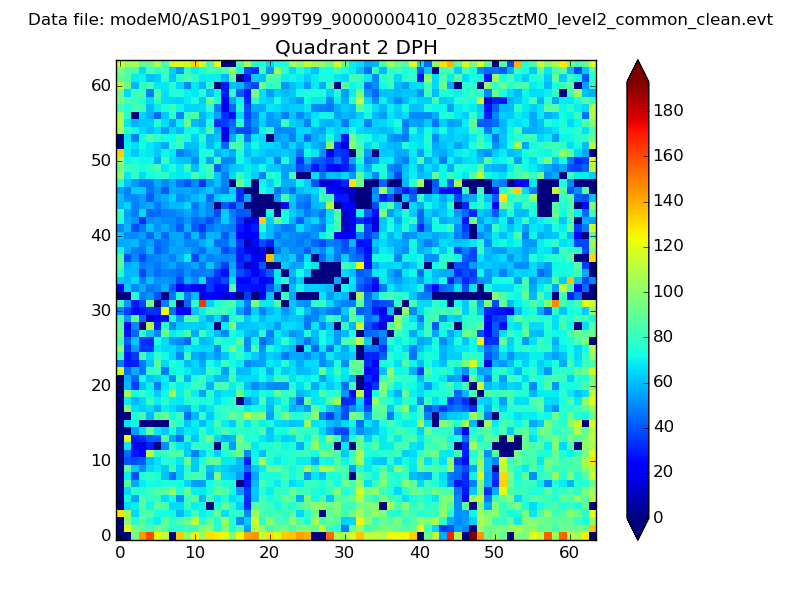
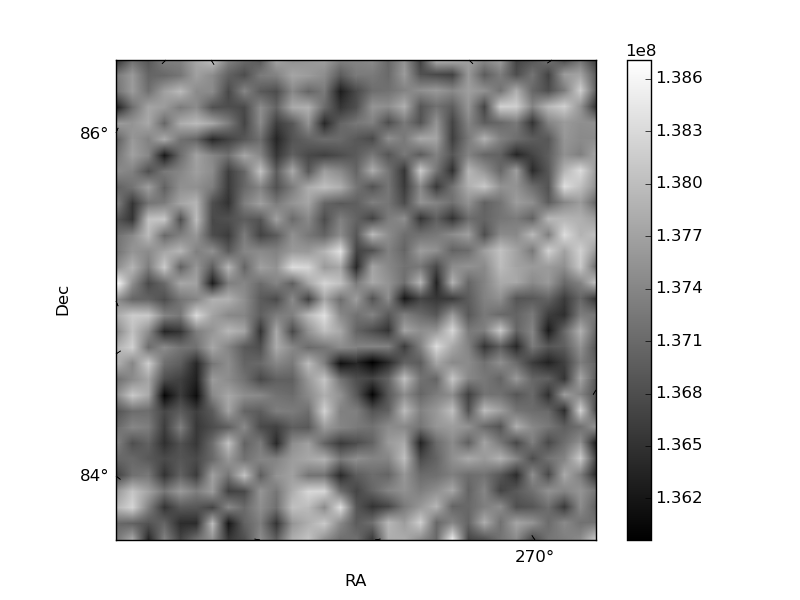
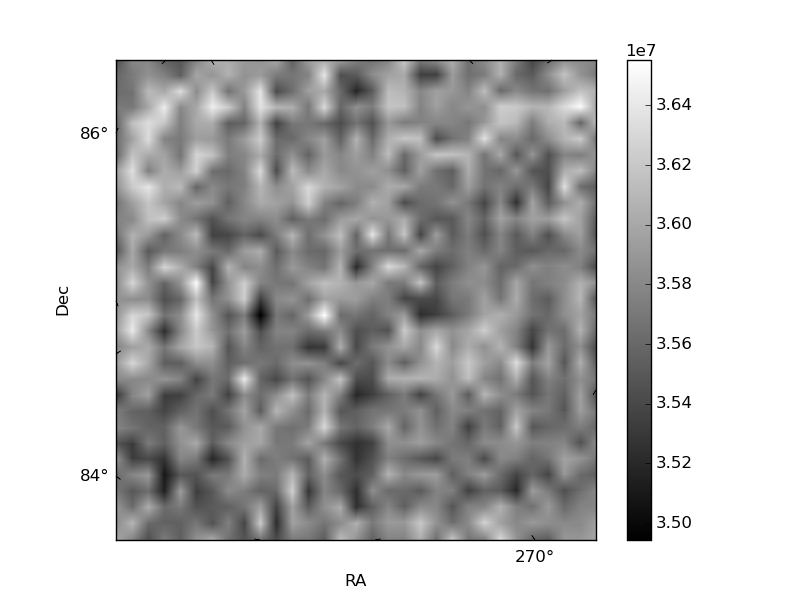
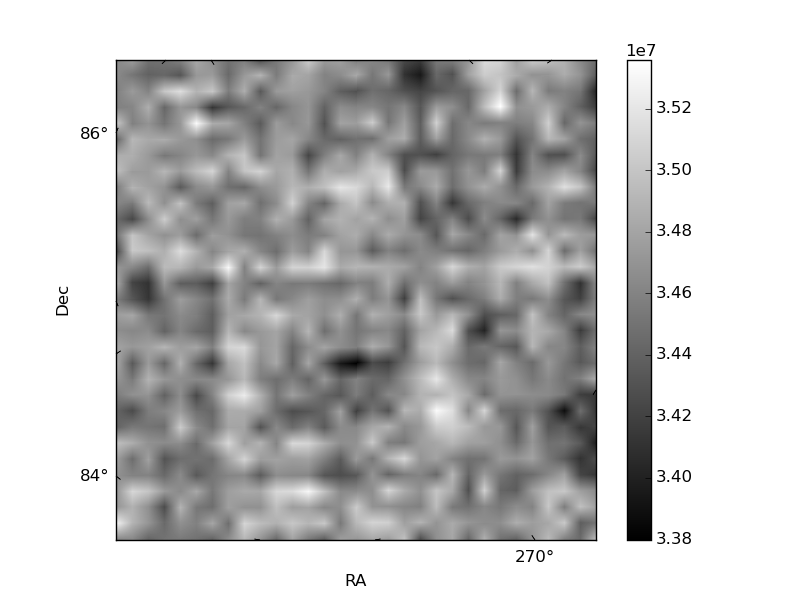
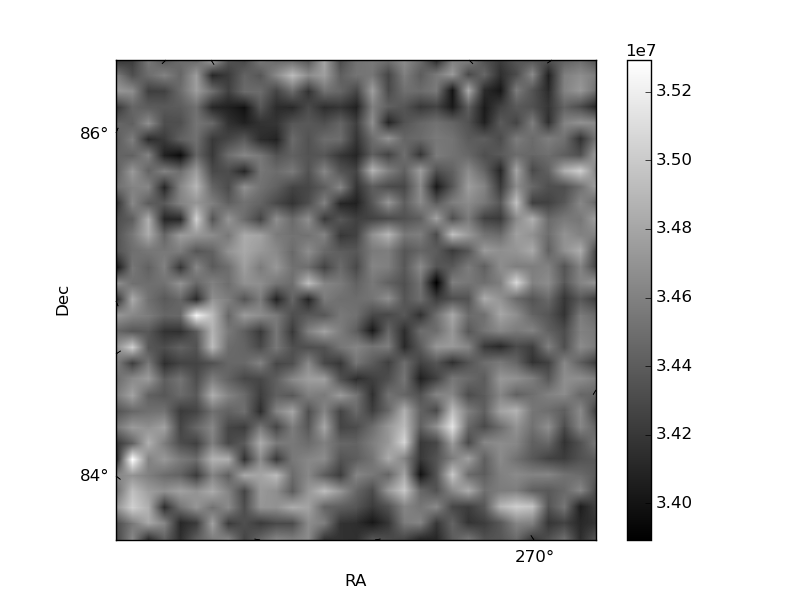
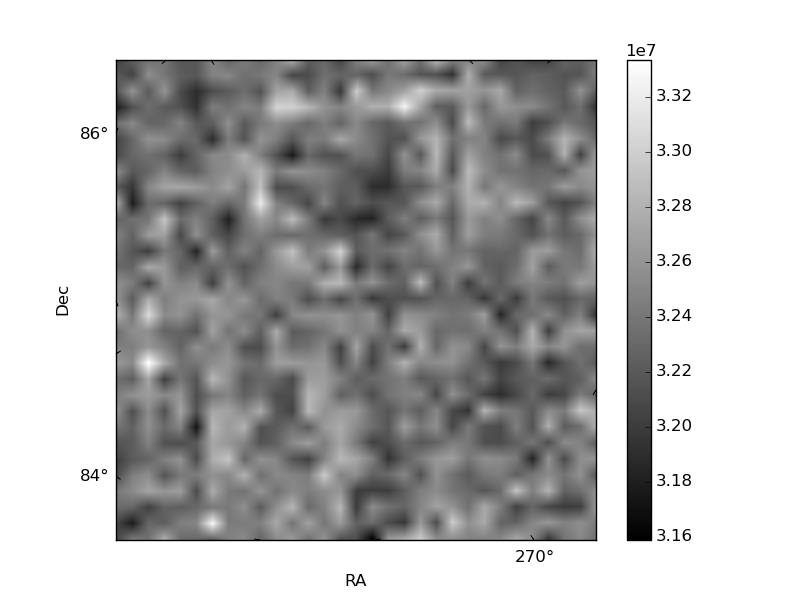
Histogram calculated using DETX and DETY for each event in the final _common_clean file
| Quadrant A | 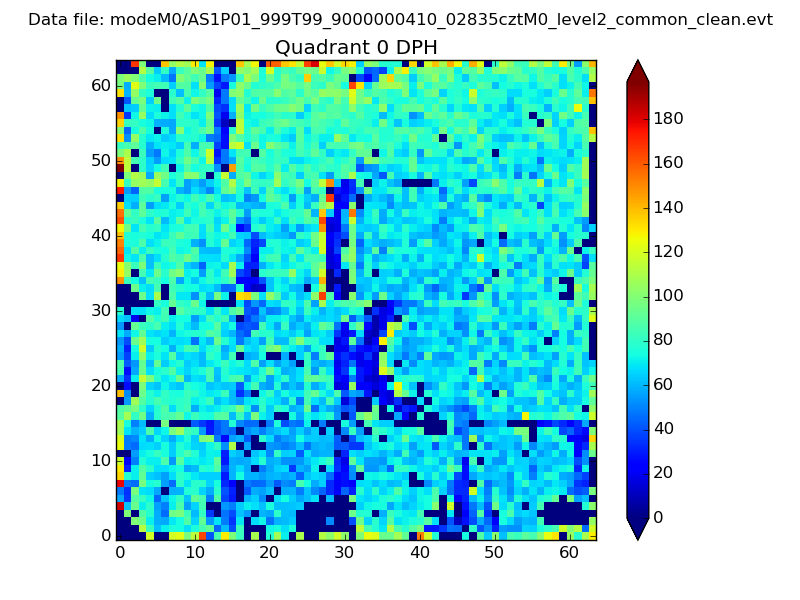 |
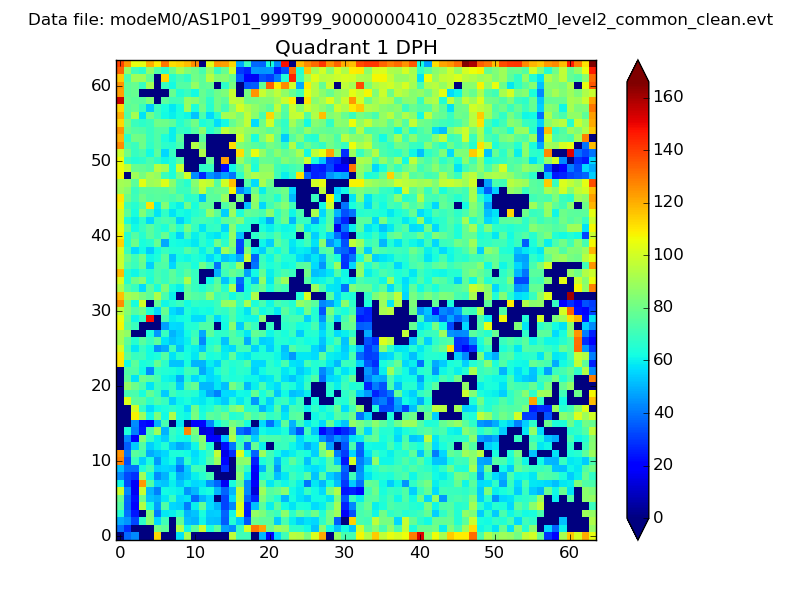 |
Quadrant B |
|---|---|---|---|
| Quadrant D | 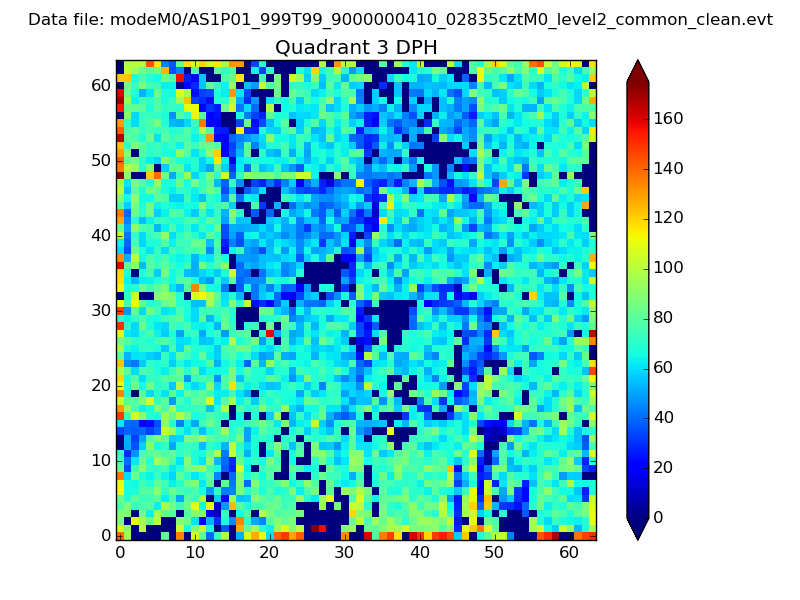 |
 |
Quadrant C |
| Plot type | Count rate plots | Images |
|---|---|---|
| Comparison with Poisson distribution Blue bars denote a histogram of data divided into 1 sec bins. Red curve is a Poisson curve with rate = median count rate of data. |
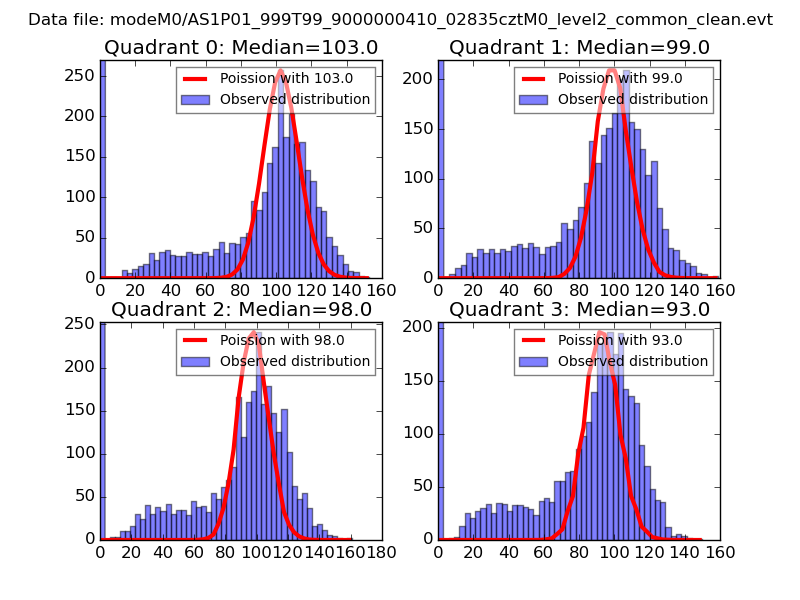 |
 |
| Quadrant-wise count rates Data is divided into 100 sec bins |
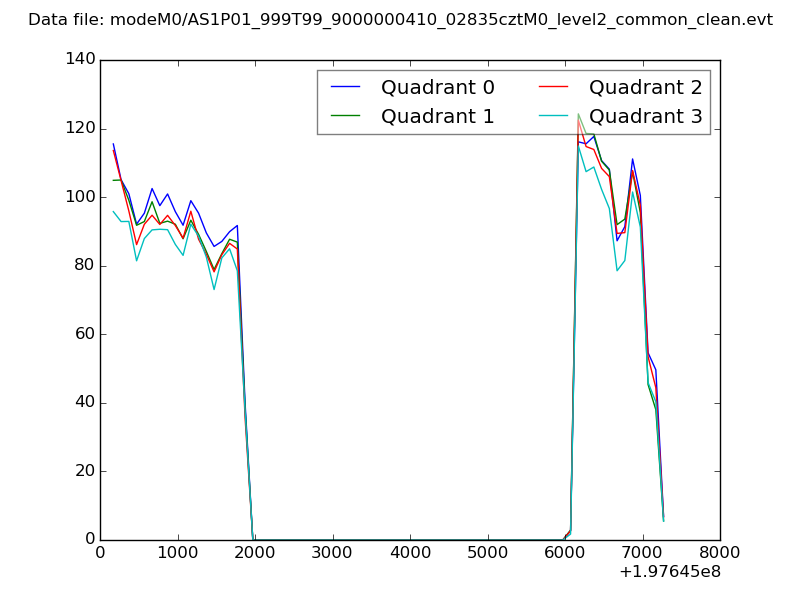 |
|
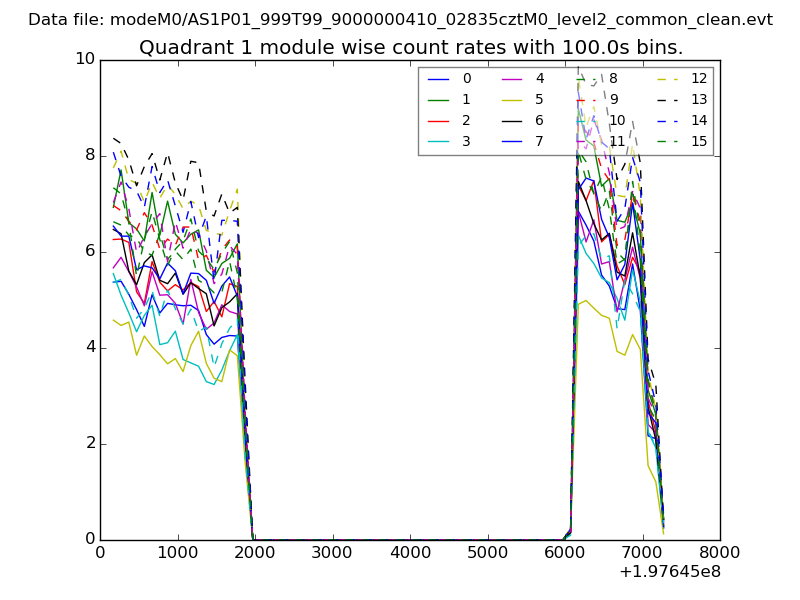
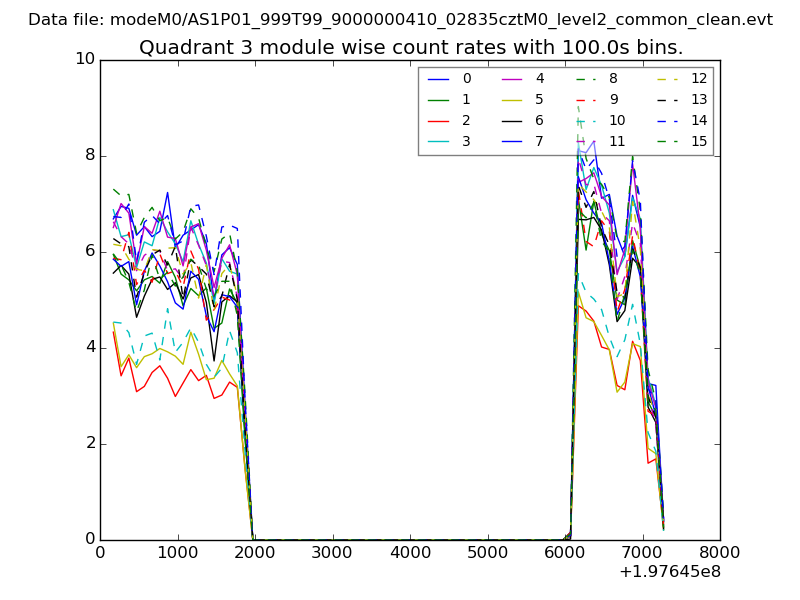
| Module-wise count rates for Quadrant A Data is divided into 100 sec bins |
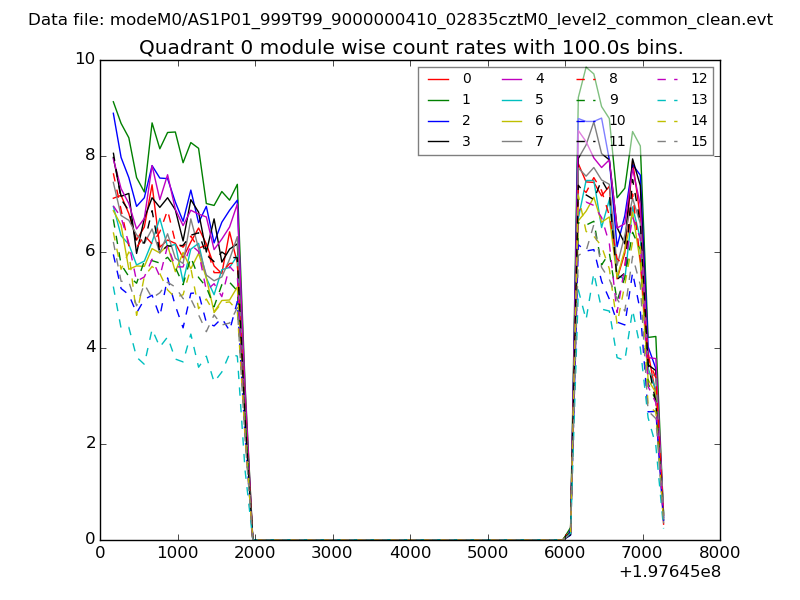 |
 |
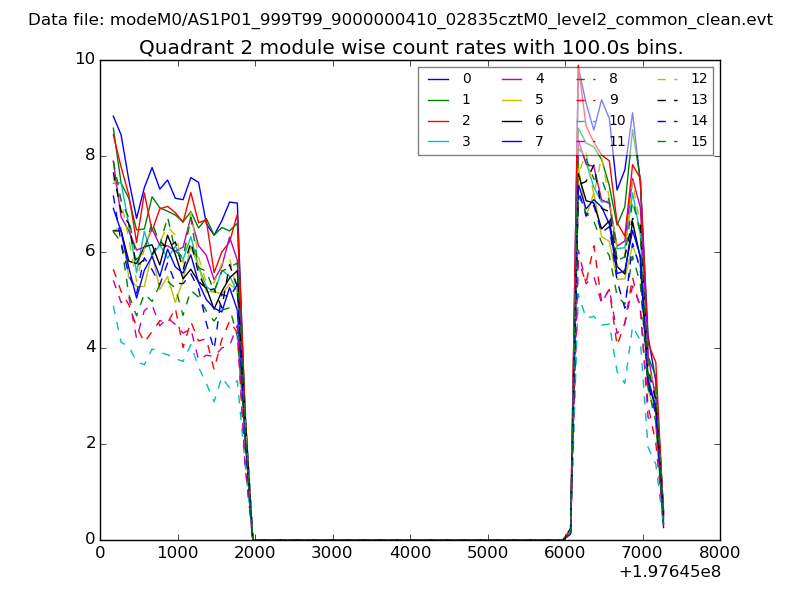
| Module-wise count rates for Quadrant B Data is divided into 100 sec bins |
 |
 |
| Module-wise count rates for Quadrant C Data is divided into 100 sec bins |
 |
 |
| Module-wise count rates for Quadrant D Data is divided into 100 sec bins |
 |
 |
| Parameter | Plot |
|---|---|
| CZT HV Monitor | 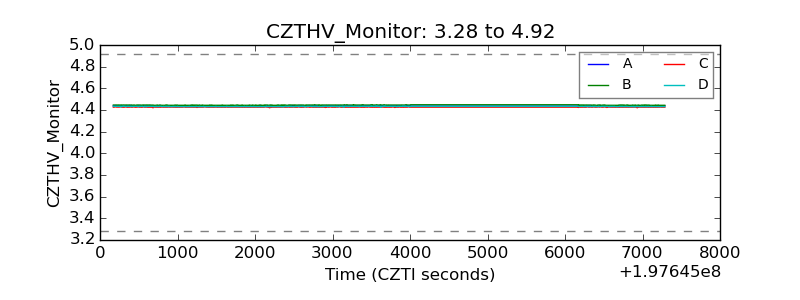 |
| D_VDD | 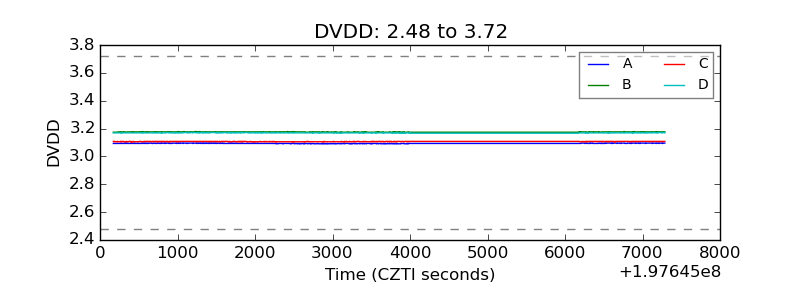 |
| Temperature 1 | 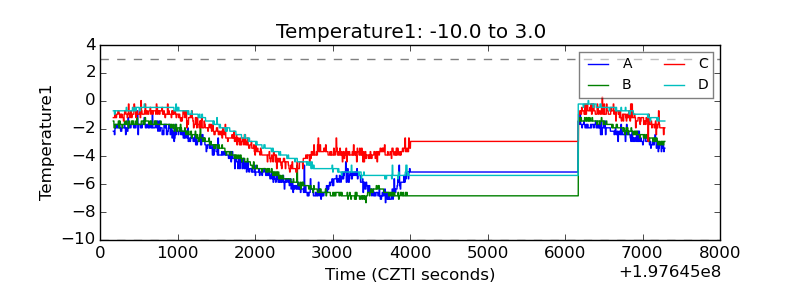 |
| Veto HV Monitor | 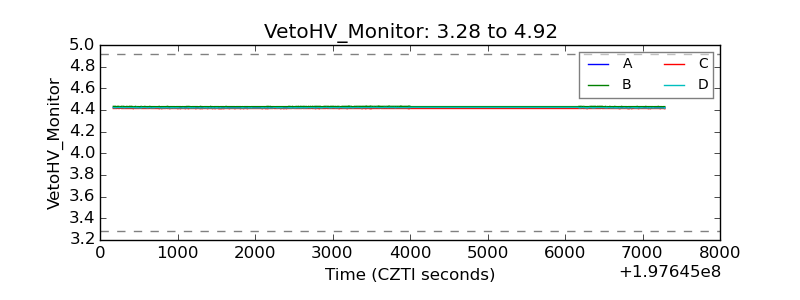 |
| Veto LLD | 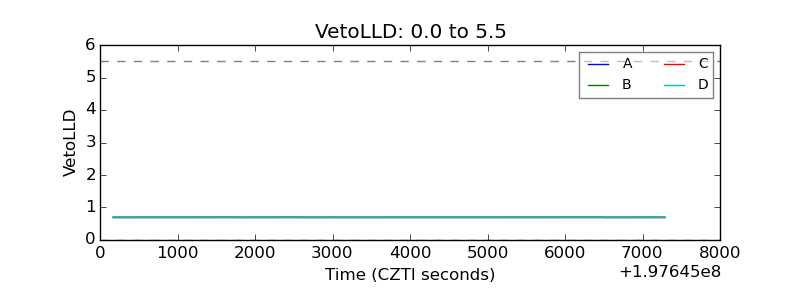 |
| Alpha Counter | 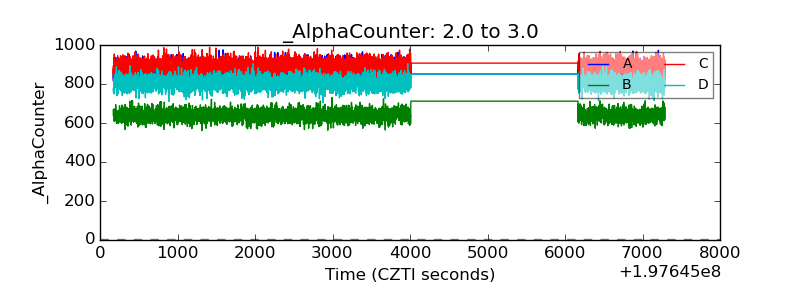 |
| _CPM_Rate | 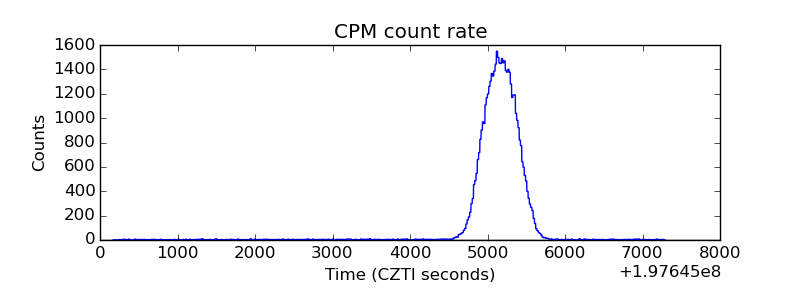 |
| CZT Counter | 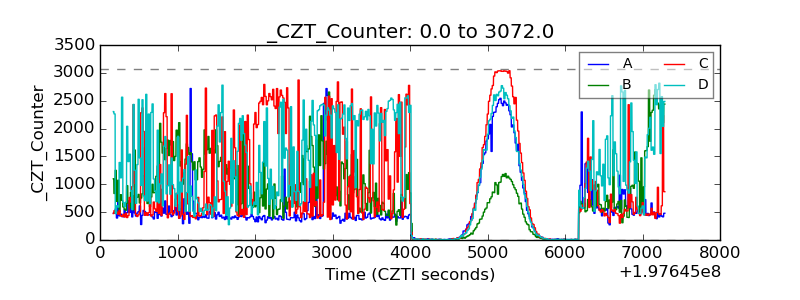 |
| +2.5 Volts monitor |  |
| +5 Volts monitor |  |
| Veto Counter | 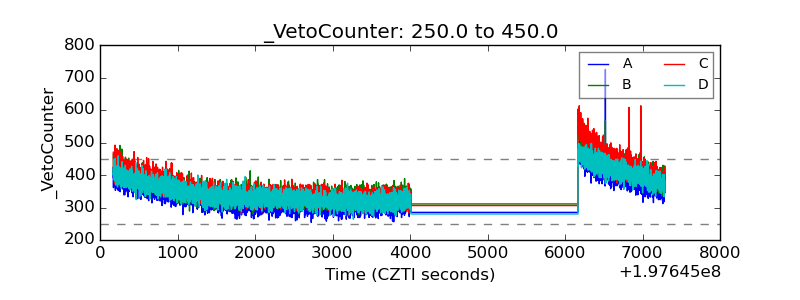 |