| Param | Original file | Final file |
|---|---|---|
| Filename | modeM0/AS1P01_999T99_9000000410_02836cztM0_level2.evt | modeM0/AS1P01_999T99_9000000410_02836cztM0_level2_quad_clean.evt |
| Size (bytes) | 722,099,520 | 49,423,680 |
| Size | 688.6 MB | 47.1 MB |
| Events in quadrant A | 2,683,413 | 312,626 |
| Events in quadrant B | 5,150,855 | 270,884 |
| Events in quadrant C | 5,258,239 | 299,271 |
| Events in quadrant D | 8,435,304 | 258,324 |
| Mode SS | |||
|---|---|---|---|
| Quadrant | BADHDUFLAG | Total packets | Discarded packets |
| A | 0 | 104 | 0 |
| B | 0 | 104 | 0 |
| C | 0 | 104 | 0 |
| D | 0 | 104 | 0 |
| Mode M9 | |||
|---|---|---|---|
| Quadrant | BADHDUFLAG | Total packets | Discarded packets |
| A | 0 | 27 | 0 |
| B | 0 | 27 | 0 |
| C | 0 | 27 | 0 |
| D | 0 | 28 | 0 |
| Mode M0 | |||
|---|---|---|---|
| Quadrant | BADHDUFLAG | Total packets | Discarded packets |
| A | 0 | 11583 | 3 |
| B | 0 | 18761 | 2 |
| C | 0 | 18953 | 2 |
| D | 0 | 28510 | 2 |
| Quadrant | Total seconds | Saturated seconds | Saturation percentage |
|---|---|---|---|
| A | 5049 | 34 | 0.673401% |
| B | 5049 | 746 | 14.775203% |
| C | 5049 | 984 | 19.489008% |
| D | 5049 | 2496 | 49.435532% |
Noise dominated data is calculated using 1-second bins in cleaned event files. If a bin has >2000 counts, and if more than 50% of those come from <1% of pixels, then it is considered to be noise-dominated and hence unusable.
| Quadrant | # 1 sec bins | Bins with >0 counts | Bins with >2000 counts | High rate bins dominated by noise | Noise dominated (total time) | Noise dominated (detector-on time) | Marked lightcurve |
|---|---|---|---|---|---|---|---|
| A | 7205 | 5050 | 21 | 21 | 0.29% | 0.42% | 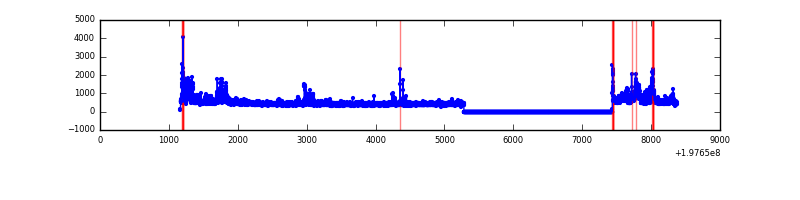 |
| B | 7205 | 5050 | 601 | 601 | 8.34% | 11.90% | 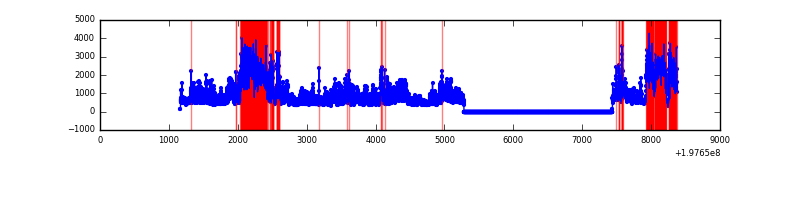 |
| C | 7205 | 5048 | 690 | 690 | 9.58% | 13.67% | 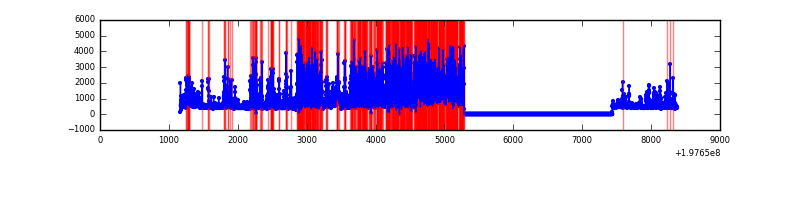 |
| D | 7205 | 5048 | 1879 | 1879 | 26.08% | 37.22% | 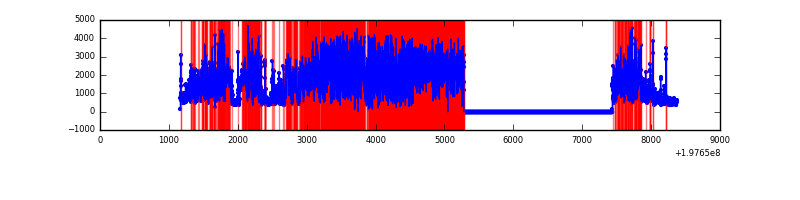 |
Top three noisy pixels from each quadrant. If the there are fewer than three noisy pixels in the level2.evt file, extra rows are filled as -1
| Pixel properties | Quadrant properties | ||||||
|---|---|---|---|---|---|---|---|
| Quadrant | DetID | PixID | Counts | Sigma | Mean | Median | Sigma |
| A | 0 | 5 | 207945 | 1837.86 | 559 | 548 | 112.8 |
| A | 0 | 31 | 159887 | 1411.99 | 559 | 548 | 112.8 |
| A | 0 | 143 | 81236 | 715.02 | 559 | 548 | 112.8 |
| B | 0 | 4 | 1510548 | 14988.86 | 528 | 517 | 100.7 |
| B | 0 | 168 | 832427 | 8257.7 | 528 | 517 | 100.7 |
| B | 0 | 173 | 158175 | 1564.94 | 528 | 517 | 100.7 |
| C | 0 | 219 | 2192320 | 18318.34 | 515 | 517 | 119.7 |
| C | 1 | 16 | 556318 | 4645.19 | 515 | 517 | 119.7 |
| C | 3 | 14 | 157623 | 1313.04 | 515 | 517 | 119.7 |
| D | 0 | 226 | 2908357 | 28676.48 | 407 | 399 | 101.4 |
| D | 1 | 4 | 1851584 | 18255.24 | 407 | 399 | 101.4 |
| D | 1 | 66 | 1093610 | 10780.57 | 407 | 399 | 101.4 |
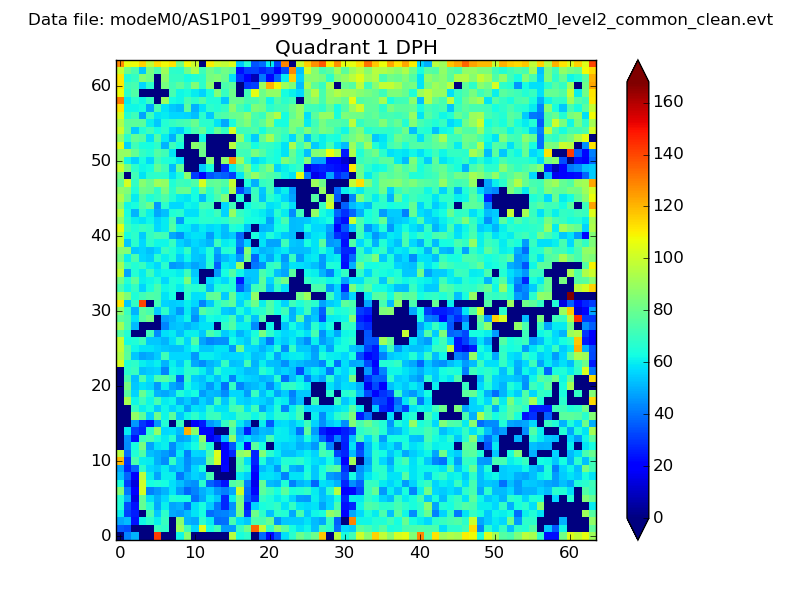
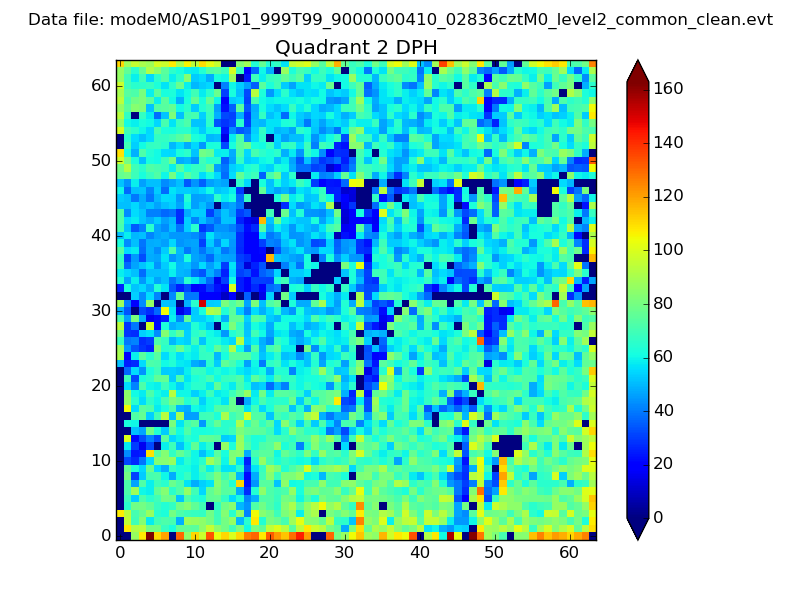
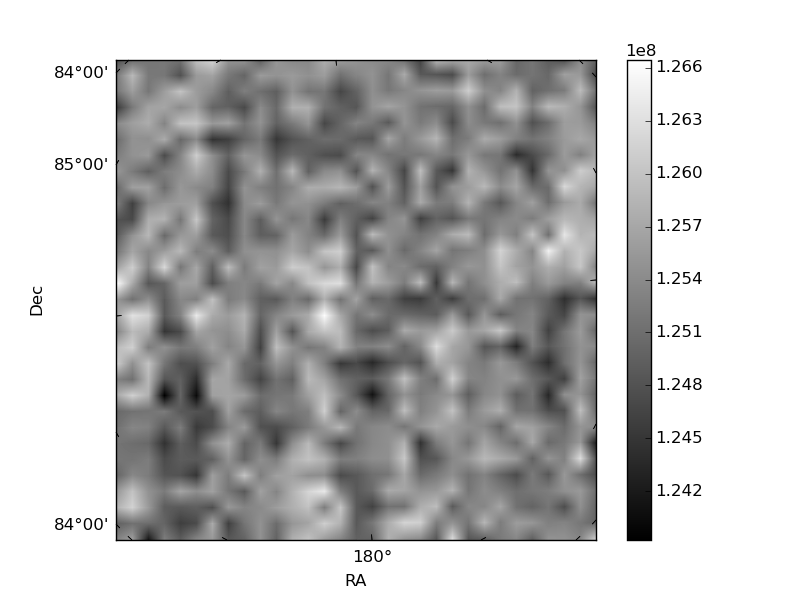
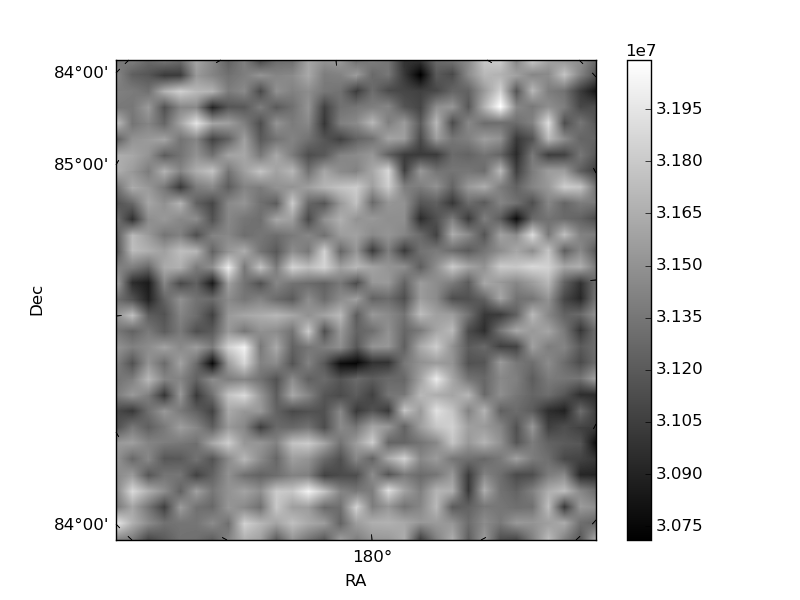
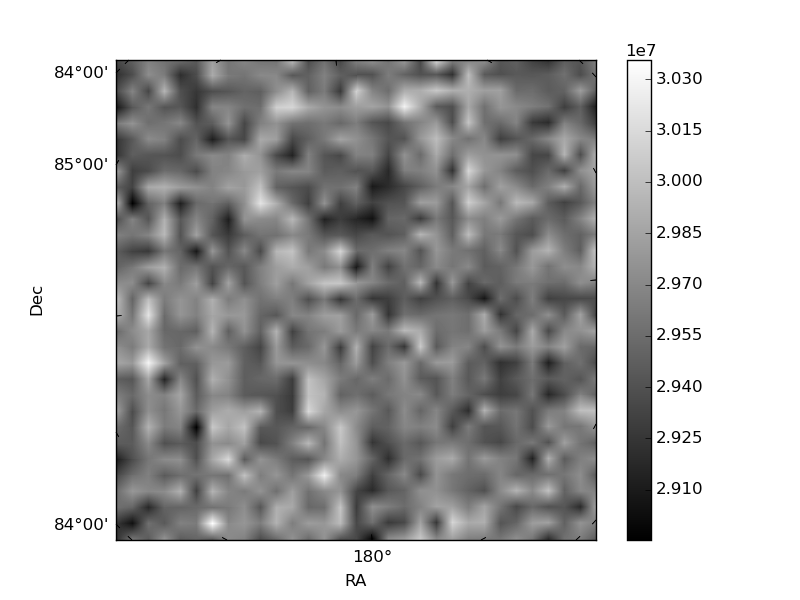
Histogram calculated using DETX and DETY for each event in the final _common_clean file
| Quadrant A |  |
 |
Quadrant B |
|---|---|---|---|
| Quadrant D | 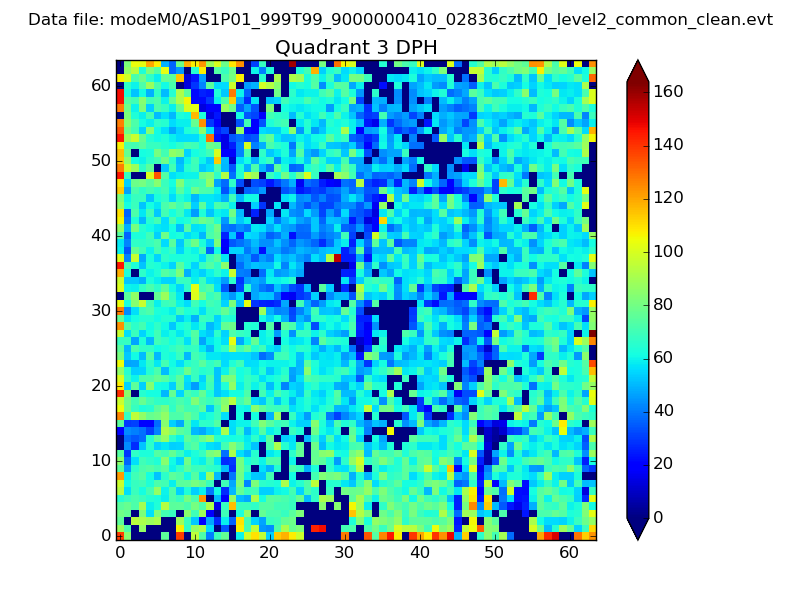 |
 |
Quadrant C |
| Plot type | Count rate plots | Images |
|---|---|---|
| Comparison with Poisson distribution Blue bars denote a histogram of data divided into 1 sec bins. Red curve is a Poisson curve with rate = median count rate of data. |
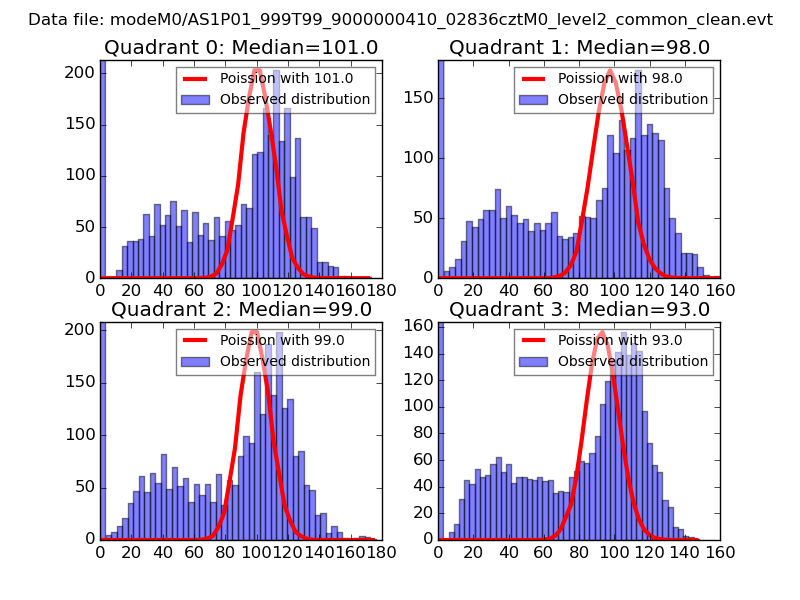 |
 |
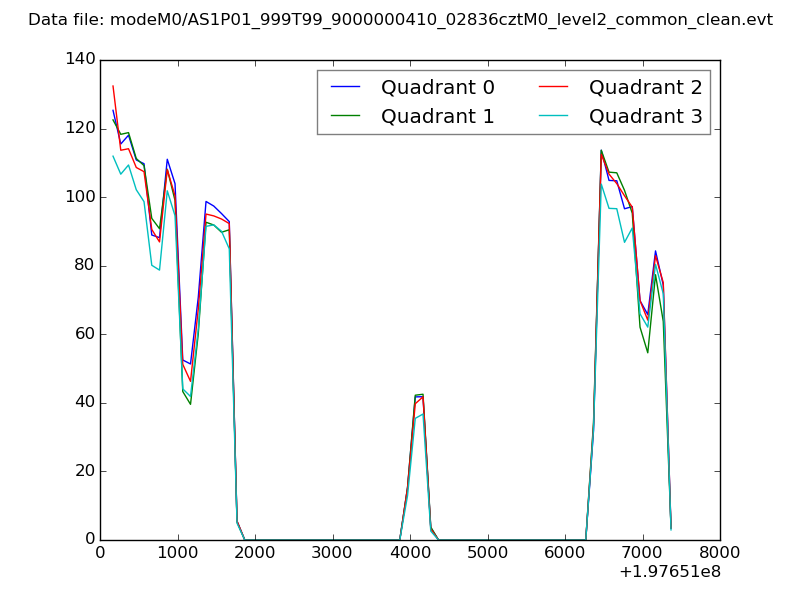
| Quadrant-wise count rates Data is divided into 100 sec bins |
 |
|
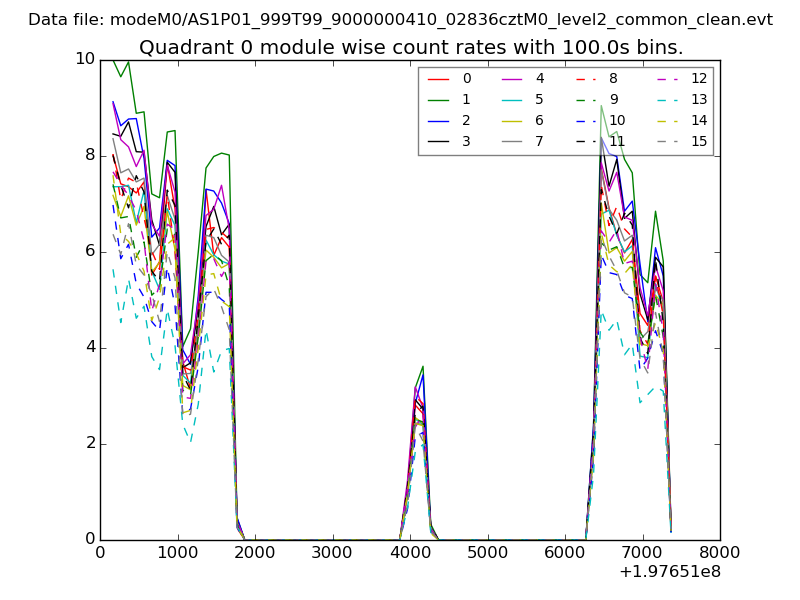
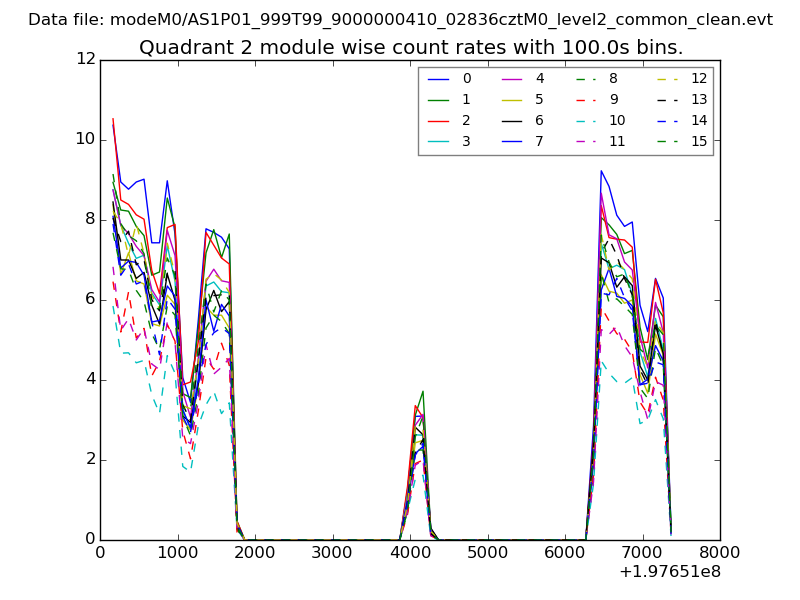
| Module-wise count rates for Quadrant A Data is divided into 100 sec bins |
 |
 |
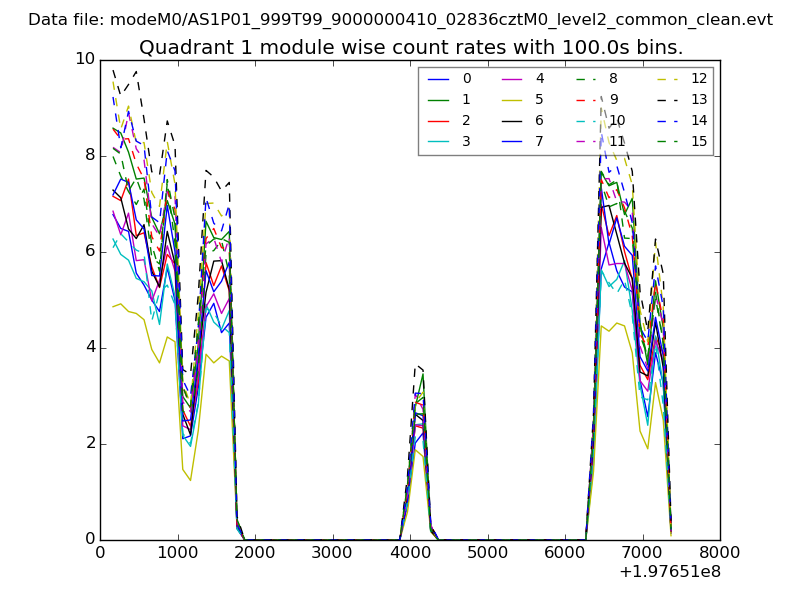
| Module-wise count rates for Quadrant B Data is divided into 100 sec bins |
 |
 |
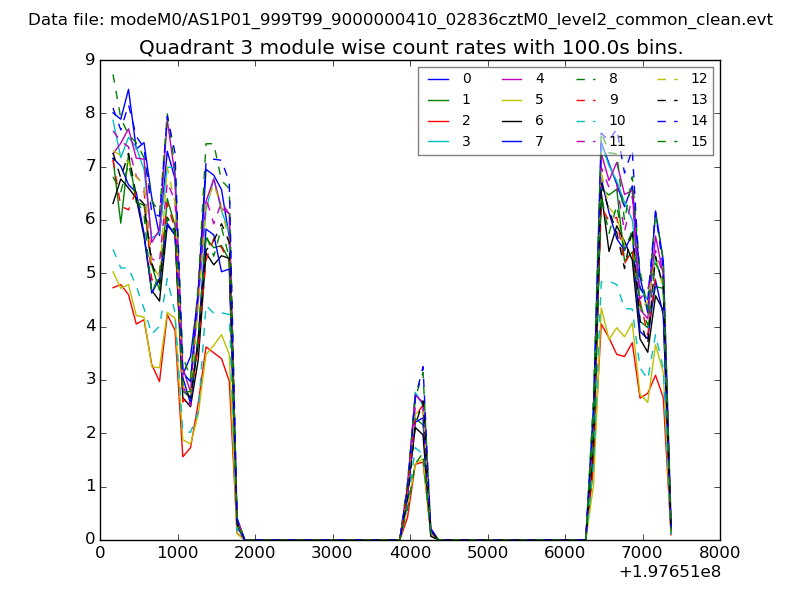
| Module-wise count rates for Quadrant C Data is divided into 100 sec bins |
 |
 |
| Module-wise count rates for Quadrant D Data is divided into 100 sec bins |
 |
 |
| Parameter | Plot |
|---|---|
| CZT HV Monitor | 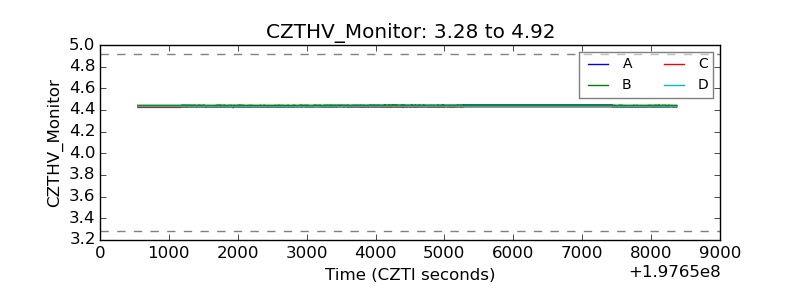 |
| D_VDD | 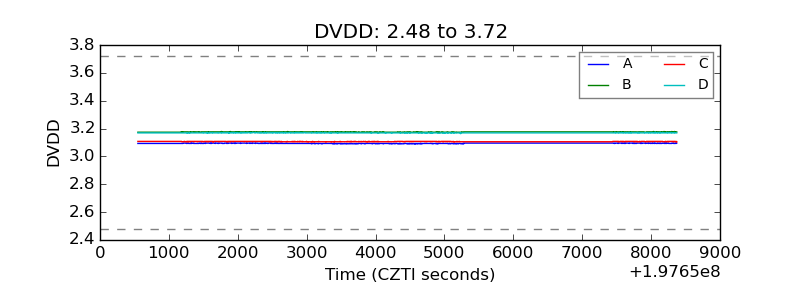 |
| Temperature 1 | 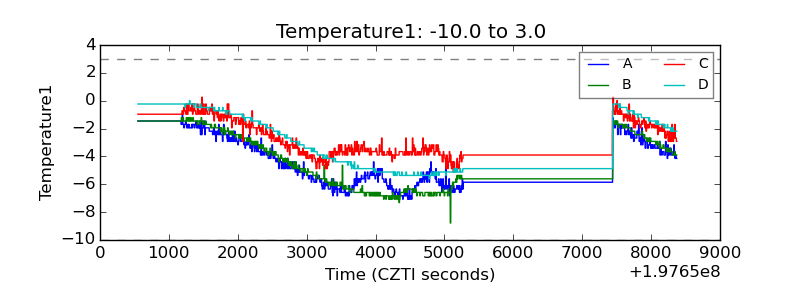 |
| Veto HV Monitor | 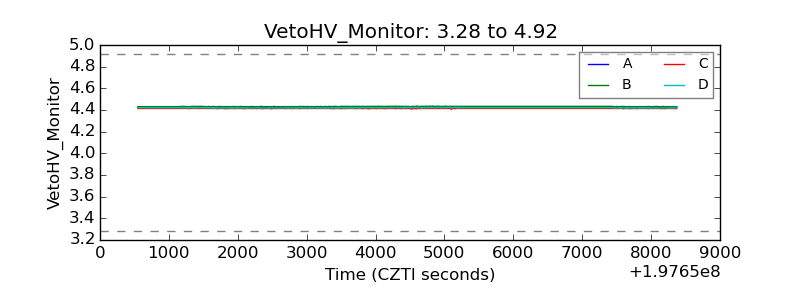 |
| Veto LLD | 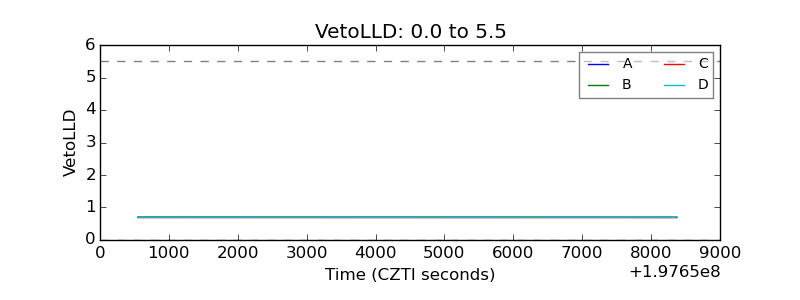 |
| Alpha Counter | 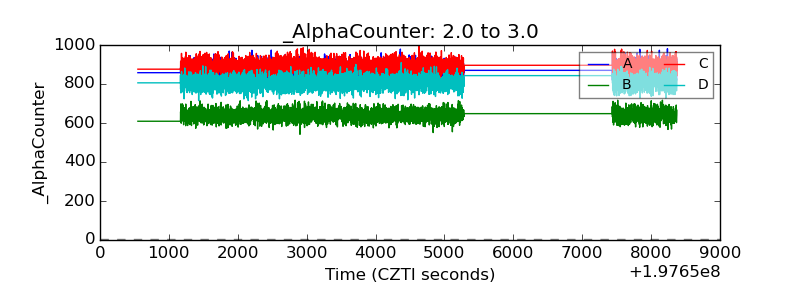 |
| _CPM_Rate | 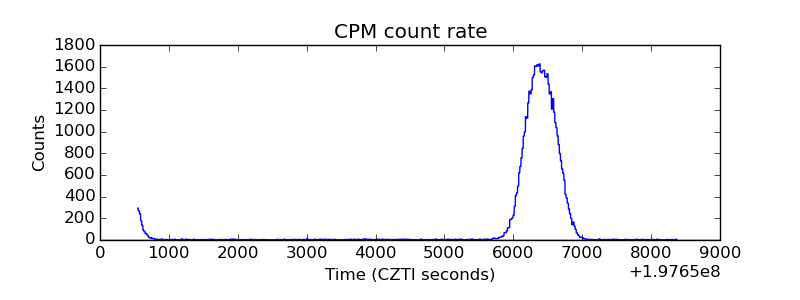 |
| CZT Counter | 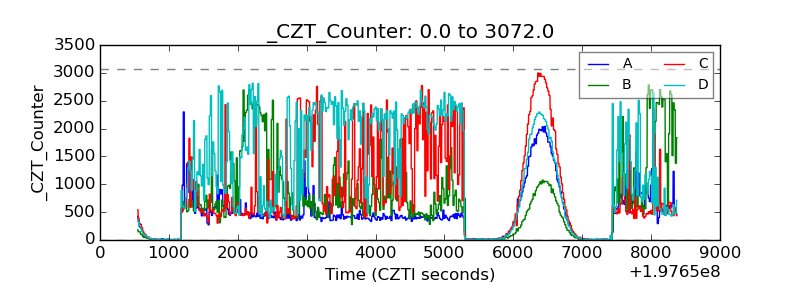 |
| +2.5 Volts monitor |  |
| +5 Volts monitor |  |
| Veto Counter | 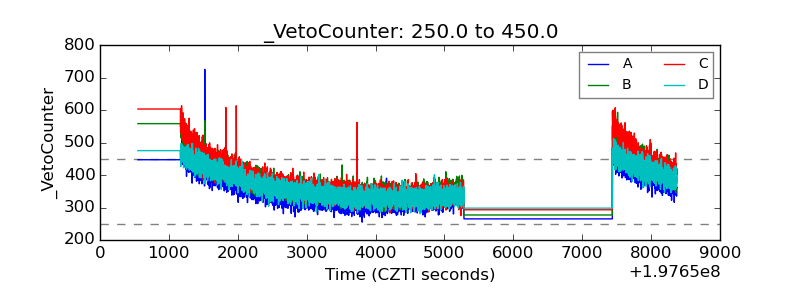 |