| Param | Original file | Final file |
|---|---|---|
| Filename | modeM0/AS1P01_999T99_9000000410_02838cztM0_level2.evt | modeM0/AS1P01_999T99_9000000410_02838cztM0_level2_quad_clean.evt |
| Size (bytes) | 692,867,520 | 39,556,800 |
| Size | 660.8 MB | 37.7 MB |
| Events in quadrant A | 2,191,669 | 230,400 |
| Events in quadrant B | 3,066,878 | 234,756 |
| Events in quadrant C | 6,384,833 | 205,429 |
| Events in quadrant D | 9,006,018 | 179,185 |
| Mode SS | |||
|---|---|---|---|
| Quadrant | BADHDUFLAG | Total packets | Discarded packets |
| A | 0 | 100 | 0 |
| B | 0 | 100 | 0 |
| C | 0 | 100 | 0 |
| D | 0 | 100 | 0 |
| Mode M9 | |||
|---|---|---|---|
| Quadrant | BADHDUFLAG | Total packets | Discarded packets |
| A | 0 | 23 | 0 |
| B | 0 | 23 | 0 |
| C | 0 | 23 | 0 |
| D | 0 | 24 | 0 |
| Mode M0 | |||
|---|---|---|---|
| Quadrant | BADHDUFLAG | Total packets | Discarded packets |
| A | 0 | 10257 | 3 |
| B | 0 | 12454 | 2 |
| C | 0 | 22345 | 2 |
| D | 0 | 30129 | 2 |
| Quadrant | Total seconds | Saturated seconds | Saturation percentage |
|---|---|---|---|
| A | 4947 | 29 | 0.586214% |
| B | 4947 | 62 | 1.253285% |
| C | 4947 | 1486 | 30.038407% |
| D | 4947 | 2863 | 57.873459% |
Noise dominated data is calculated using 1-second bins in cleaned event files. If a bin has >2000 counts, and if more than 50% of those come from <1% of pixels, then it is considered to be noise-dominated and hence unusable.
| Quadrant | # 1 sec bins | Bins with >0 counts | Bins with >2000 counts | High rate bins dominated by noise | Noise dominated (total time) | Noise dominated (detector-on time) | Marked lightcurve |
|---|---|---|---|---|---|---|---|
| A | 7103 | 4948 | 14 | 14 | 0.20% | 0.28% | 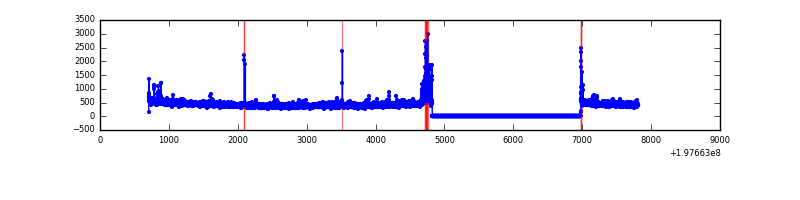 |
| B | 7103 | 4948 | 45 | 45 | 0.63% | 0.91% | 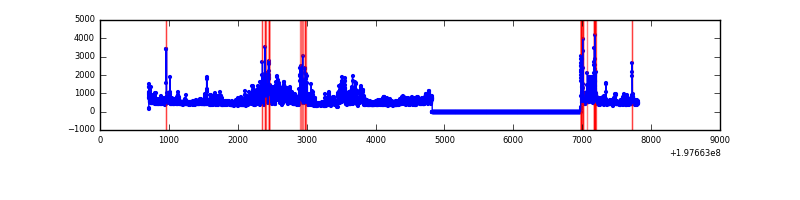 |
| C | 7103 | 4948 | 1096 | 1096 | 15.43% | 22.15% | 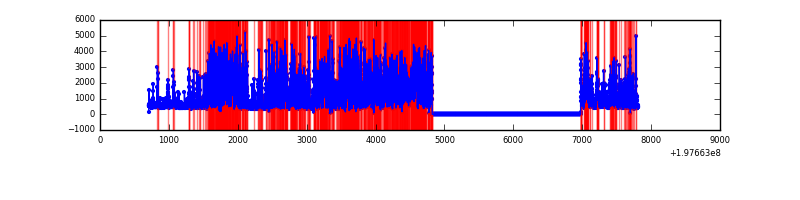 |
| D | 7103 | 4947 | 2321 | 2321 | 32.68% | 46.92% | 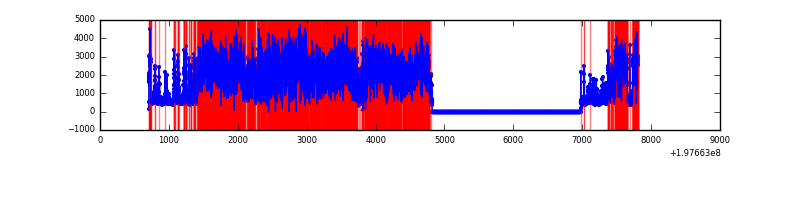 |
Top three noisy pixels from each quadrant. If the there are fewer than three noisy pixels in the level2.evt file, extra rows are filled as -1
| Pixel properties | Quadrant properties | ||||||
|---|---|---|---|---|---|---|---|
| Quadrant | DetID | PixID | Counts | Sigma | Mean | Median | Sigma |
| A | 0 | 31 | 48022 | 450.59 | 522 | 511 | 105.4 |
| A | 0 | 149 | 32068 | 299.28 | 522 | 511 | 105.4 |
| A | 0 | 226 | 30095 | 280.57 | 522 | 511 | 105.4 |
| B | 0 | 173 | 514047 | 4979.55 | 535 | 524 | 103.1 |
| B | 0 | 191 | 171167 | 1654.7 | 535 | 524 | 103.1 |
| B | 0 | 219 | 105948 | 1022.28 | 535 | 524 | 103.1 |
| C | 0 | 64 | 3424595 | 32429.56 | 456 | 459 | 105.6 |
| C | 0 | 219 | 675606 | 6394.23 | 456 | 459 | 105.6 |
| C | 1 | 16 | 217541 | 2055.96 | 456 | 459 | 105.6 |
| D | 0 | 226 | 3533180 | 39930.74 | 353 | 346 | 88.5 |
| D | 1 | 4 | 2238417 | 25296.36 | 353 | 346 | 88.5 |
| D | 1 | 66 | 1674013 | 18917.04 | 353 | 346 | 88.5 |
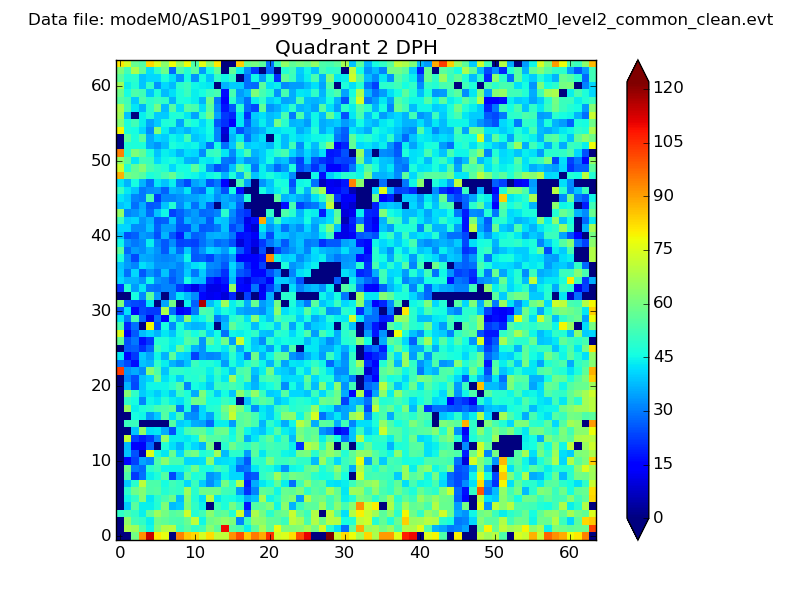
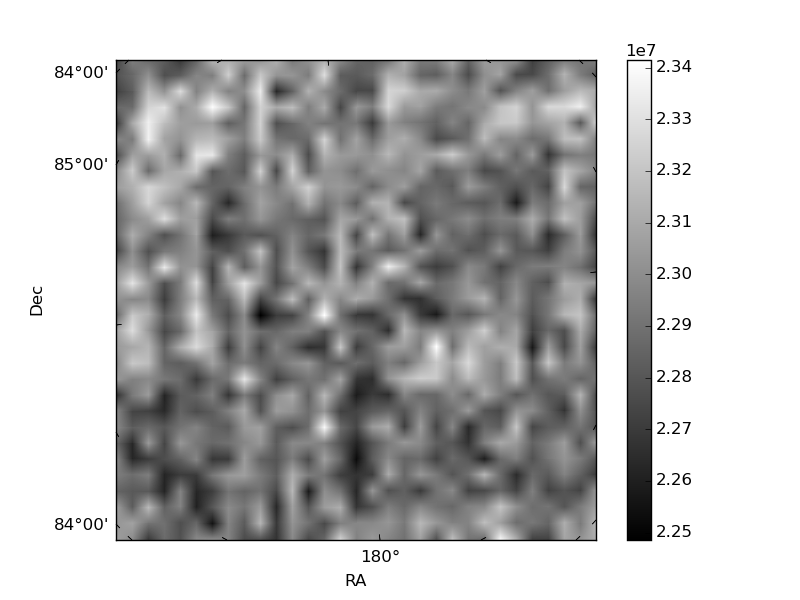
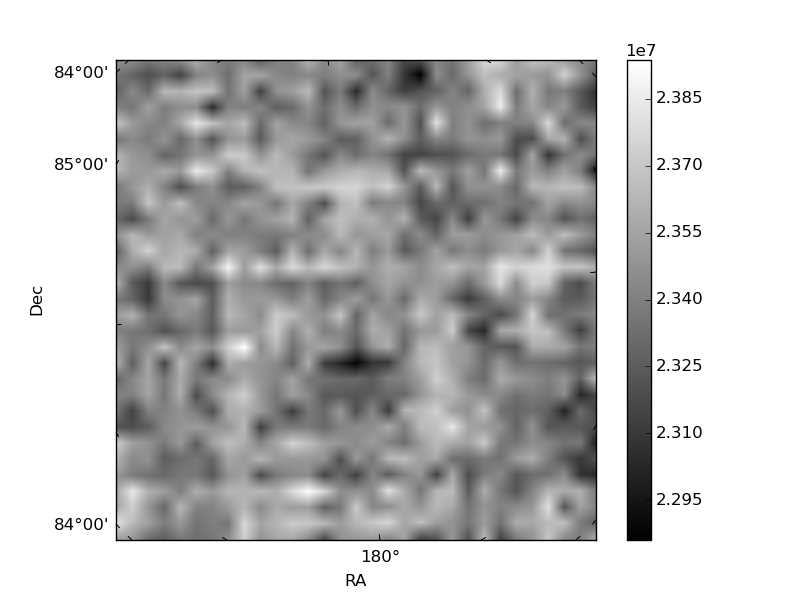
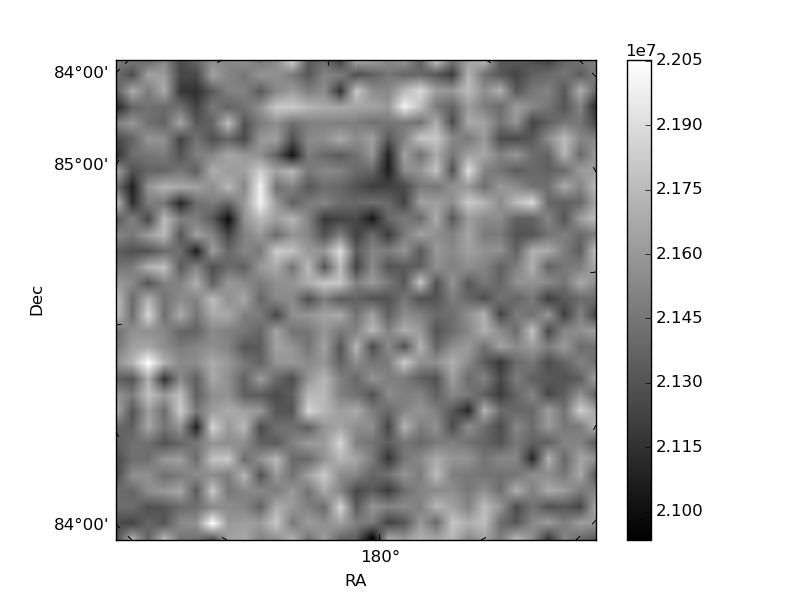
Histogram calculated using DETX and DETY for each event in the final _common_clean file
| Quadrant A | 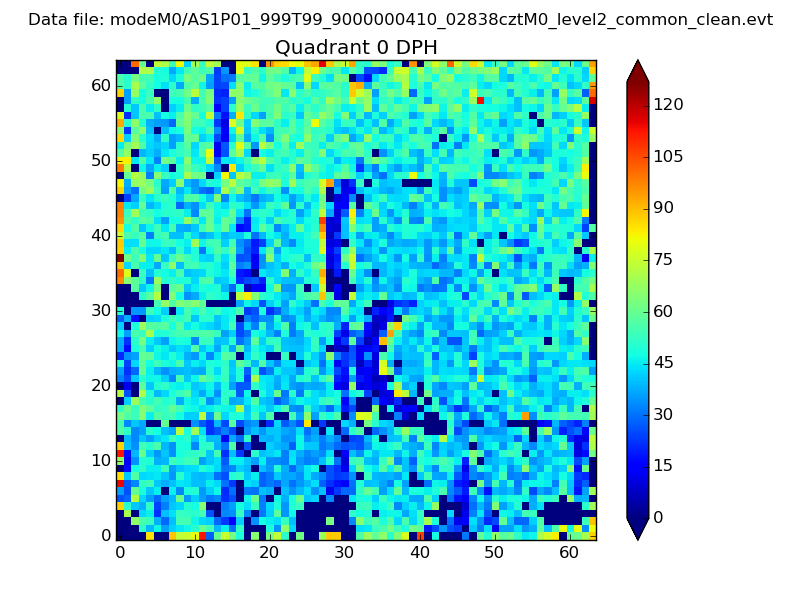 |
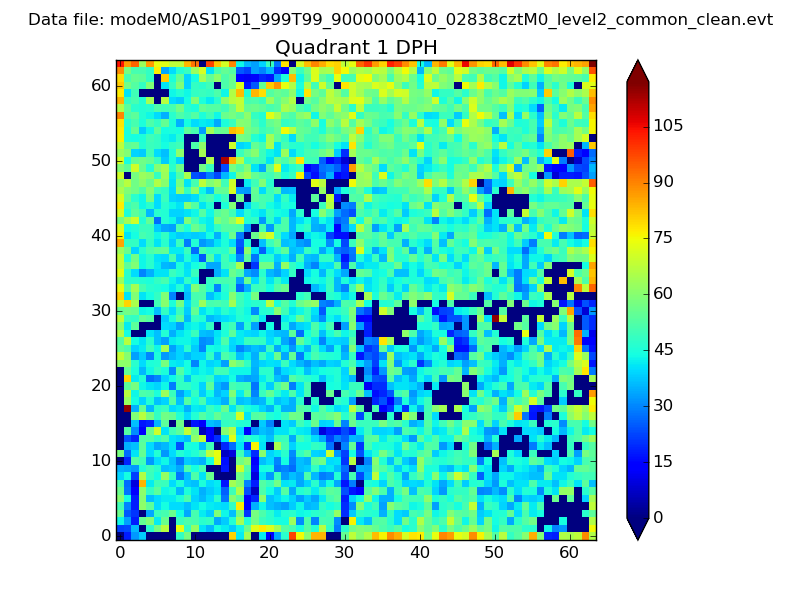 |
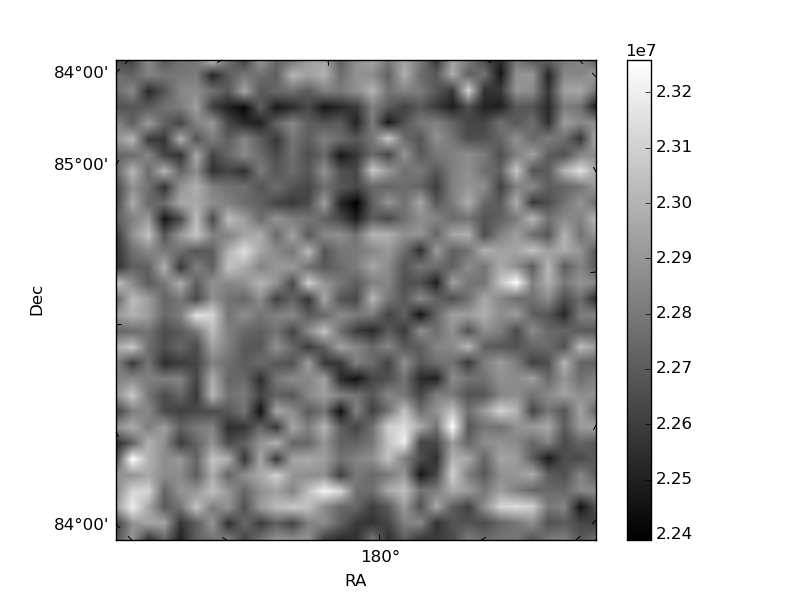
Quadrant B |
|---|---|---|---|
| Quadrant D | 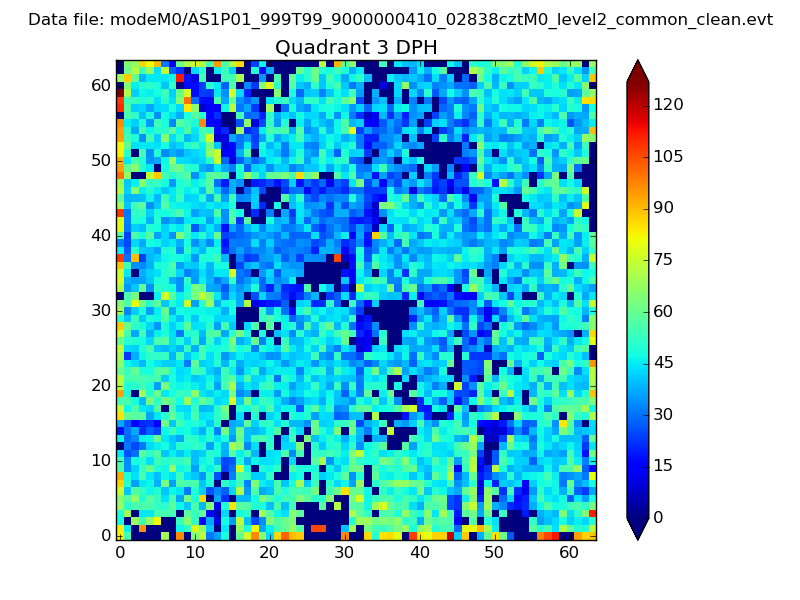 |
 |
Quadrant C |
| Plot type | Count rate plots | Images |
|---|---|---|
| Comparison with Poisson distribution Blue bars denote a histogram of data divided into 1 sec bins. Red curve is a Poisson curve with rate = median count rate of data. |
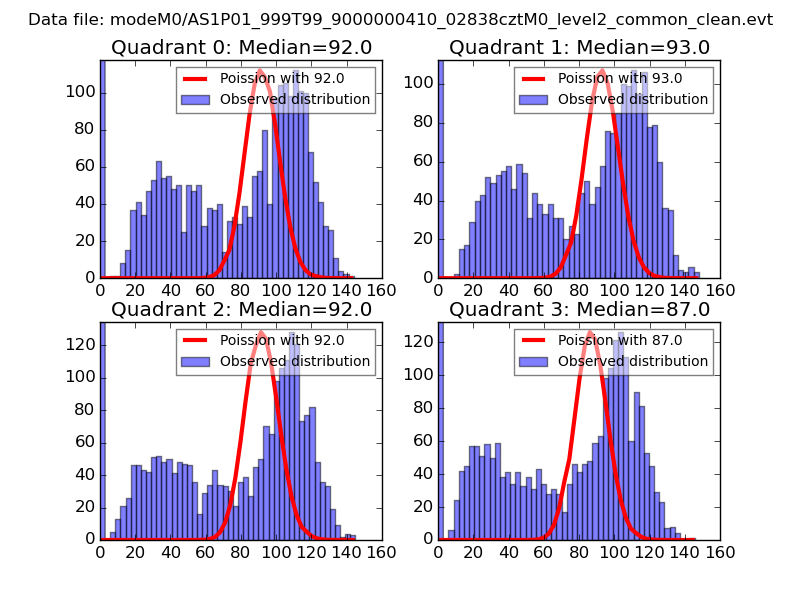 |
 |
| Quadrant-wise count rates Data is divided into 100 sec bins |
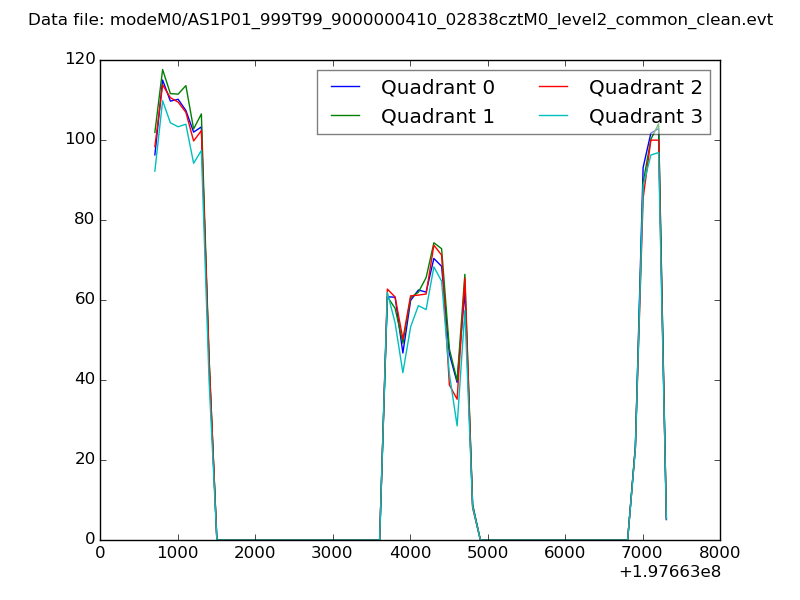 |
|
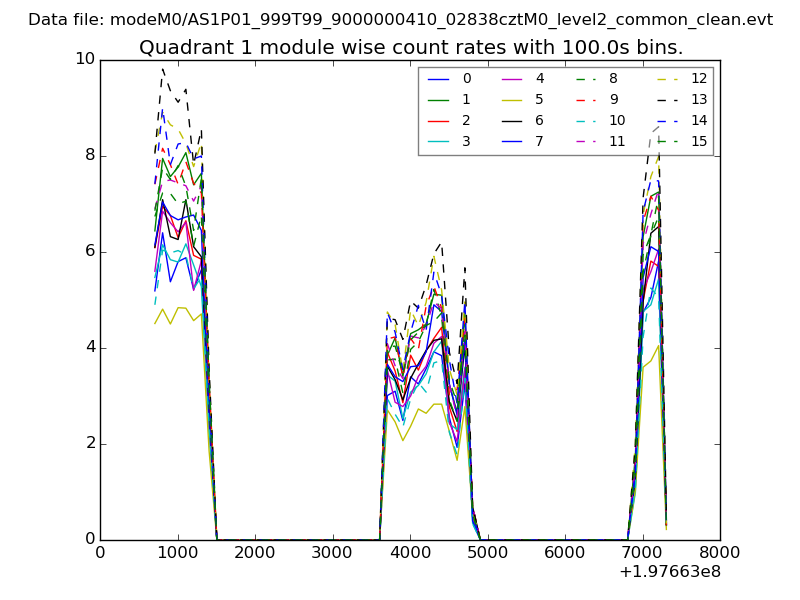
| Module-wise count rates for Quadrant A Data is divided into 100 sec bins |
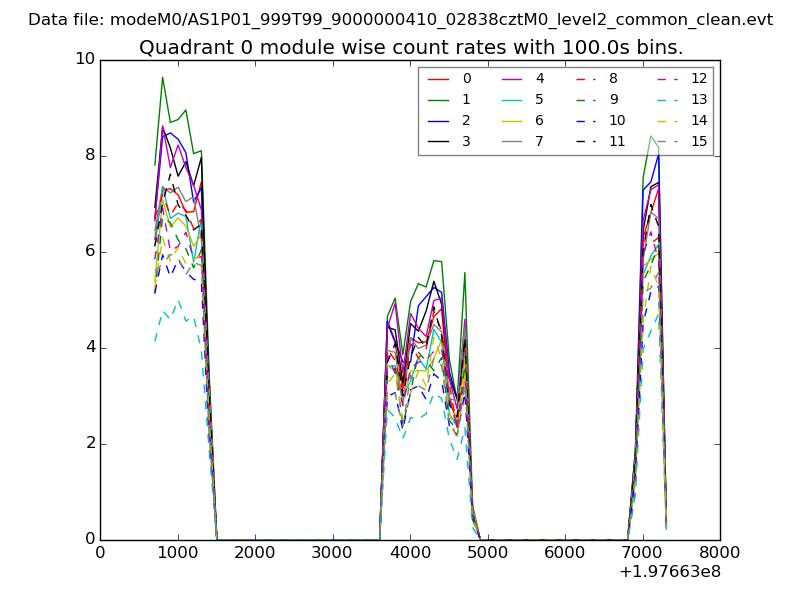 |
 |
| Module-wise count rates for Quadrant B Data is divided into 100 sec bins |
 |
 |
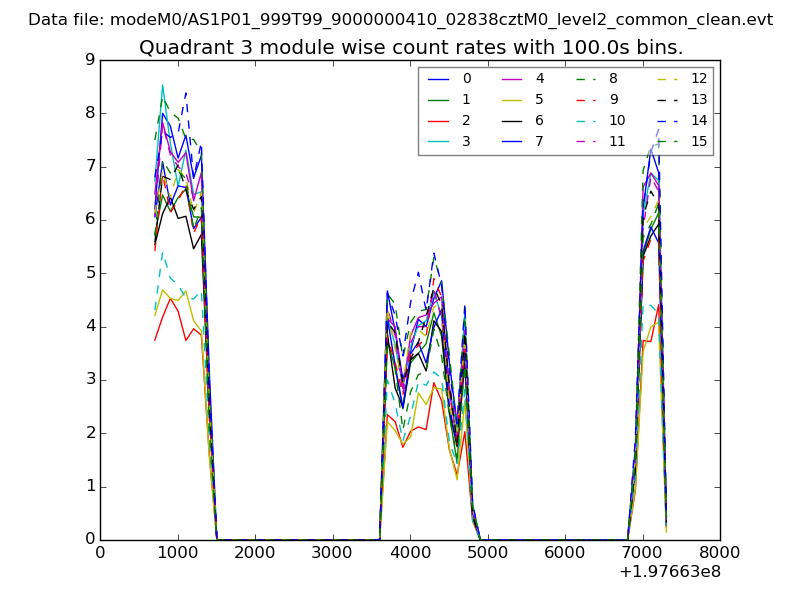
| Module-wise count rates for Quadrant C Data is divided into 100 sec bins |
 |
 |
| Module-wise count rates for Quadrant D Data is divided into 100 sec bins |
 |
 |
| Parameter | Plot |
|---|---|
| CZT HV Monitor | 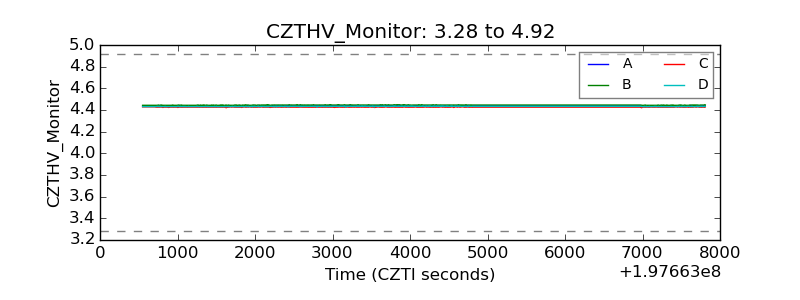 |
| D_VDD | 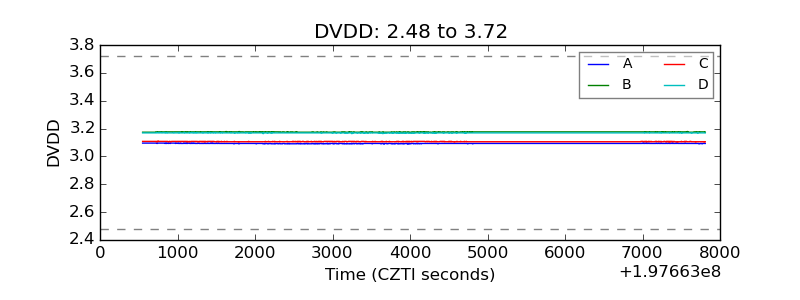 |
| Temperature 1 | 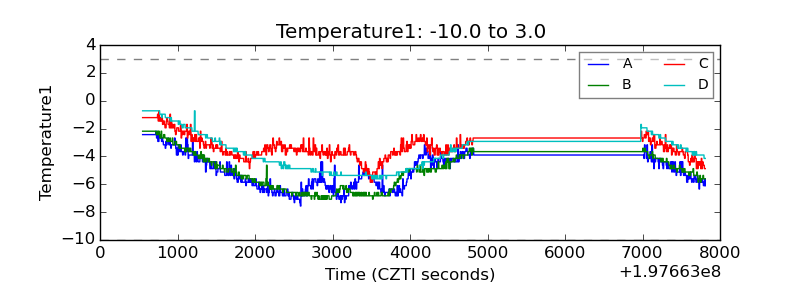 |
| Veto HV Monitor |  |
| Veto LLD | 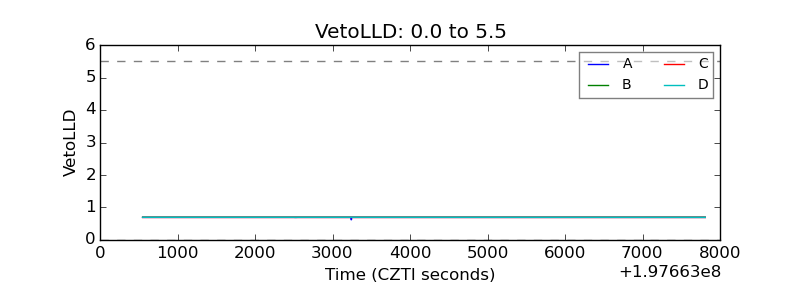 |
| Alpha Counter | 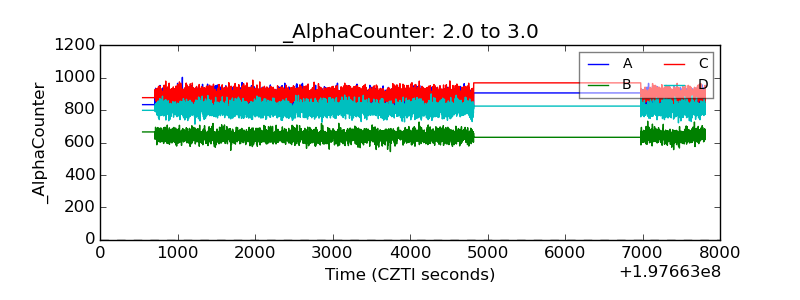 |
| _CPM_Rate | 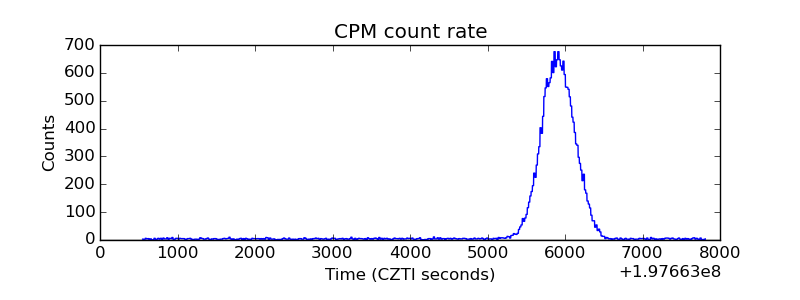 |
| CZT Counter | 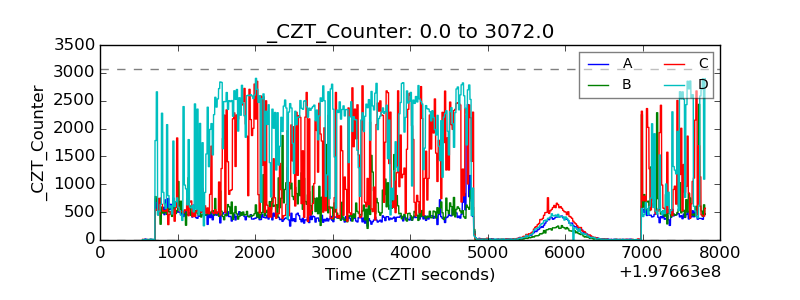 |
| +2.5 Volts monitor |  |
| +5 Volts monitor |  |
| Veto Counter |  |