| Param | Original file | Final file |
|---|---|---|
| Filename | modeM0/AS1P01_999T99_9000000410_02839cztM0_level2.evt | modeM0/AS1P01_999T99_9000000410_02839cztM0_level2_quad_clean.evt |
| Size (bytes) | 641,571,840 | 33,514,560 |
| Size | 611.9 MB | 32.0 MB |
| Events in quadrant A | 2,035,294 | 185,154 |
| Events in quadrant B | 2,972,096 | 187,945 |
| Events in quadrant C | 5,579,779 | 168,884 |
| Events in quadrant D | 8,508,281 | 124,752 |
| Mode SS | |||
|---|---|---|---|
| Quadrant | BADHDUFLAG | Total packets | Discarded packets |
| A | 0 | 100 | 0 |
| B | 0 | 100 | 0 |
| C | 0 | 100 | 0 |
| D | 0 | 100 | 0 |
| Mode M9 | |||
|---|---|---|---|
| Quadrant | BADHDUFLAG | Total packets | Discarded packets |
| A | 0 | 22 | 0 |
| B | 0 | 22 | 0 |
| C | 0 | 22 | 0 |
| D | 0 | 22 | 0 |
| Mode M0 | |||
|---|---|---|---|
| Quadrant | BADHDUFLAG | Total packets | Discarded packets |
| A | 0 | 9943 | 3 |
| B | 0 | 12278 | 2 |
| C | 0 | 20036 | 2 |
| D | 0 | 28654 | 2 |
| Quadrant | Total seconds | Saturated seconds | Saturation percentage |
|---|---|---|---|
| A | 4944 | 3 | 0.060680% |
| B | 4944 | 44 | 0.889968% |
| C | 4944 | 1063 | 21.500809% |
| D | 4944 | 2813 | 56.897249% |
Noise dominated data is calculated using 1-second bins in cleaned event files. If a bin has >2000 counts, and if more than 50% of those come from <1% of pixels, then it is considered to be noise-dominated and hence unusable.
| Quadrant | # 1 sec bins | Bins with >0 counts | Bins with >2000 counts | High rate bins dominated by noise | Noise dominated (total time) | Noise dominated (detector-on time) | Marked lightcurve |
|---|---|---|---|---|---|---|---|
| A | 7130 | 4945 | 0 | 0 | 0.00% | 0.00% | 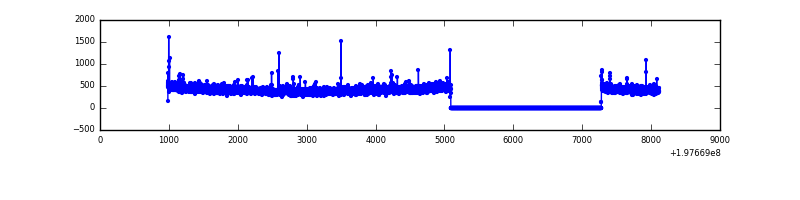 |
| B | 7130 | 4945 | 32 | 32 | 0.45% | 0.65% | 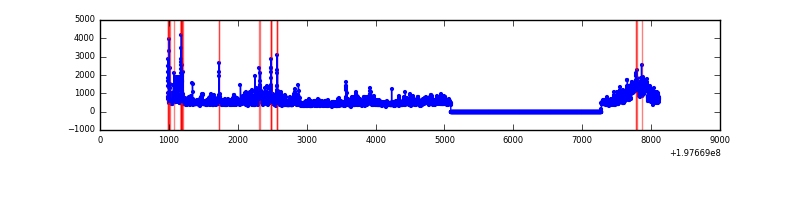 |
| C | 7130 | 4945 | 840 | 840 | 11.78% | 16.99% | 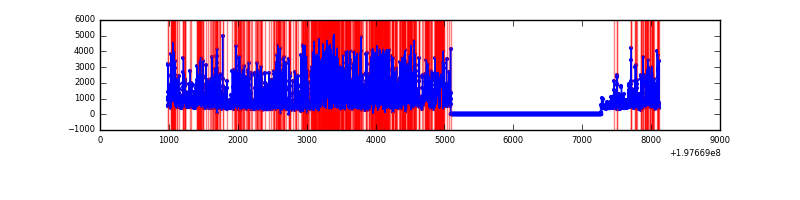 |
| D | 7130 | 4945 | 2089 | 2089 | 29.30% | 42.24% | 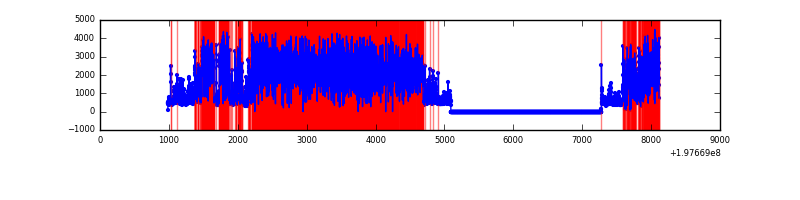 |
Top three noisy pixels from each quadrant. If the there are fewer than three noisy pixels in the level2.evt file, extra rows are filled as -1
| Pixel properties | Quadrant properties | ||||||
|---|---|---|---|---|---|---|---|
| Quadrant | DetID | PixID | Counts | Sigma | Mean | Median | Sigma |
| A | 0 | 31 | 18799 | 177.37 | 508 | 496 | 103.2 |
| A | 0 | 226 | 10522 | 97.16 | 508 | 496 | 103.2 |
| A | 8 | 4 | 9994 | 92.04 | 508 | 496 | 103.2 |
| B | 0 | 4 | 513220 | 5064.68 | 520 | 509 | 101.2 |
| B | 0 | 168 | 98822 | 971.16 | 520 | 509 | 101.2 |
| B | 0 | 191 | 69364 | 680.17 | 520 | 509 | 101.2 |
| C | 0 | 219 | 2282575 | 21086.8 | 464 | 467 | 108.2 |
| C | 1 | 16 | 845264 | 7805.97 | 464 | 467 | 108.2 |
| C | 1 | 192 | 335497 | 3095.69 | 464 | 467 | 108.2 |
| D | 0 | 226 | 4019737 | 47689.94 | 333 | 327 | 84.3 |
| D | 1 | 4 | 2527735 | 29987.47 | 333 | 327 | 84.3 |
| D | 1 | 66 | 510661 | 6055.07 | 333 | 327 | 84.3 |
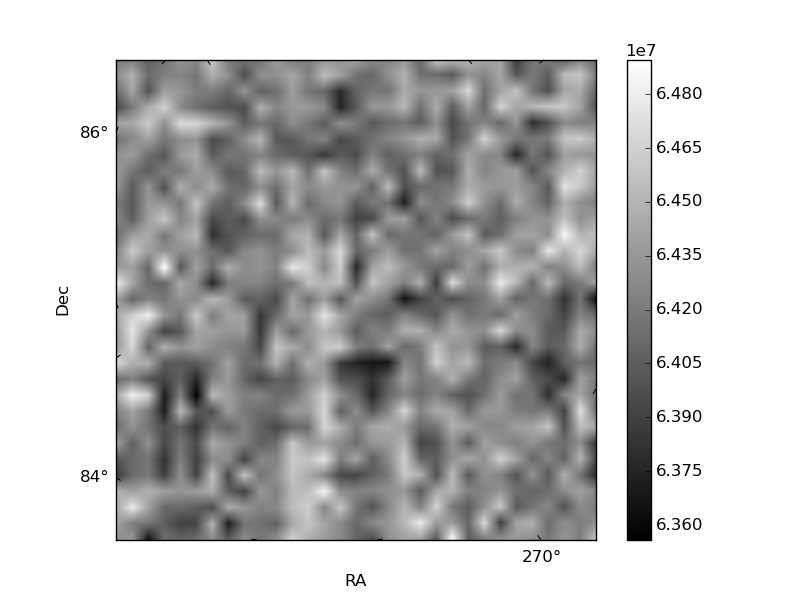
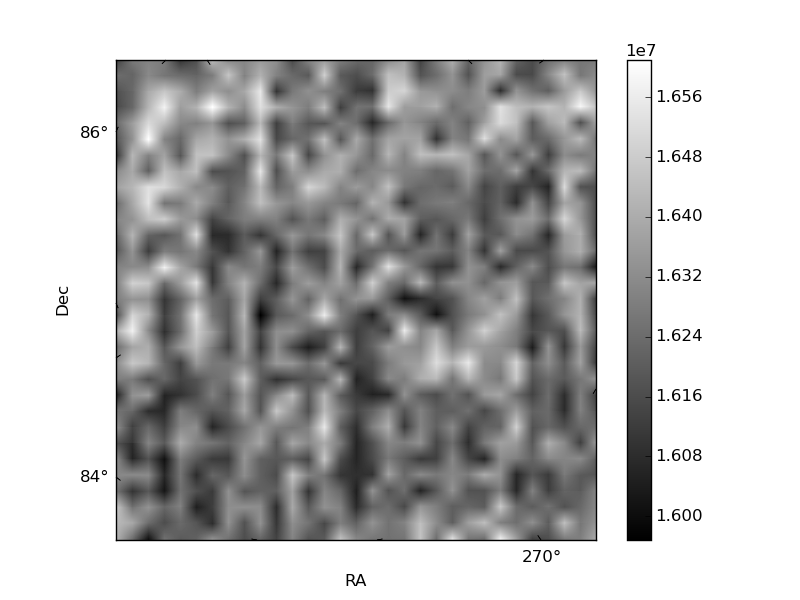
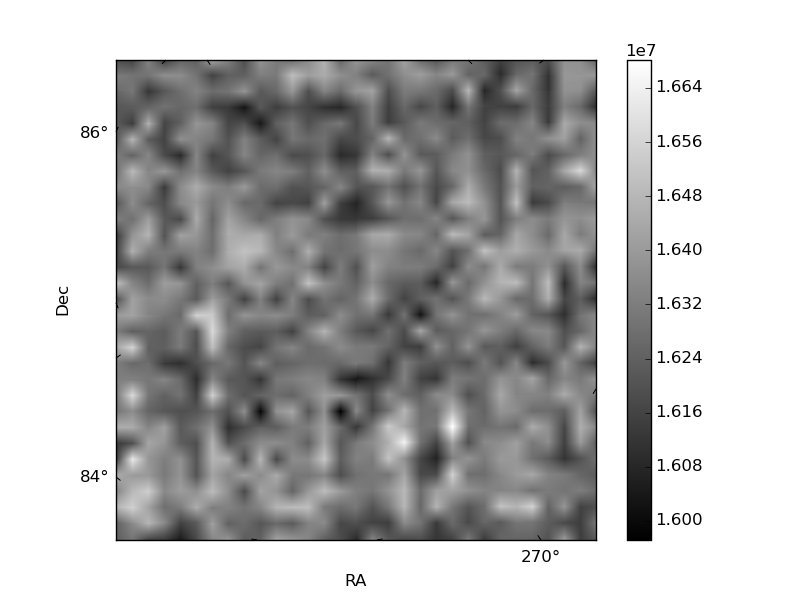
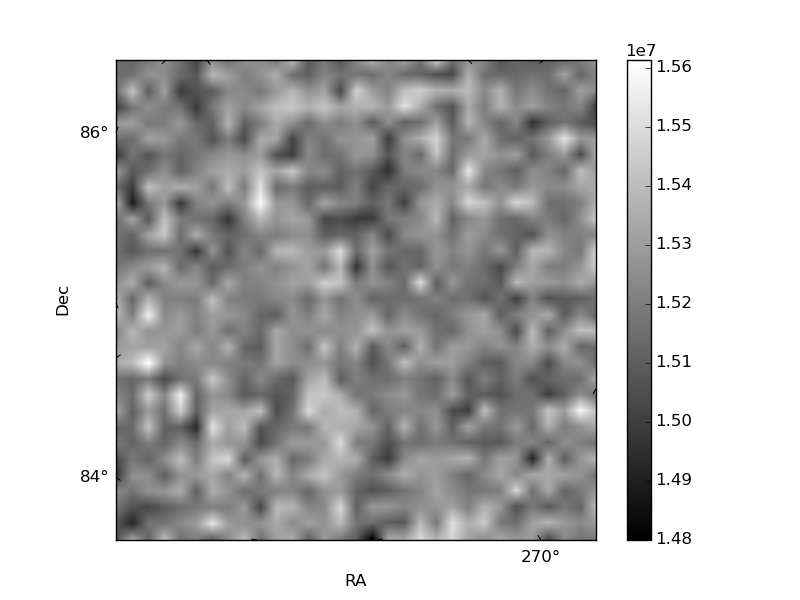
Histogram calculated using DETX and DETY for each event in the final _common_clean file
| Quadrant A | 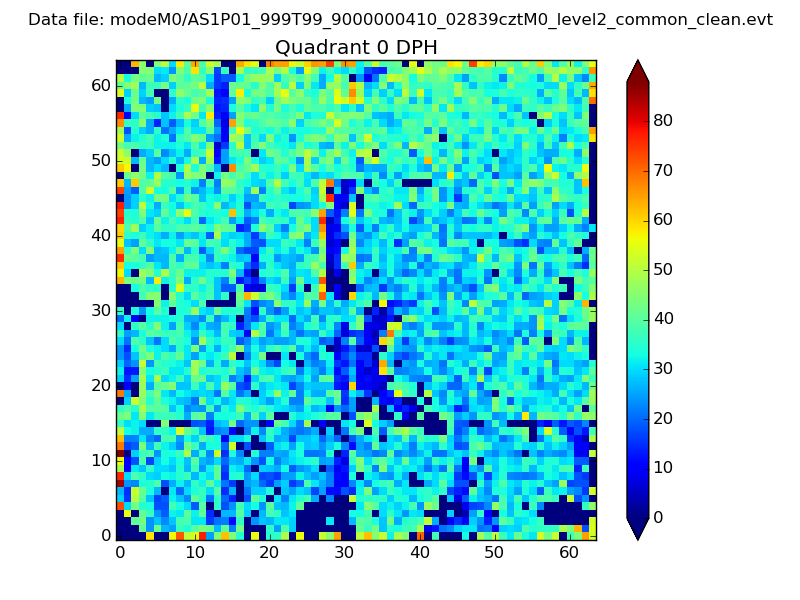 |
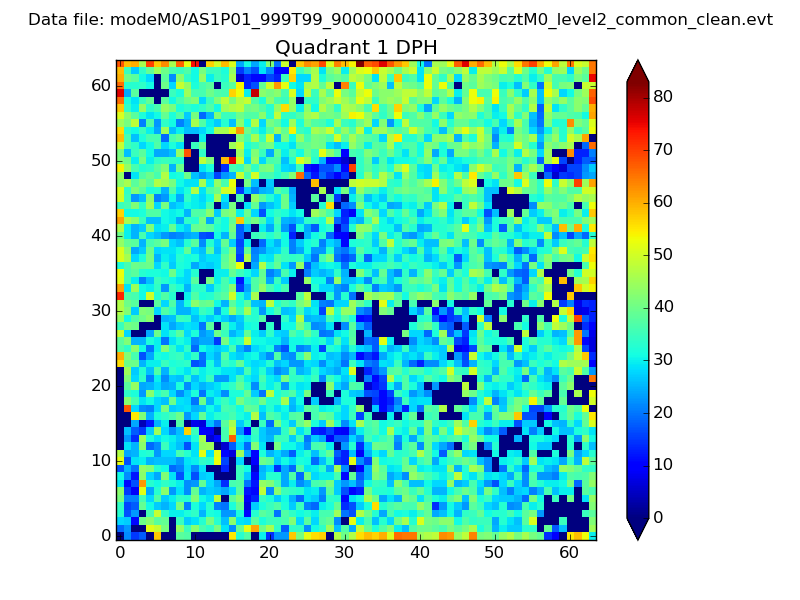 |
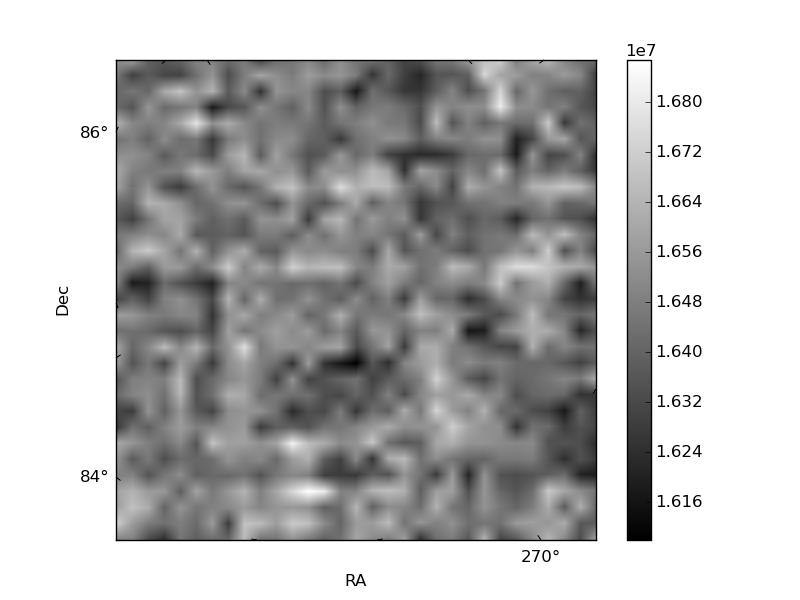
Quadrant B |
|---|---|---|---|
| Quadrant D | 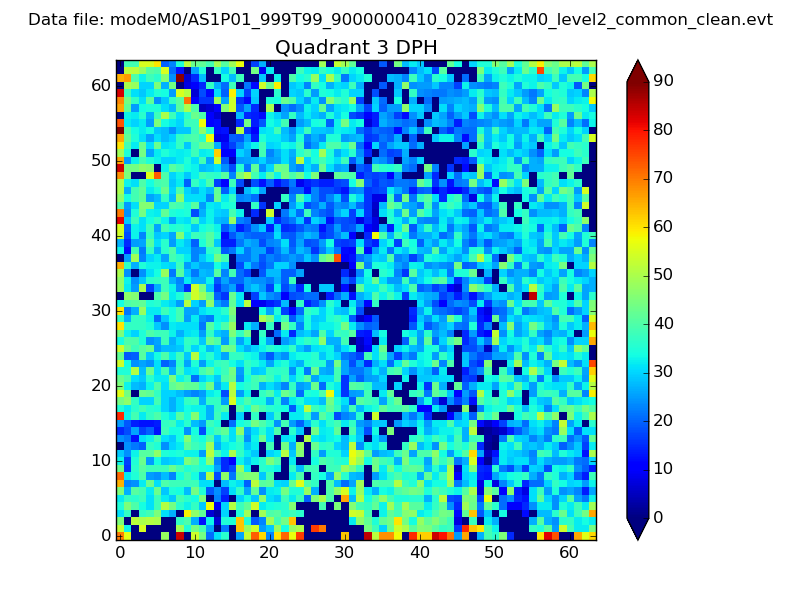 |
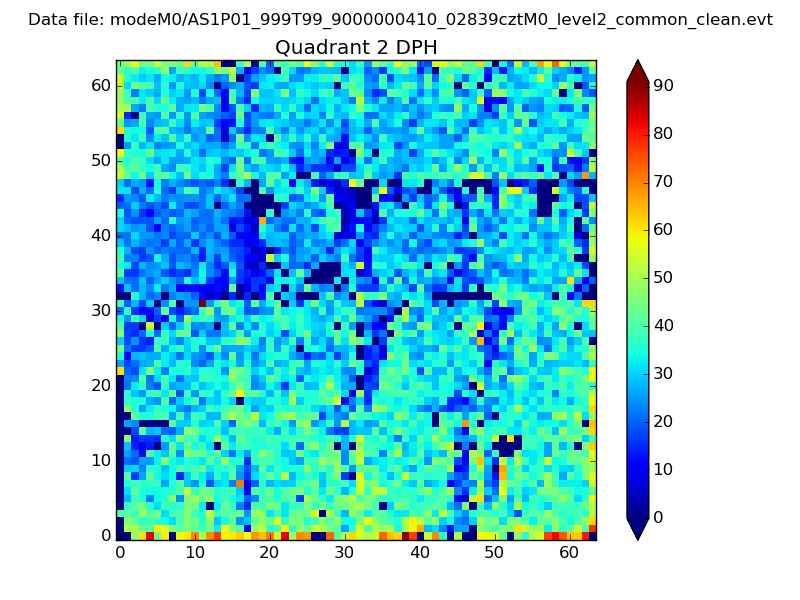 |
Quadrant C |
| Plot type | Count rate plots | Images |
|---|---|---|
| Comparison with Poisson distribution Blue bars denote a histogram of data divided into 1 sec bins. Red curve is a Poisson curve with rate = median count rate of data. |
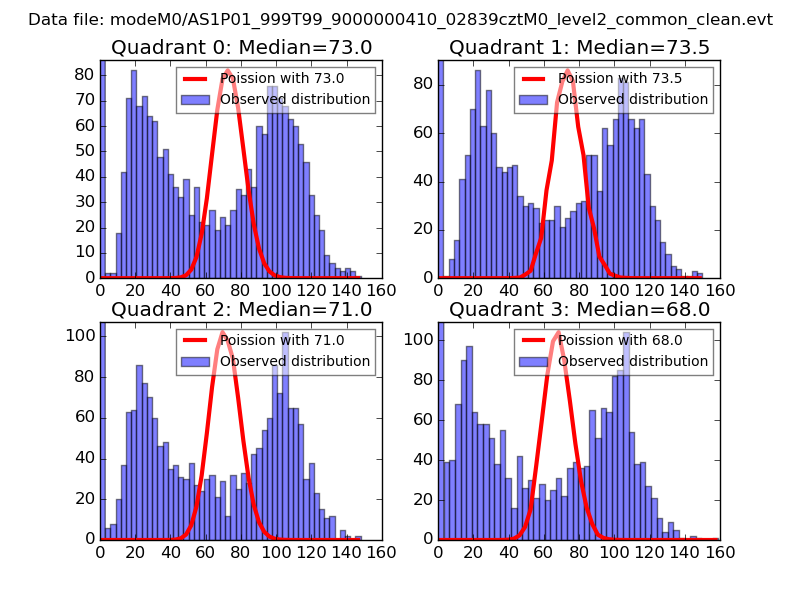 |
 |
| Quadrant-wise count rates Data is divided into 100 sec bins |
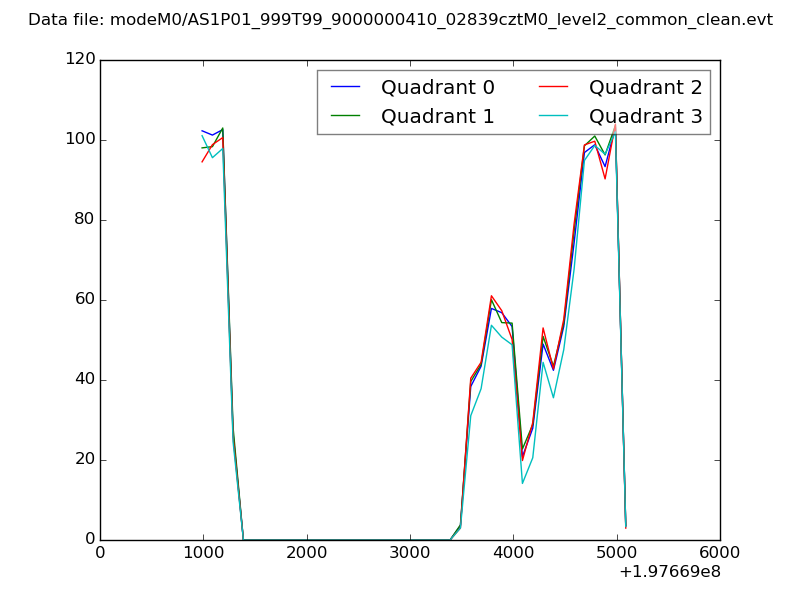 |
|
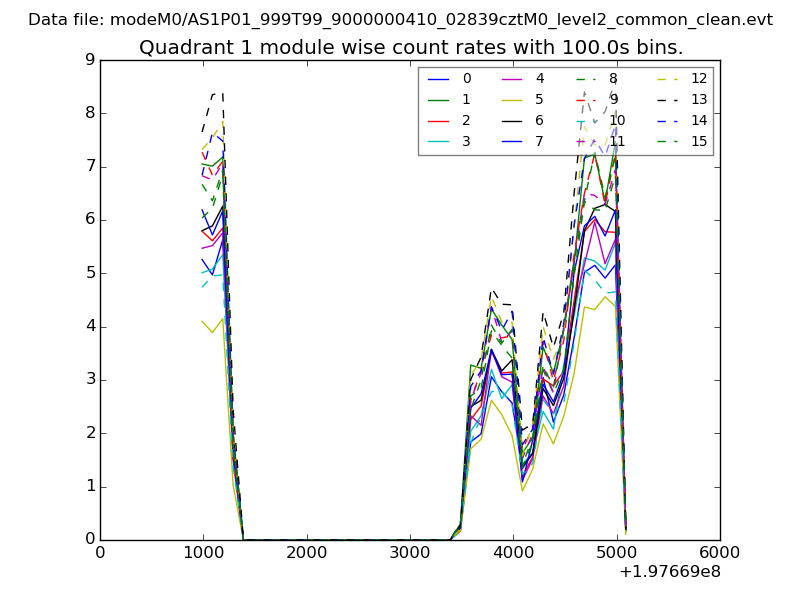
| Module-wise count rates for Quadrant A Data is divided into 100 sec bins |
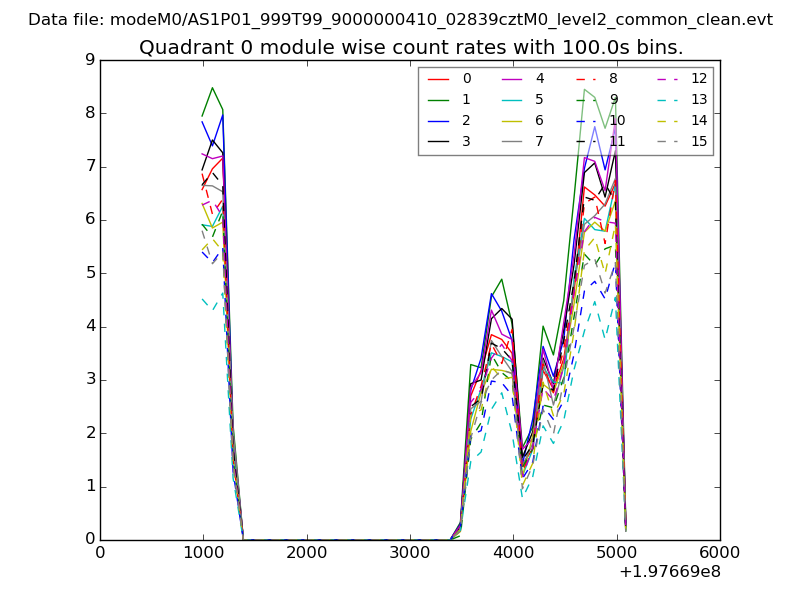 |
 |
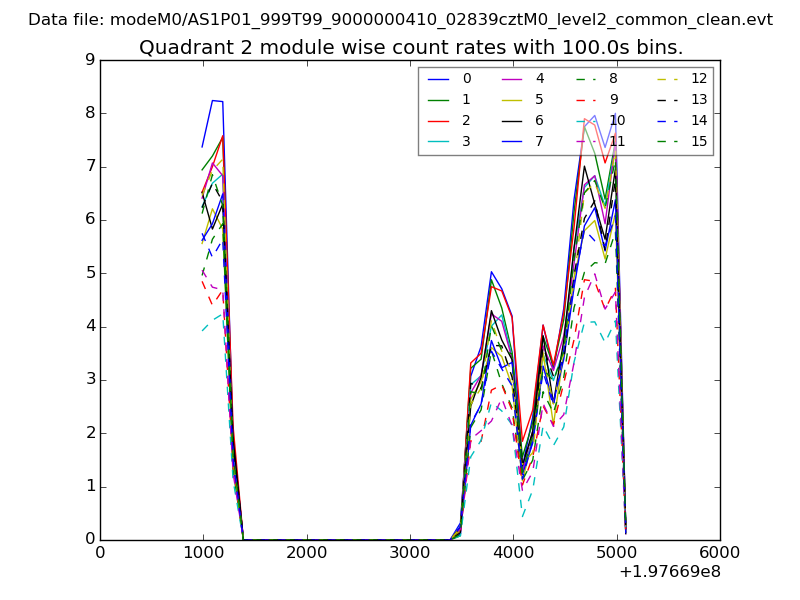
| Module-wise count rates for Quadrant B Data is divided into 100 sec bins |
 |
 |
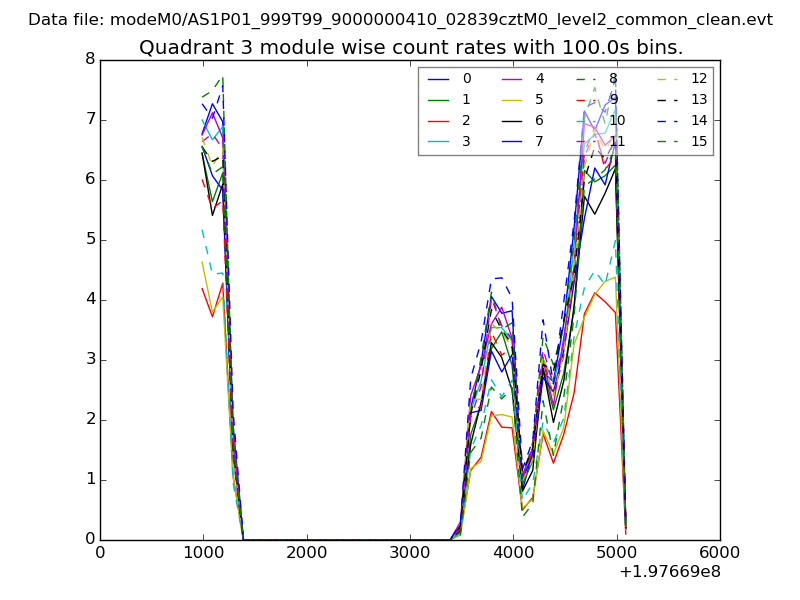
| Module-wise count rates for Quadrant C Data is divided into 100 sec bins |
 |
 |
| Module-wise count rates for Quadrant D Data is divided into 100 sec bins |
 |
 |
| Parameter | Plot |
|---|---|
| CZT HV Monitor | 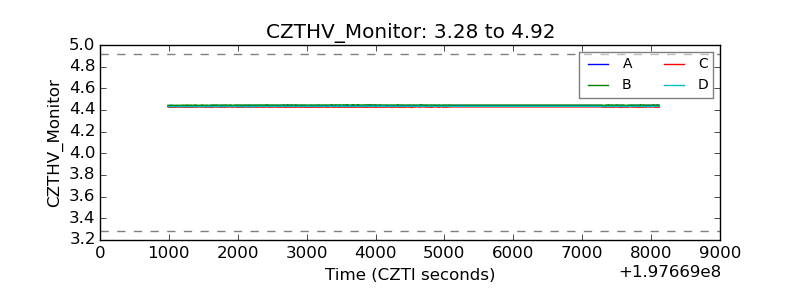 |
| D_VDD | 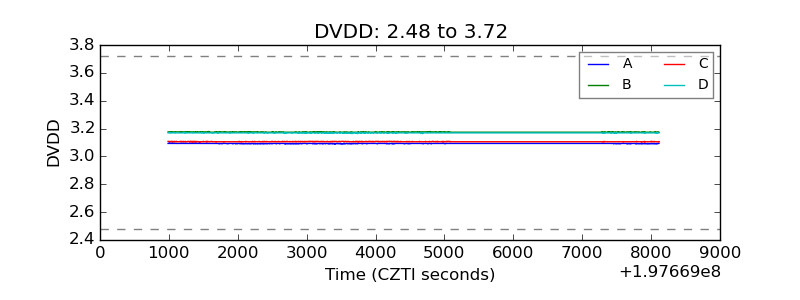 |
| Temperature 1 | 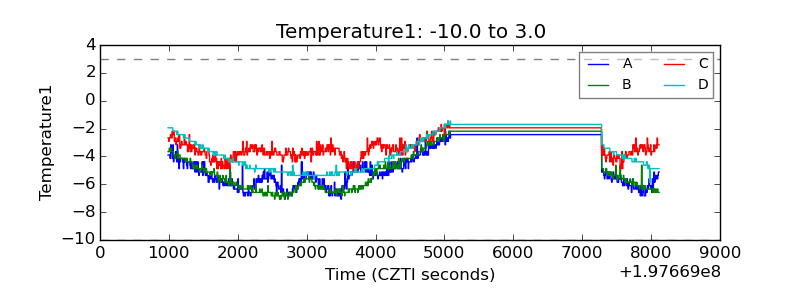 |
| Veto HV Monitor | 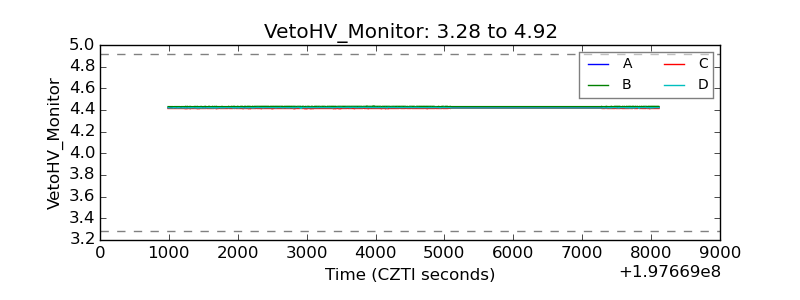 |
| Veto LLD | 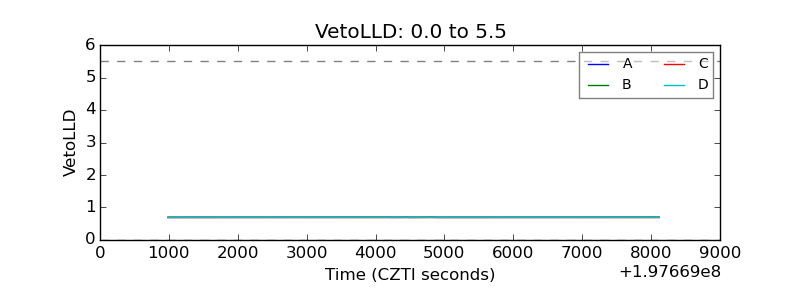 |
| Alpha Counter | 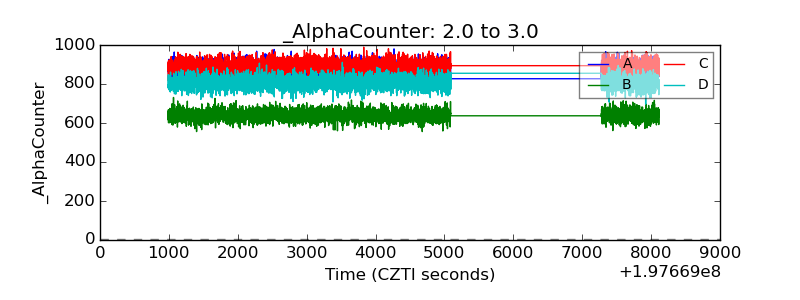 |
| _CPM_Rate | 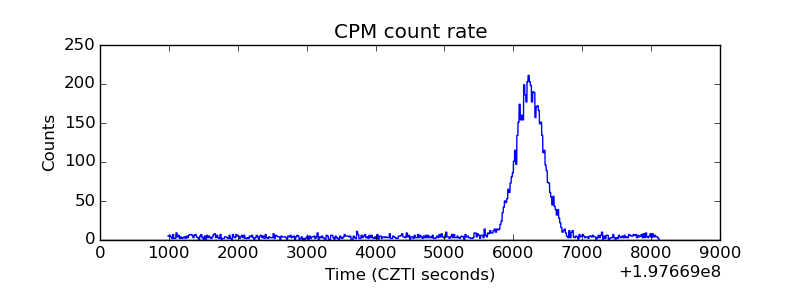 |
| CZT Counter | 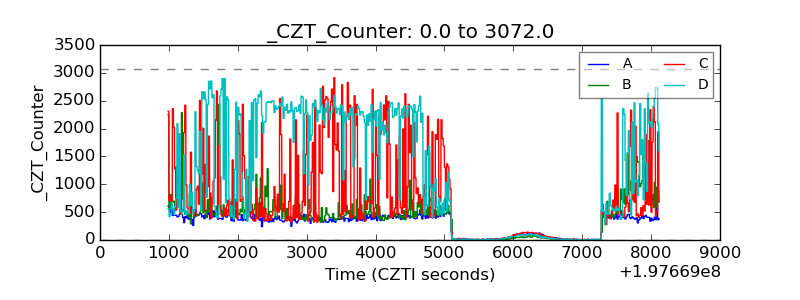 |
| +2.5 Volts monitor | 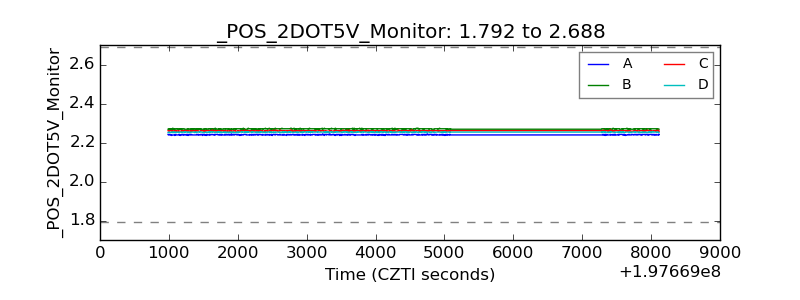 |
| +5 Volts monitor |  |
| Veto Counter | 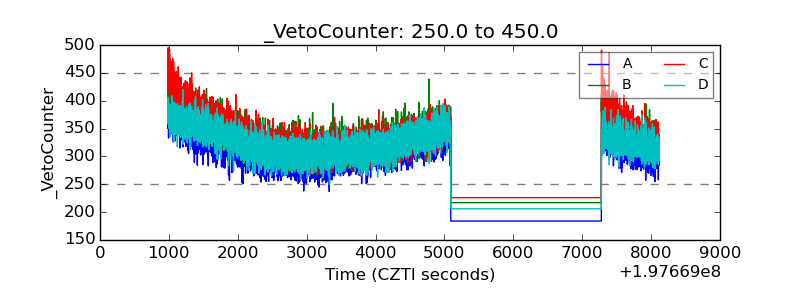 |