| Param | Original file | Final file |
|---|---|---|
| Filename | modeM0/AS1P01_999T99_9000000410_02842cztM0_level2.evt | modeM0/AS1P01_999T99_9000000410_02842cztM0_level2_quad_clean.evt |
| Size (bytes) | 585,480,960 | 33,580,800 |
| Size | 558.4 MB | 32.0 MB |
| Events in quadrant A | 2,041,945 | 190,322 |
| Events in quadrant B | 2,592,282 | 196,415 |
| Events in quadrant C | 4,751,428 | 184,348 |
| Events in quadrant D | 8,038,361 | 125,691 |
| Mode SS | |||
|---|---|---|---|
| Quadrant | BADHDUFLAG | Total packets | Discarded packets |
| A | 0 | 94 | 0 |
| B | 0 | 94 | 0 |
| C | 0 | 94 | 0 |
| D | 0 | 94 | 0 |
| Mode M9 | |||
|---|---|---|---|
| Quadrant | BADHDUFLAG | Total packets | Discarded packets |
| A | 0 | 21 | 0 |
| B | 0 | 21 | 0 |
| C | 0 | 21 | 0 |
| D | 0 | 21 | 0 |
| Mode M0 | |||
|---|---|---|---|
| Quadrant | BADHDUFLAG | Total packets | Discarded packets |
| A | 0 | 9633 | 1 |
| B | 0 | 10967 | 1 |
| C | 0 | 17328 | 1 |
| D | 0 | 26993 | 1 |
| Quadrant | Total seconds | Saturated seconds | Saturation percentage |
|---|---|---|---|
| A | 4528 | 34 | 0.750883% |
| B | 4528 | 18 | 0.397527% |
| C | 4528 | 824 | 18.197880% |
| D | 4528 | 2674 | 59.054770% |
Noise dominated data is calculated using 1-second bins in cleaned event files. If a bin has >2000 counts, and if more than 50% of those come from <1% of pixels, then it is considered to be noise-dominated and hence unusable.
| Quadrant | # 1 sec bins | Bins with >0 counts | Bins with >2000 counts | High rate bins dominated by noise | Noise dominated (total time) | Noise dominated (detector-on time) | Marked lightcurve |
|---|---|---|---|---|---|---|---|
| A | 6685 | 4528 | 30 | 30 | 0.45% | 0.66% | 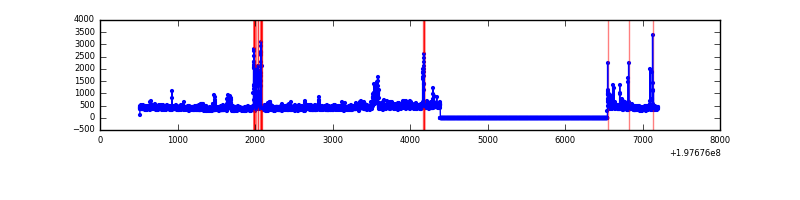 |
| B | 6685 | 4528 | 9 | 9 | 0.13% | 0.20% | 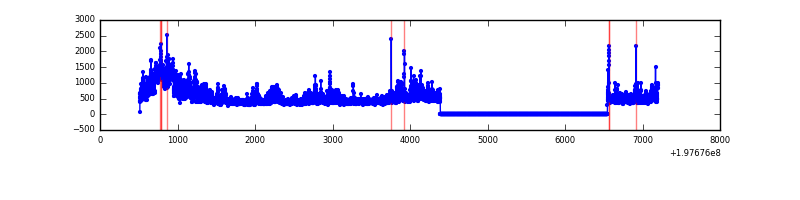 |
| C | 6685 | 4528 | 688 | 688 | 10.29% | 15.19% | 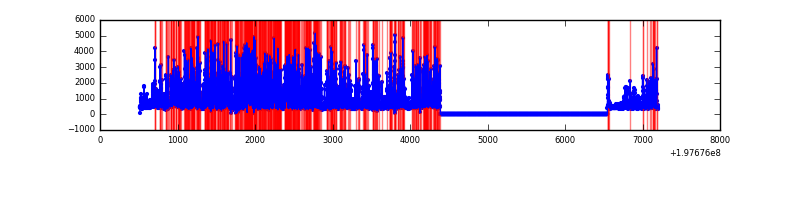 |
| D | 6685 | 4528 | 2006 | 2006 | 30.01% | 44.30% | 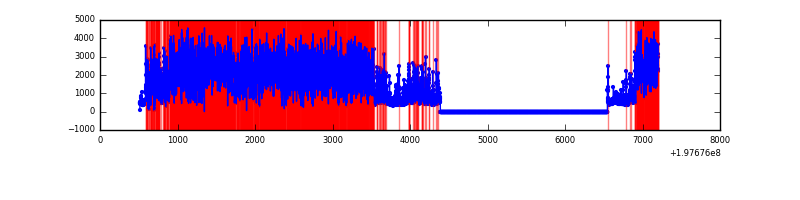 |
Top three noisy pixels from each quadrant. If the there are fewer than three noisy pixels in the level2.evt file, extra rows are filled as -1
| Pixel properties | Quadrant properties | ||||||
|---|---|---|---|---|---|---|---|
| Quadrant | DetID | PixID | Counts | Sigma | Mean | Median | Sigma |
| A | 13 | 48 | 127711 | 1359.62 | 455 | 446 | 93.6 |
| A | 14 | 249 | 116258 | 1237.26 | 455 | 446 | 93.6 |
| A | 13 | 34 | 15309 | 158.79 | 455 | 446 | 93.6 |
| B | 3 | 28 | 527636 | 5690.41 | 466 | 454 | 92.6 |
| B | 6 | 36 | 72560 | 778.31 | 466 | 454 | 92.6 |
| B | 3 | 29 | 58506 | 626.61 | 466 | 454 | 92.6 |
| C | 8 | 81 | 2820436 | 28547.6 | 420 | 422 | 98.8 |
| C | 1 | 192 | 67902 | 683.11 | 420 | 422 | 98.8 |
| C | 8 | 82 | 59498 | 598.04 | 420 | 422 | 98.8 |
| D | 15 | 50 | 4137282 | 56053.07 | 290 | 284 | 73.8 |
| D | 15 | 194 | 2594492 | 35149.48 | 290 | 284 | 73.8 |
| D | 1 | 83 | 96638 | 1305.52 | 290 | 284 | 73.8 |
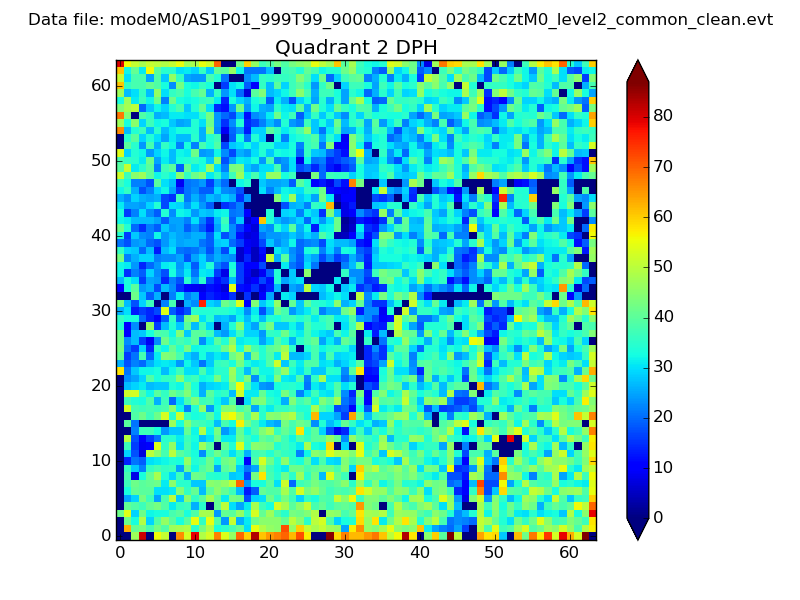
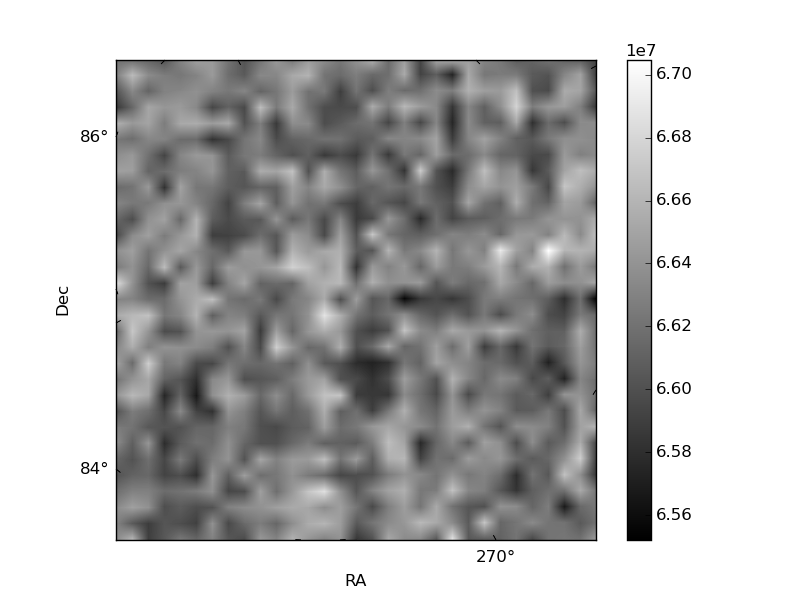
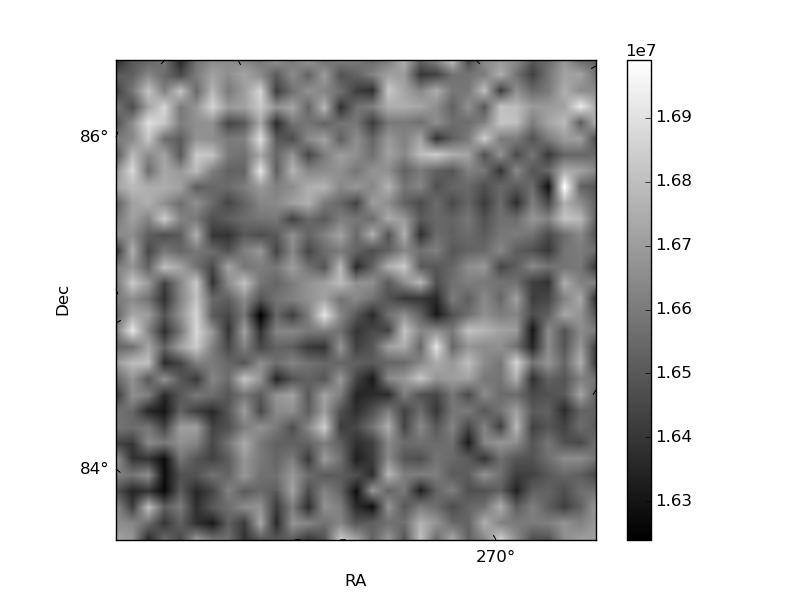
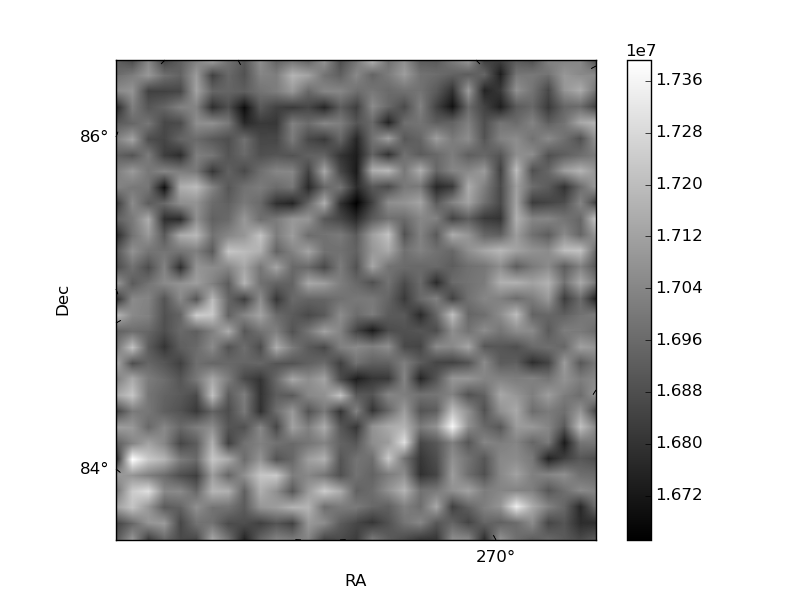
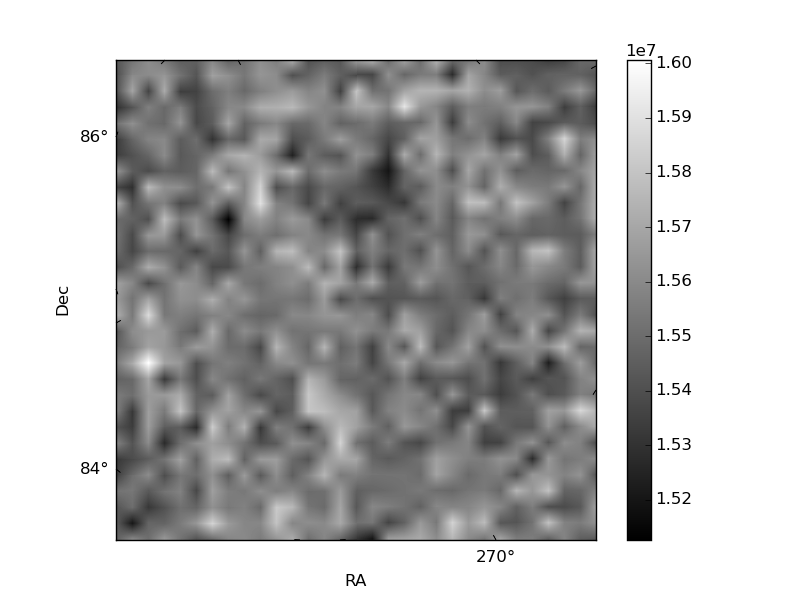
Histogram calculated using DETX and DETY for each event in the final _common_clean file
| Quadrant A | 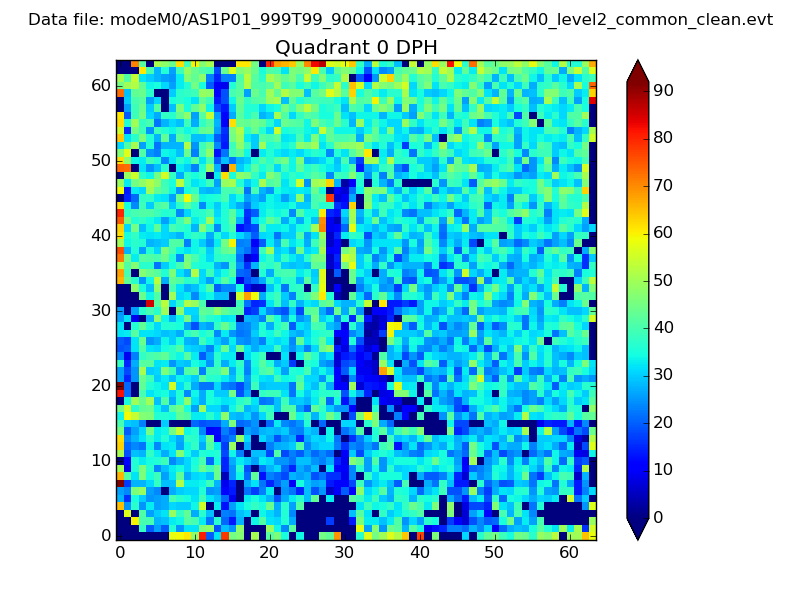 |
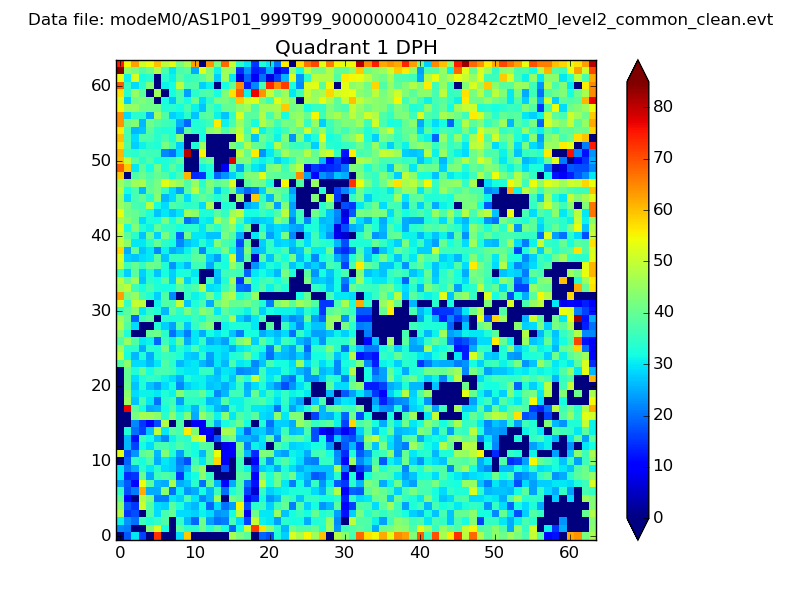 |
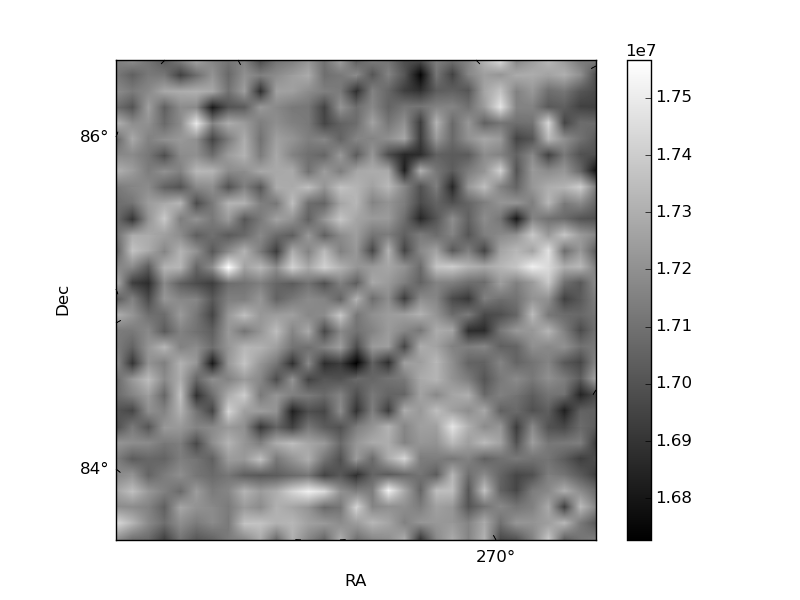
Quadrant B |
|---|---|---|---|
| Quadrant D | 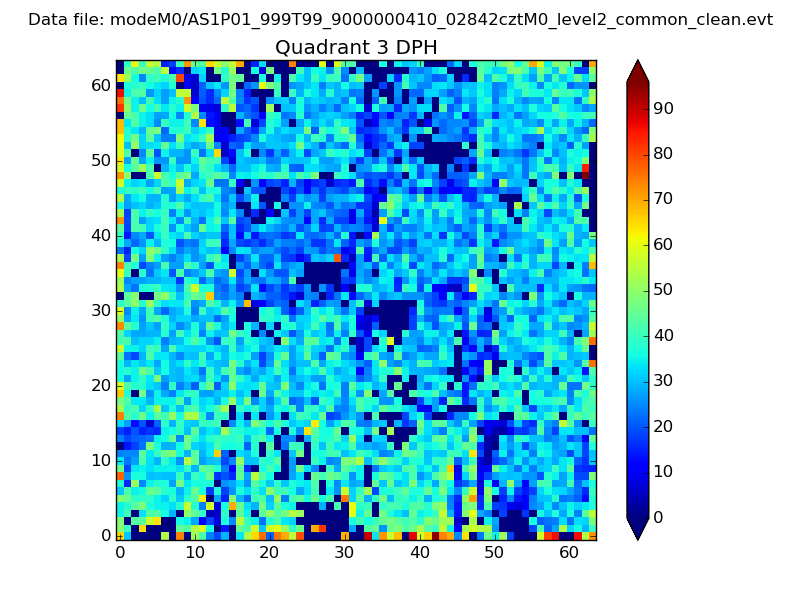 |
 |
Quadrant C |
| Plot type | Count rate plots | Images |
|---|---|---|
| Comparison with Poisson distribution Blue bars denote a histogram of data divided into 1 sec bins. Red curve is a Poisson curve with rate = median count rate of data. |
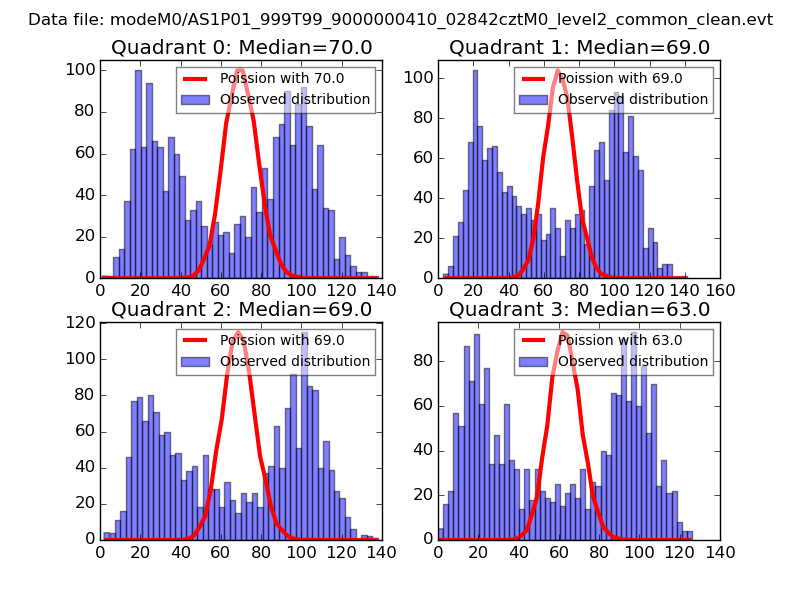 |
 |
| Quadrant-wise count rates Data is divided into 100 sec bins |
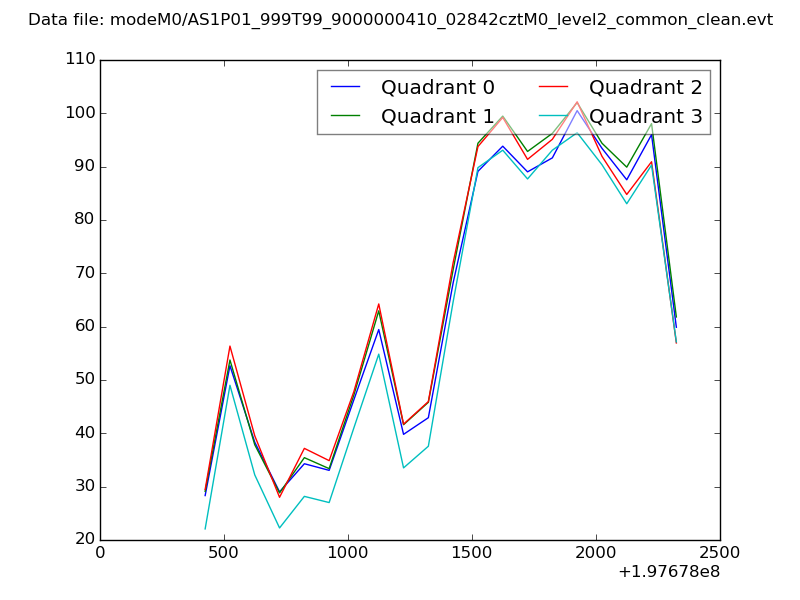 |
|
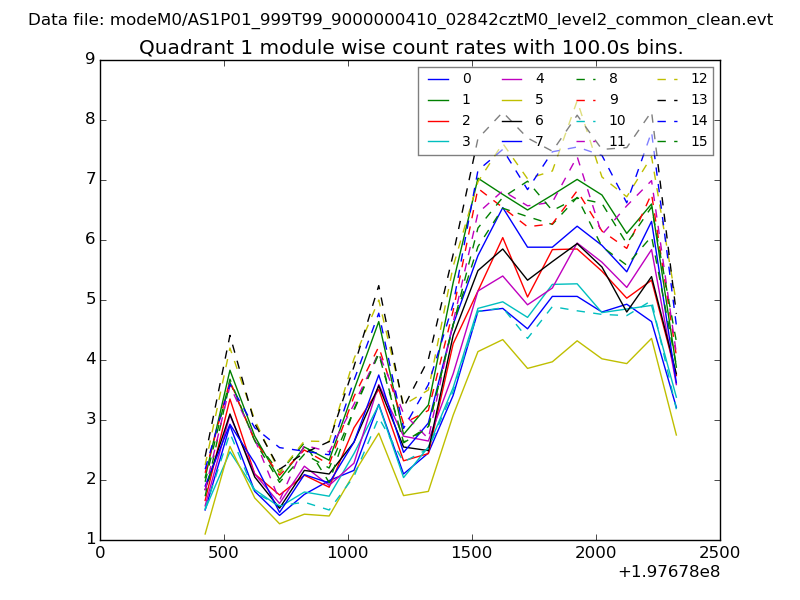
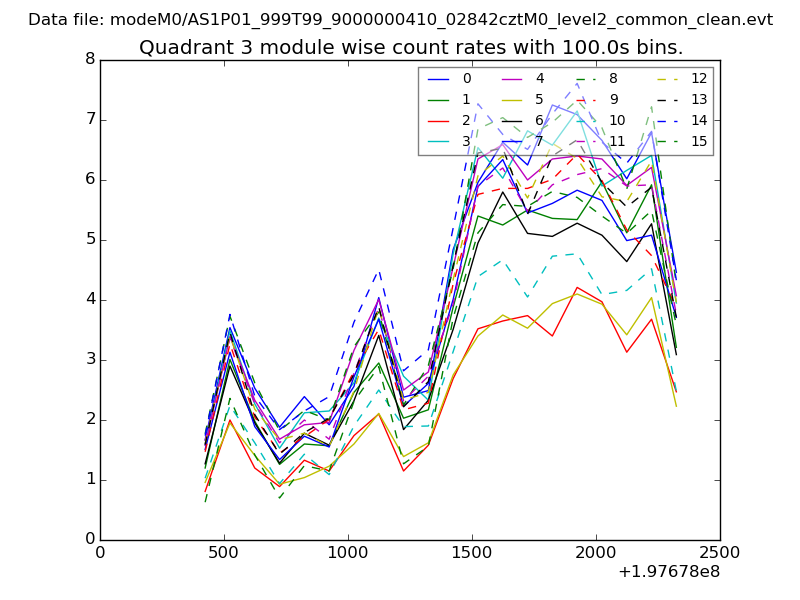
| Module-wise count rates for Quadrant A Data is divided into 100 sec bins |
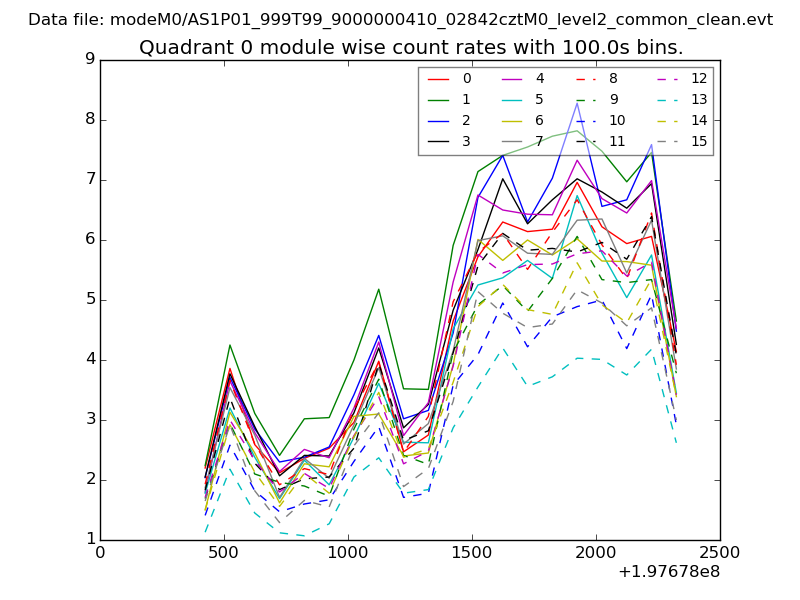 |
 |
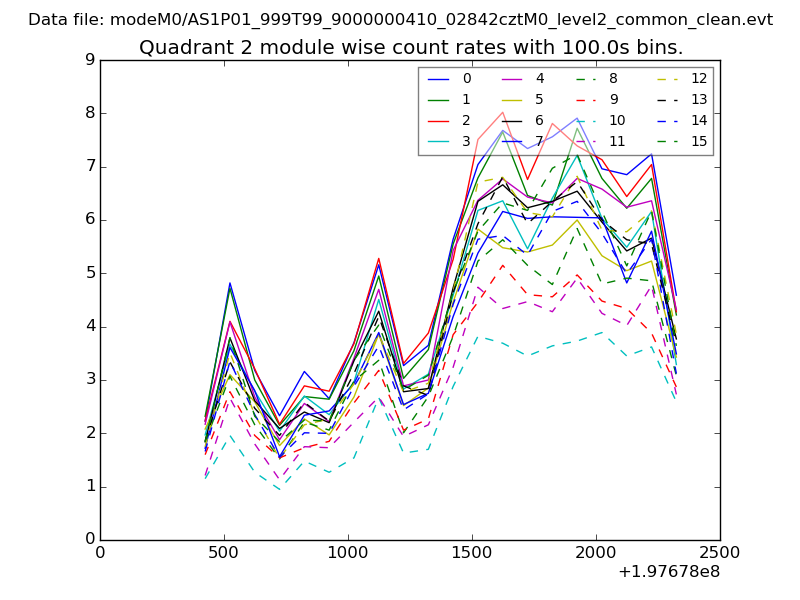
| Module-wise count rates for Quadrant B Data is divided into 100 sec bins |
 |
 |
| Module-wise count rates for Quadrant C Data is divided into 100 sec bins |
 |
 |
| Module-wise count rates for Quadrant D Data is divided into 100 sec bins |
 |
 |
| Parameter | Plot |
|---|---|
| CZT HV Monitor | 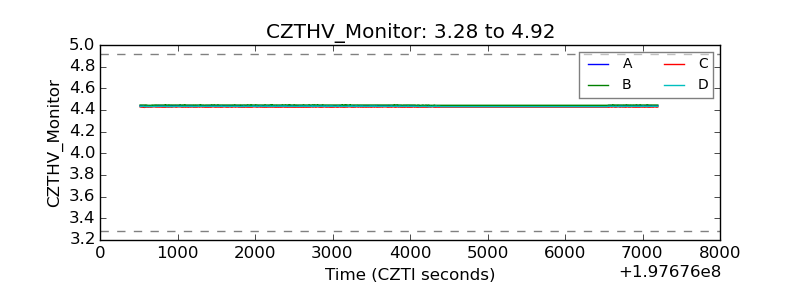 |
| D_VDD | 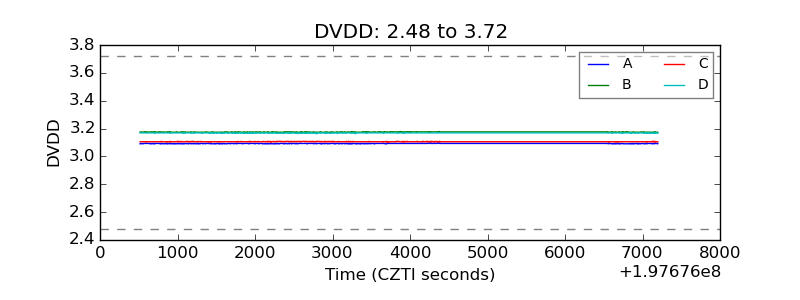 |
| Temperature 1 | 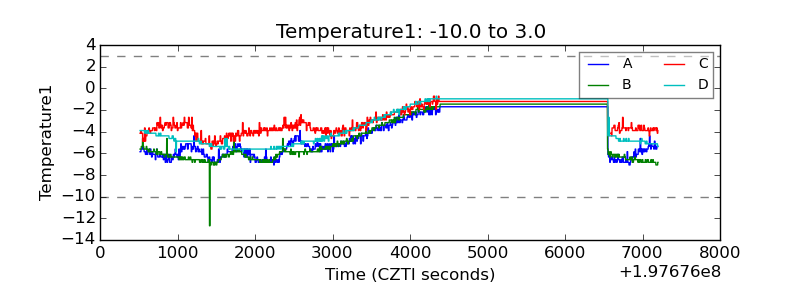 |
| Veto HV Monitor | 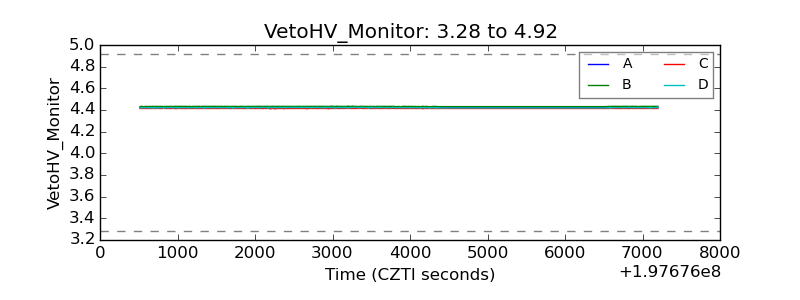 |
| Veto LLD | 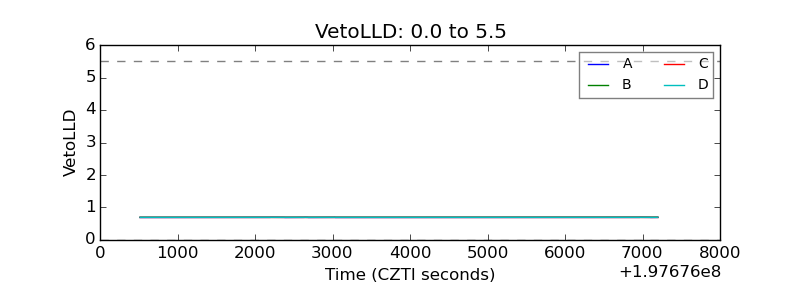 |
| Alpha Counter | 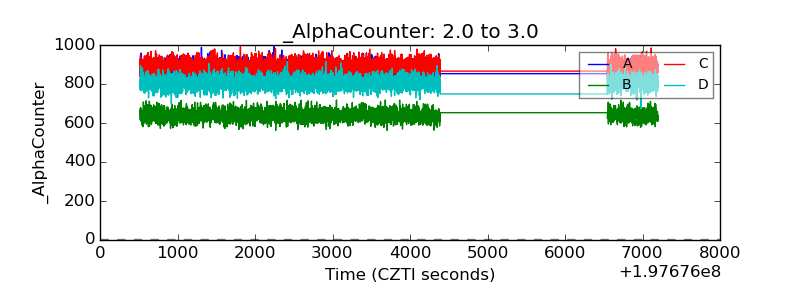 |
| _CPM_Rate | 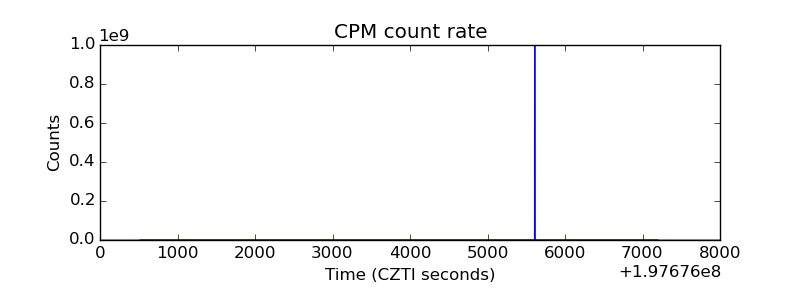 |
| CZT Counter | 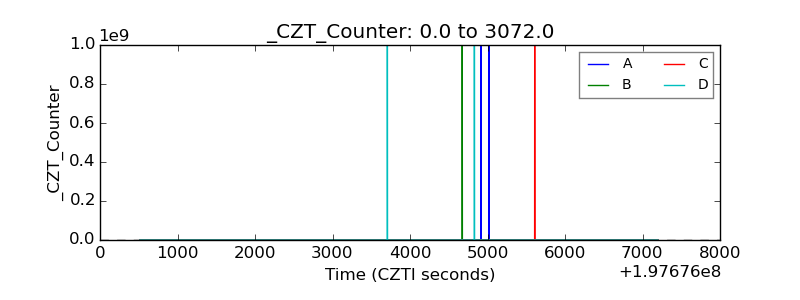 |
| +2.5 Volts monitor |  |
| +5 Volts monitor | 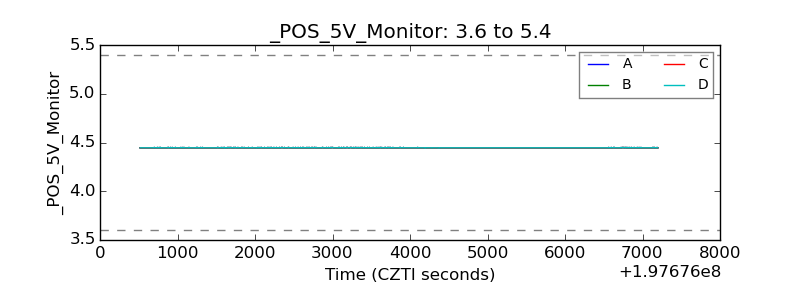 |
| Veto Counter | 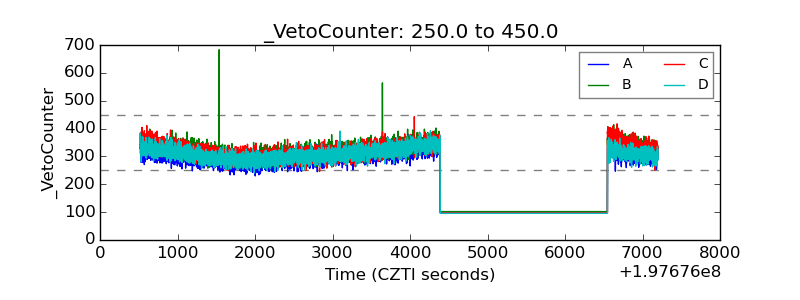 |