| Param | Original file | Final file |
|---|---|---|
| Filename | modeM0/AS1P01_999T99_9000000410_02933cztM0_level2.evt | modeM0/AS1P01_999T99_9000000410_02933cztM0_level2_quad_clean.evt |
| Size (bytes) | 113,656,320 | 11,027,520 |
| Size | 108.4 MB | 10.5 MB |
| Events in quadrant A | 317,984 | 76,045 |
| Events in quadrant B | 385,700 | 78,302 |
| Events in quadrant C | 1,161,182 | 67,900 |
| Events in quadrant D | 1,522,860 | 50,341 |
| Mode SS | |||
|---|---|---|---|
| Quadrant | BADHDUFLAG | Total packets | Discarded packets |
| A | 0 | 14 | 0 |
| B | 0 | 14 | 0 |
| C | 0 | 14 | 0 |
| D | 0 | 14 | 0 |
| Mode M0 | |||
|---|---|---|---|
| Quadrant | BADHDUFLAG | Total packets | Discarded packets |
| A | 0 | 1530 | 1 |
| B | 0 | 1667 | 0 |
| C | 0 | 3987 | 0 |
| D | 0 | 5030 | 0 |
| Quadrant | Total seconds | Saturated seconds | Saturation percentage |
|---|---|---|---|
| A | 761 | 2 | 0.262812% |
| B | 761 | 0 | 0.000000% |
| C | 761 | 273 | 35.873850% |
| D | 761 | 495 | 65.045992% |
Noise dominated data is calculated using 1-second bins in cleaned event files. If a bin has >2000 counts, and if more than 50% of those come from <1% of pixels, then it is considered to be noise-dominated and hence unusable.
| Quadrant | # 1 sec bins | Bins with >0 counts | Bins with >2000 counts | High rate bins dominated by noise | Noise dominated (total time) | Noise dominated (detector-on time) | Marked lightcurve |
|---|---|---|---|---|---|---|---|
| A | 761 | 761 | 0 | 0 | 0.00% | 0.00% | 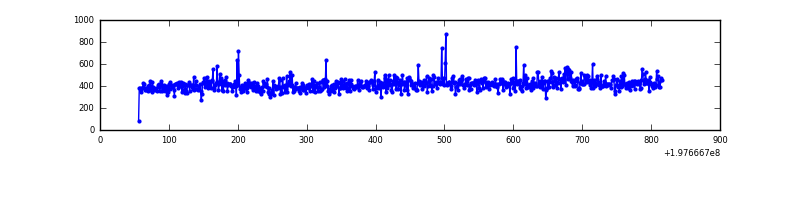 |
| B | 761 | 761 | 0 | 0 | 0.00% | 0.00% |  |
| C | 761 | 761 | 212 | 212 | 27.86% | 27.86% | 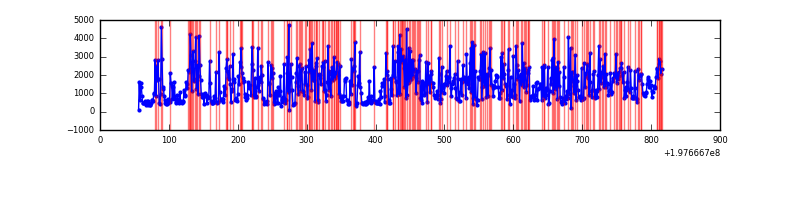 |
| D | 761 | 761 | 401 | 401 | 52.69% | 52.69% | 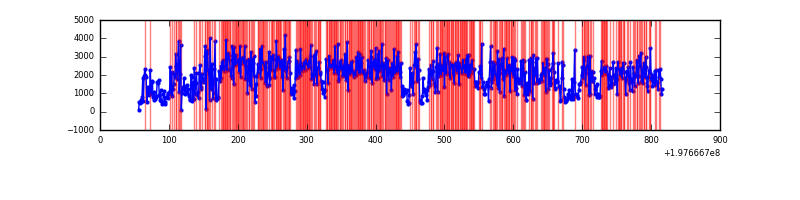 |
Top three noisy pixels from each quadrant. If the there are fewer than three noisy pixels in the level2.evt file, extra rows are filled as -1
| Pixel properties | Quadrant properties | ||||||
|---|---|---|---|---|---|---|---|
| Quadrant | DetID | PixID | Counts | Sigma | Mean | Median | Sigma |
| A | 10 | 17 | 3421 | 178.83 | 80 | 78 | 18.7 |
| A | 8 | 15 | 3314 | 173.1 | 80 | 78 | 18.7 |
| A | 12 | 96 | 1490 | 75.53 | 80 | 78 | 18.7 |
| B | 3 | 28 | 57580 | 3182.16 | 82 | 80 | 18.1 |
| B | 3 | 11 | 6739 | 368.52 | 82 | 80 | 18.1 |
| B | 14 | 167 | 3331 | 179.92 | 82 | 80 | 18.1 |
| C | 8 | 81 | 526773 | 30172.58 | 67 | 67 | 17.5 |
| C | 14 | 223 | 192581 | 11028.25 | 67 | 67 | 17.5 |
| C | 1 | 192 | 118817 | 6802.64 | 67 | 67 | 17.5 |
| D | 15 | 50 | 737957 | 51684.15 | 51 | 50 | 14.3 |
| D | 15 | 194 | 450887 | 31577.32 | 51 | 50 | 14.3 |
| D | 2 | 209 | 117335 | 8214.82 | 51 | 50 | 14.3 |
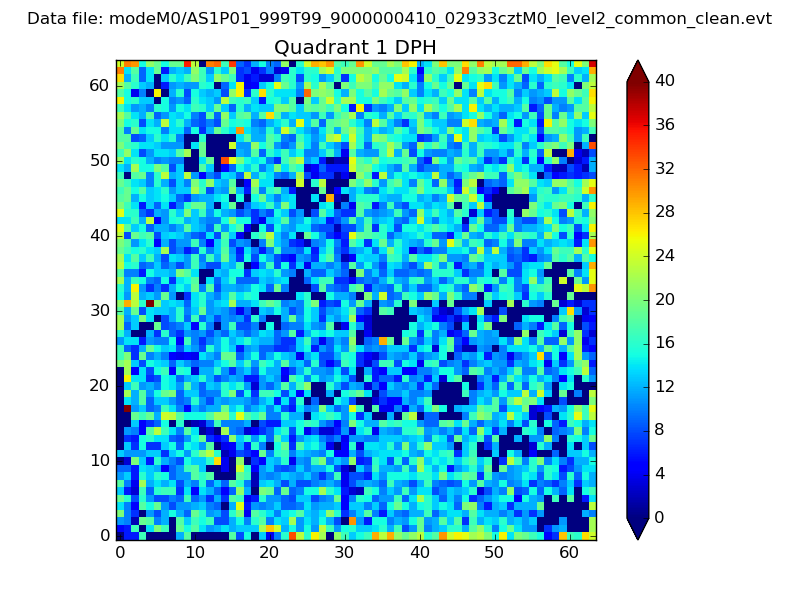
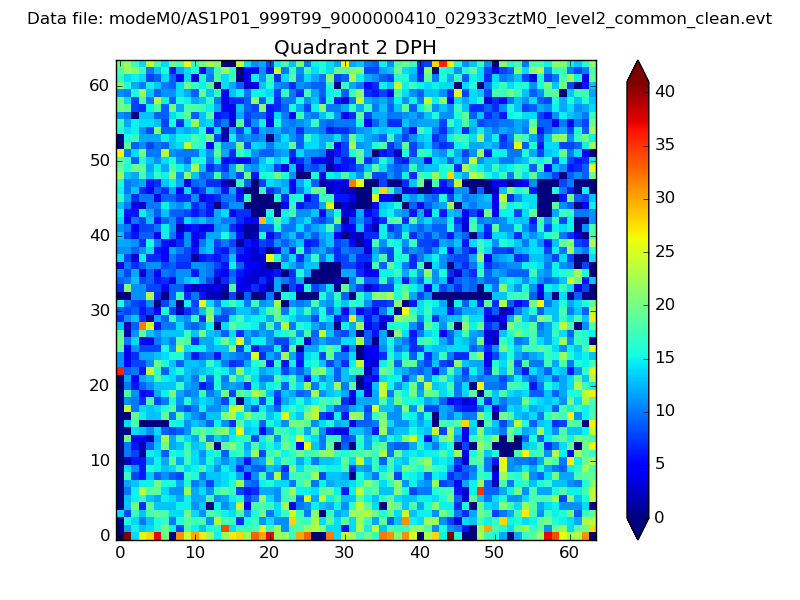
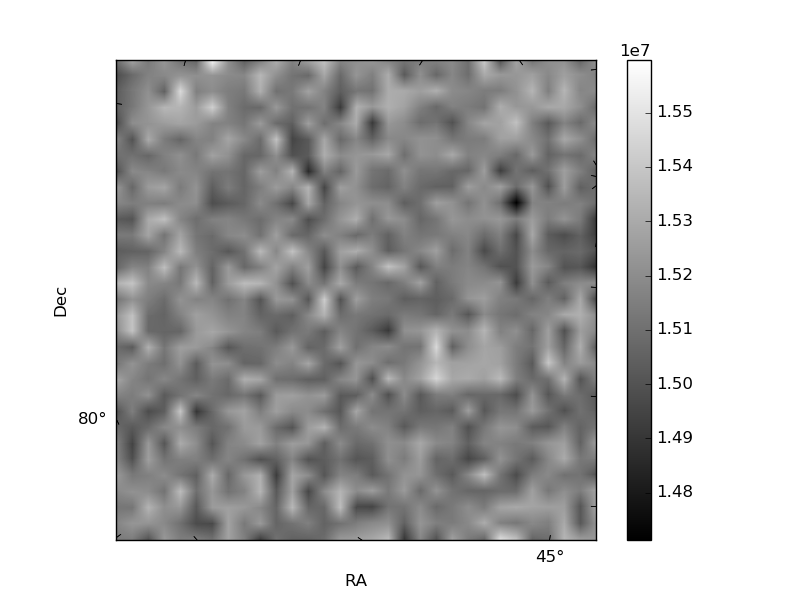
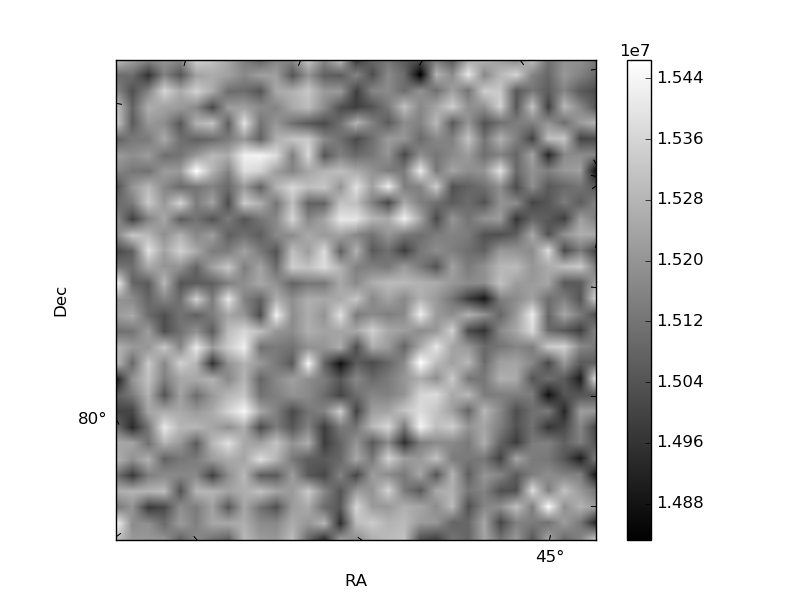
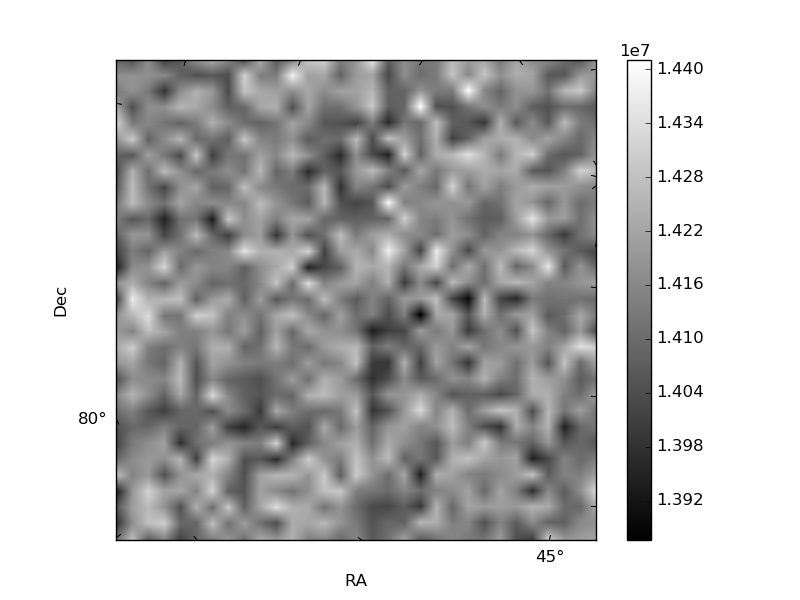
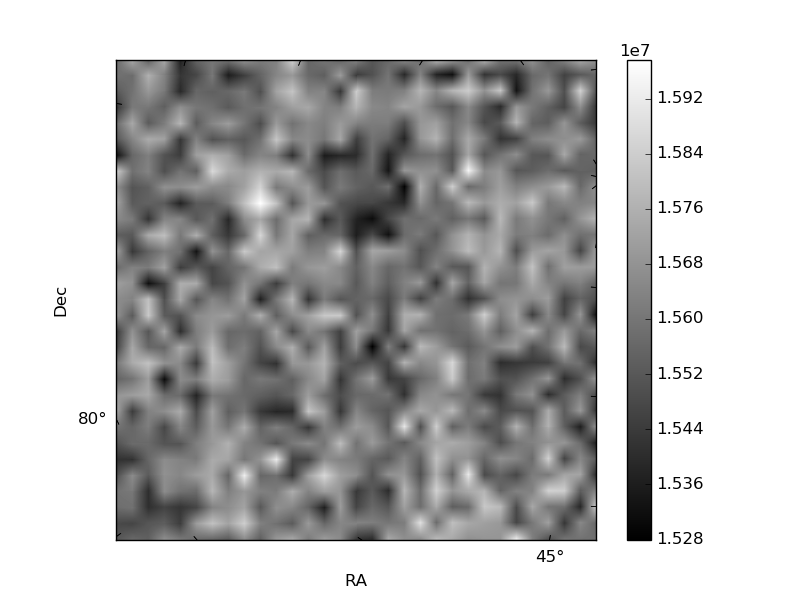
Histogram calculated using DETX and DETY for each event in the final _common_clean file
| Quadrant A | 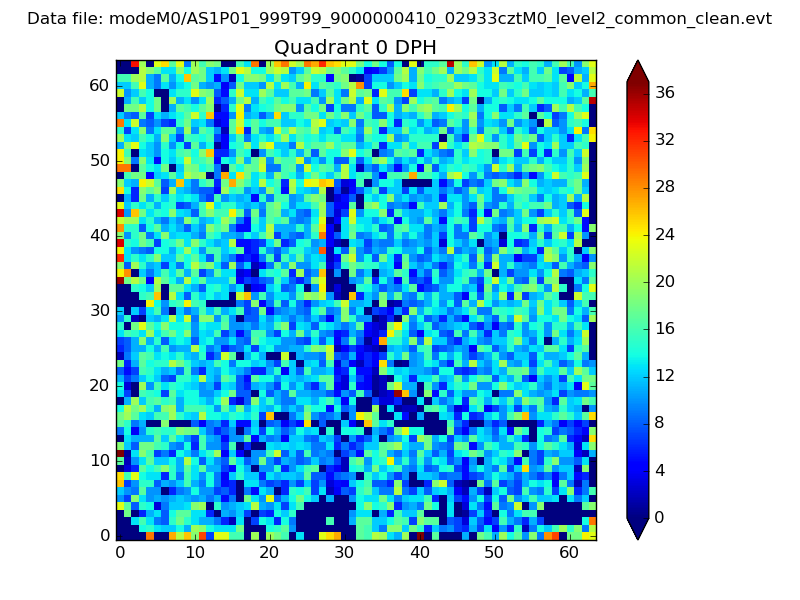 |
 |
Quadrant B |
|---|---|---|---|
| Quadrant D | 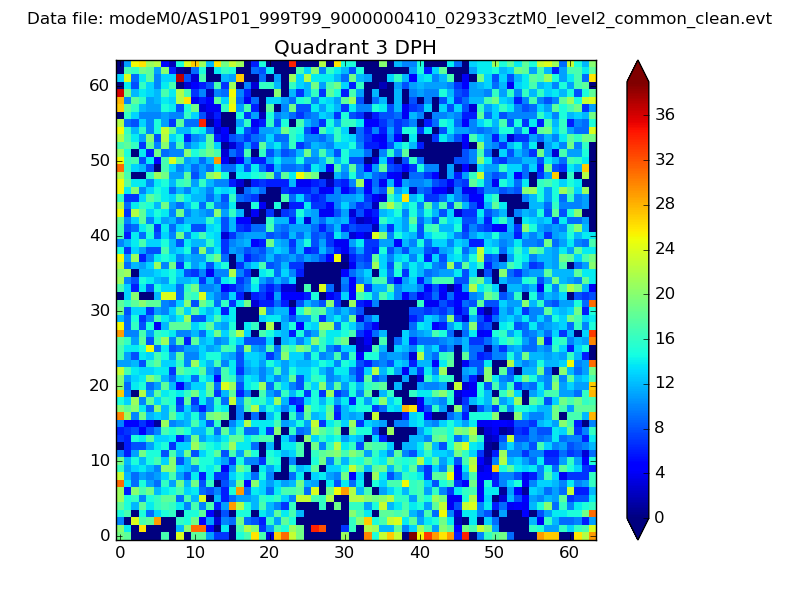 |
 |
Quadrant C |
| Plot type | Count rate plots | Images |
|---|---|---|
| Comparison with Poisson distribution Blue bars denote a histogram of data divided into 1 sec bins. Red curve is a Poisson curve with rate = median count rate of data. |
 |
 |
| Quadrant-wise count rates Data is divided into 100 sec bins |
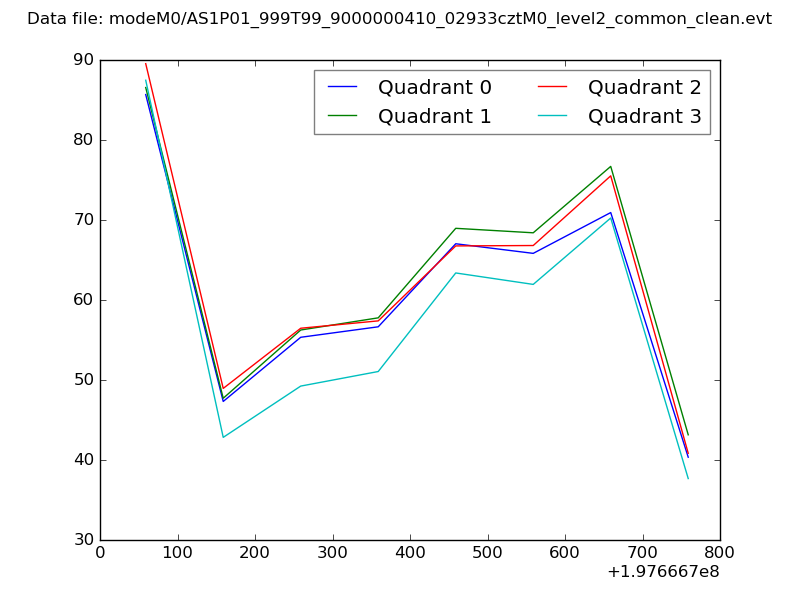 |
|
| Module-wise count rates for Quadrant A Data is divided into 100 sec bins |
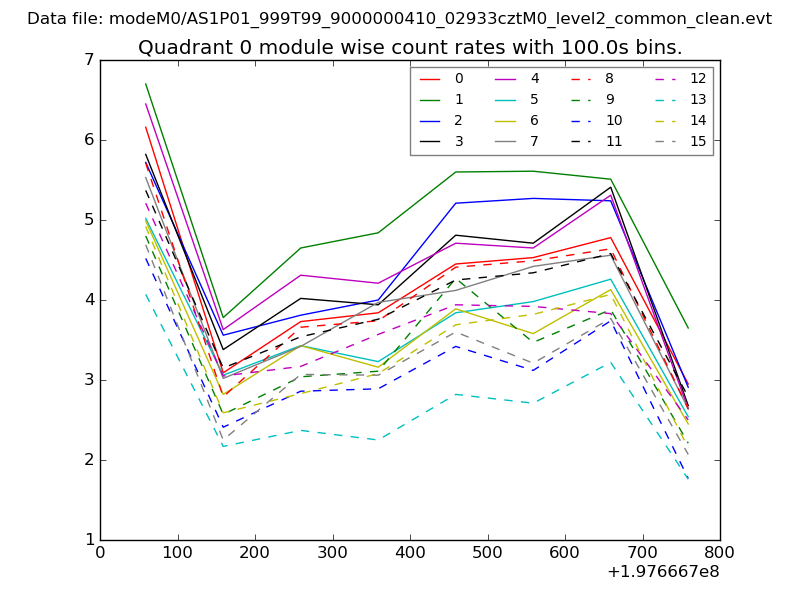 |
 |
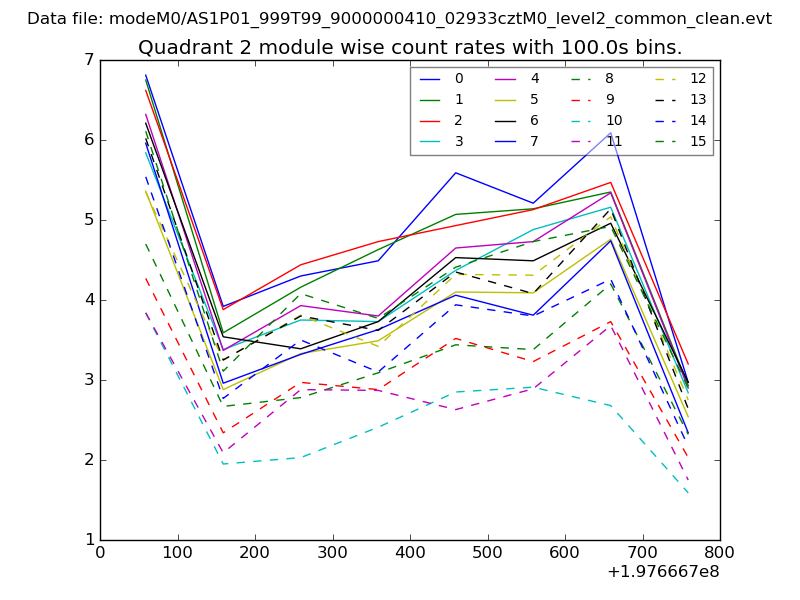
| Module-wise count rates for Quadrant B Data is divided into 100 sec bins |
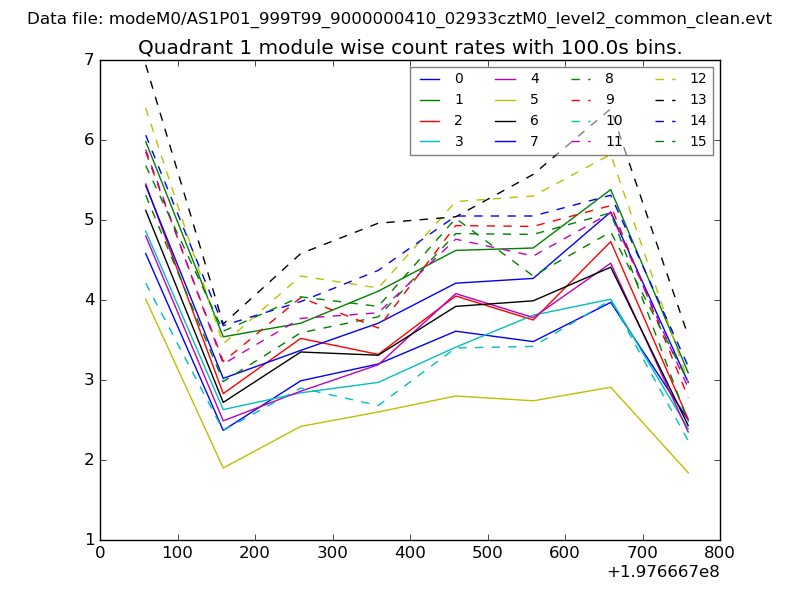 |
 |
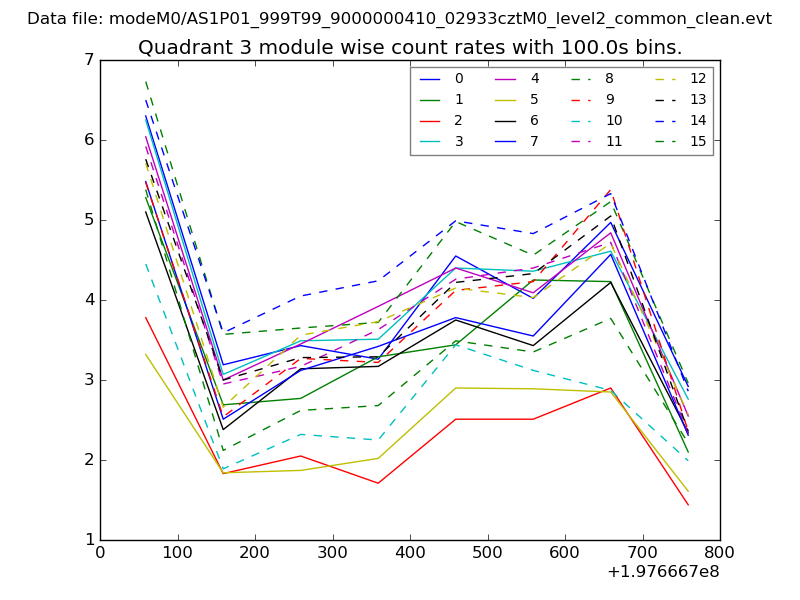
| Module-wise count rates for Quadrant C Data is divided into 100 sec bins |
 |
 |
| Module-wise count rates for Quadrant D Data is divided into 100 sec bins |
 |
 |
| Parameter | Plot |
|---|---|
| CZT HV Monitor | 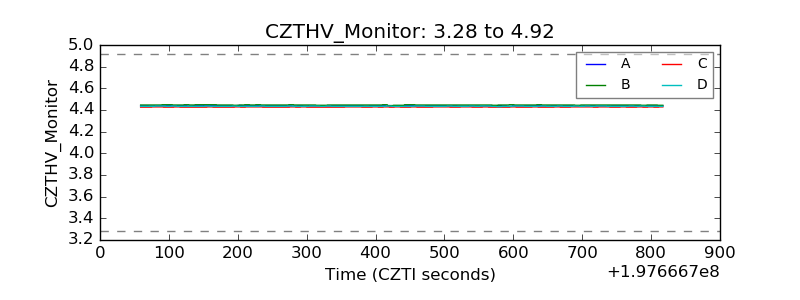 |
| D_VDD | 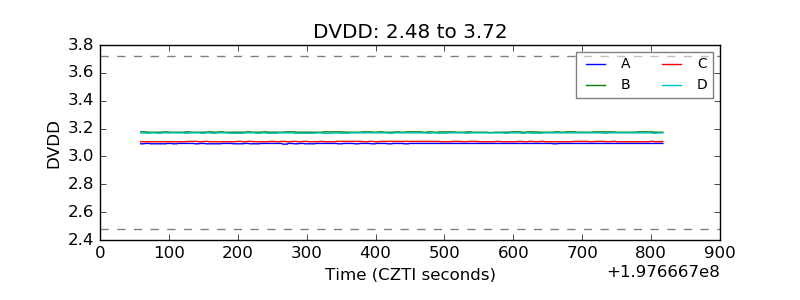 |
| Temperature 1 |  |
| Veto HV Monitor | 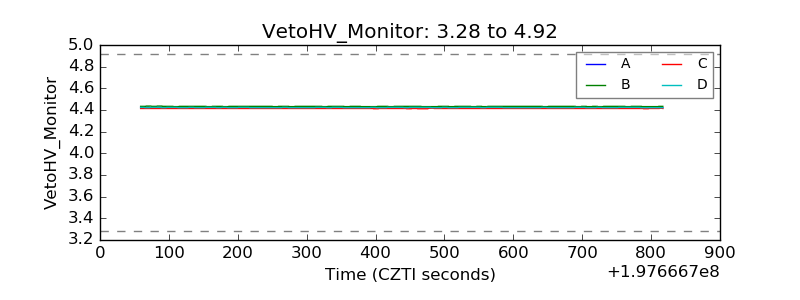 |
| Veto LLD | 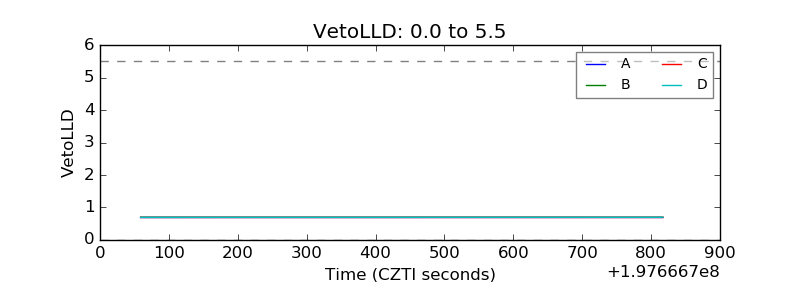 |
| Alpha Counter | 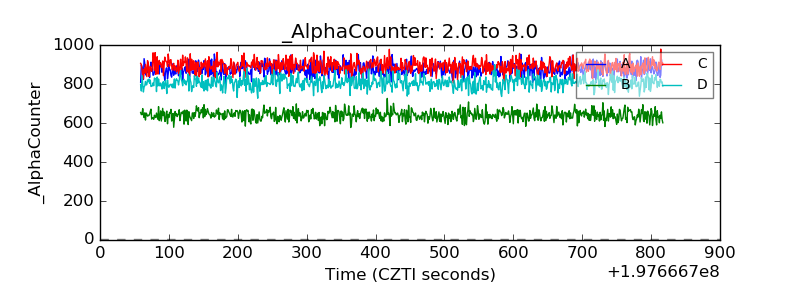 |
| _CPM_Rate | 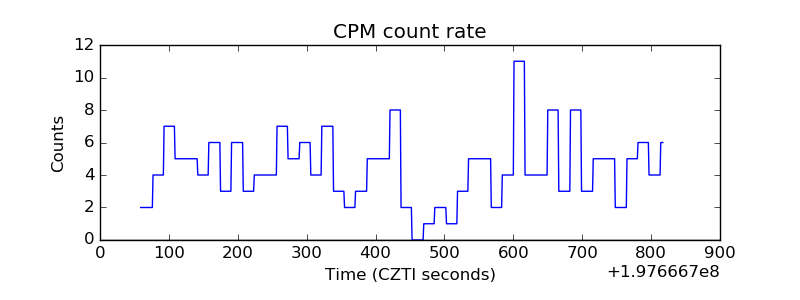 |
| CZT Counter | 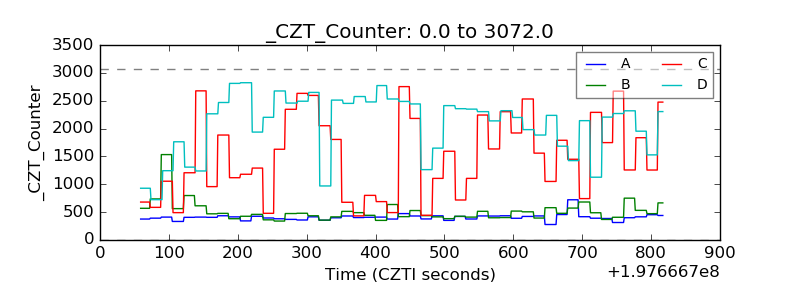 |
| +2.5 Volts monitor | 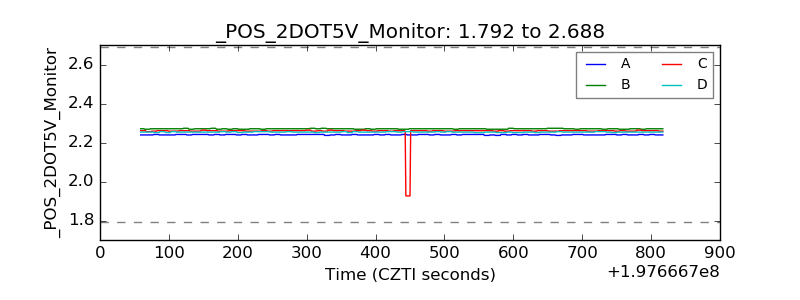 |
| +5 Volts monitor |  |
| Veto Counter | 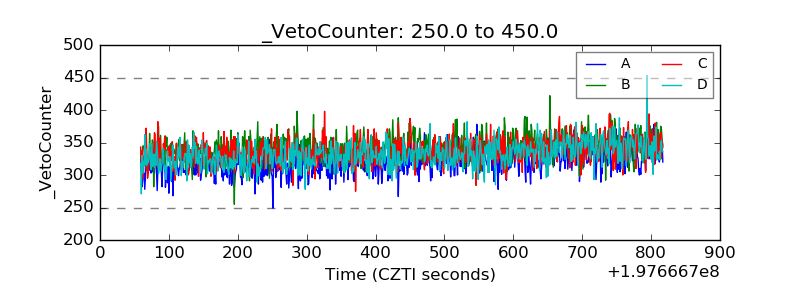 |