| Param | Original file | Final file |
|---|---|---|
| Filename | modeM0/AS1T01_055T01_9000000408cztM0_level2.fits | modeM0/AS1T01_055T01_9000000408cztM0_level2_quad_clean.evt |
| Size (bytes) | 178,885,440 | 168,906,240 |
| Size | 170.6 MB | 161.1 MB |
| Events in quadrant A | 1,052,228 | 970,199 |
| Events in quadrant B | 1,019,064 | 960,876 |
| Events in quadrant C | 1,033,136 | 902,642 |
| Events in quadrant D | 889,528 | 857,812 |
| Mode M9 | |||
|---|---|---|---|
| Quadrant | BADHDUFLAG | Total packets | Discarded packets |
| A | 0 | 13 | 0 |
| B | 0 | 13 | 0 |
| C | 0 | 13 | 0 |
| D | 0 | 13 | 0 |
| Mode SS | |||
|---|---|---|---|
| Quadrant | BADHDUFLAG | Total packets | Discarded packets |
| A | 0 | 420 | 0 |
| B | 0 | 420 | 0 |
| C | 0 | 420 | 0 |
| D | 0 | 420 | 0 |
| Mode M0 | |||
|---|---|---|---|
| Quadrant | BADHDUFLAG | Total packets | Discarded packets |
| A | 0 | 42490 | 0 |
| B | 0 | 47144 | 0 |
| C | 0 | 47676 | 0 |
| D | 0 | 47531 | 0 |
| Quadrant | Total seconds | Saturated seconds | Saturation percentage |
|---|---|---|---|
| A | 20661 | 332 | 1.606892% |
| B | 20661 | 721 | 3.489667% |
| C | 20661 | 604 | 2.923382% |
| D | 20661 | 498 | 2.410338% |
Noise dominated data is calculated using 1-second bins in cleaned event files. If a bin has >2000 counts, and if more than 50% of those come from <1% of pixels, then it is considered to be noise-dominated and hence unusable.
| Quadrant | # 1 sec bins | Bins with >0 counts | Bins with >2000 counts | High rate bins dominated by noise | Noise dominated (total time) | Noise dominated (detector-on time) | Marked lightcurve |
|---|---|---|---|---|---|---|---|
| A | 21956 | 20660 | 0 | 0 | 0.00% | 0.00% | 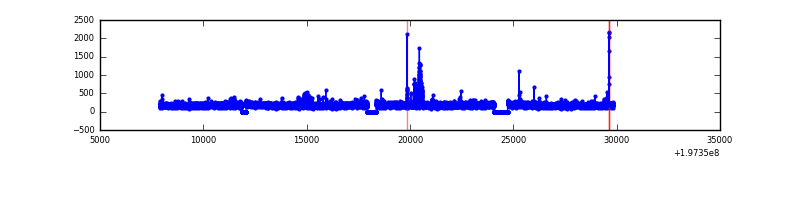 |
| B | 21956 | 20660 | 0 | 0 | 0.00% | 0.00% | 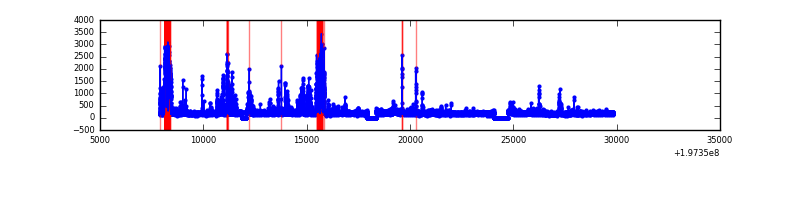 |
| C | 21956 | 20660 | 0 | 0 | 0.00% | 0.00% |  |
| D | 21956 | 20655 | 0 | 0 | 0.00% | 0.00% | 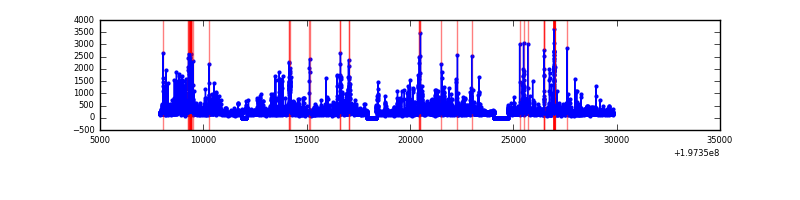 |
Top three noisy pixels from each quadrant. If the there are fewer than three noisy pixels in the level2.evt file, extra rows are filled as -1
| Pixel properties | Quadrant properties | ||||||
|---|---|---|---|---|---|---|---|
| Quadrant | DetID | PixID | Counts | Sigma | Mean | Median | Sigma |
| A | 14 | 188 | 1026 | 10.65 | 273 | 254 | 72.5 |
| A | 0 | 29 | 1018 | 10.54 | 273 | 254 | 72.5 |
| A | 14 | 204 | 904 | 8.96 | 273 | 254 | 72.5 |
| B | 2 | 9 | 881 | 10.93 | 268 | 253 | 57.4 |
| B | 12 | 226 | 794 | 9.42 | 268 | 253 | 57.4 |
| B | 14 | 254 | 763 | 8.88 | 268 | 253 | 57.4 |
| C | 12 | 241 | 782 | 7.04 | 273 | 249 | 75.6 |
| C | 7 | 111 | 763 | 6.79 | 273 | 249 | 75.6 |
| C | 9 | 188 | 713 | 6.13 | 273 | 249 | 75.6 |
| D | 3 | 14 | 727 | 6.8 | 253 | 228 | 73.3 |
| D | 7 | 5 | 658 | 5.86 | 253 | 228 | 73.3 |
| D | 11 | 82 | 649 | 5.74 | 253 | 228 | 73.3 |
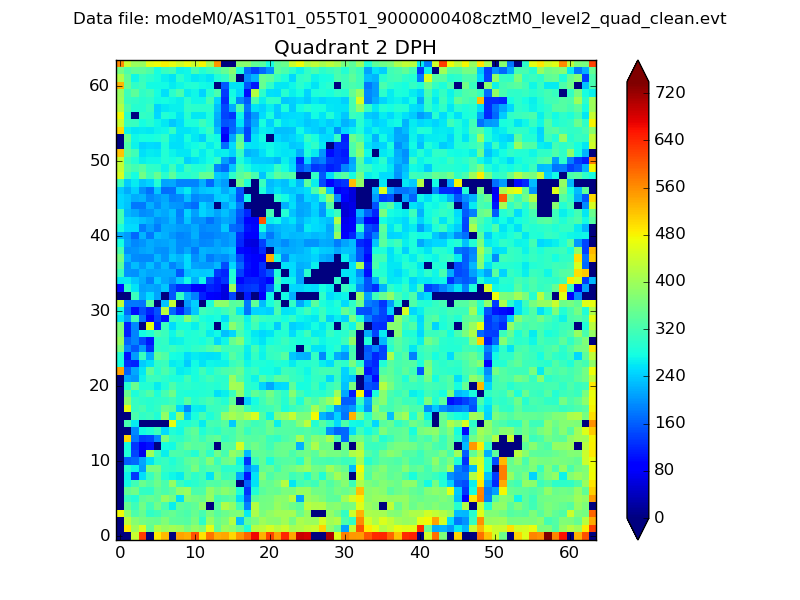
Histogram calculated using DETX and DETY for each event in the final _common_clean file
| Quadrant A | 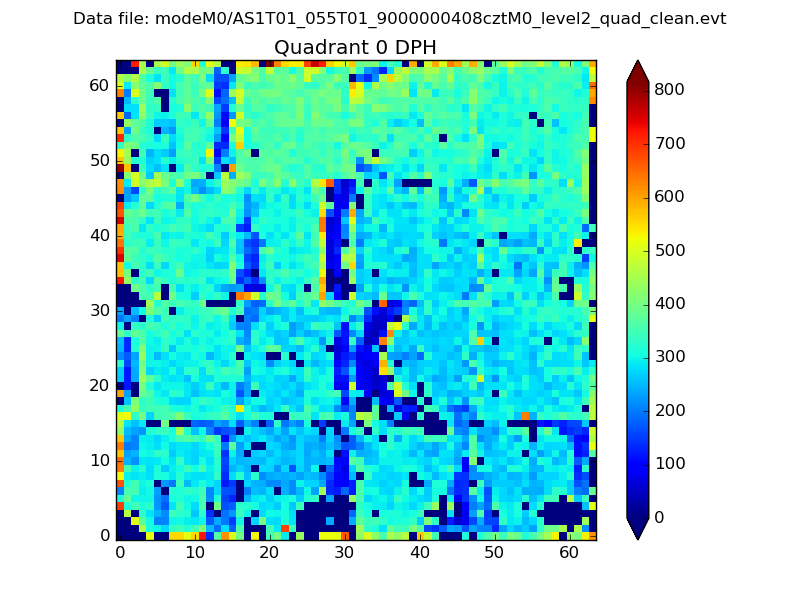 |
 |
Quadrant B |
|---|---|---|---|
| Quadrant D |  |
 |
Quadrant C |
| Plot type | Count rate plots | Images |
|---|---|---|
| Comparison with Poisson distribution Blue bars denote a histogram of data divided into 1 sec bins. Red curve is a Poisson curve with rate = median count rate of data. |
 |
 |
| Quadrant-wise count rates Data is divided into 100 sec bins |
 |
|
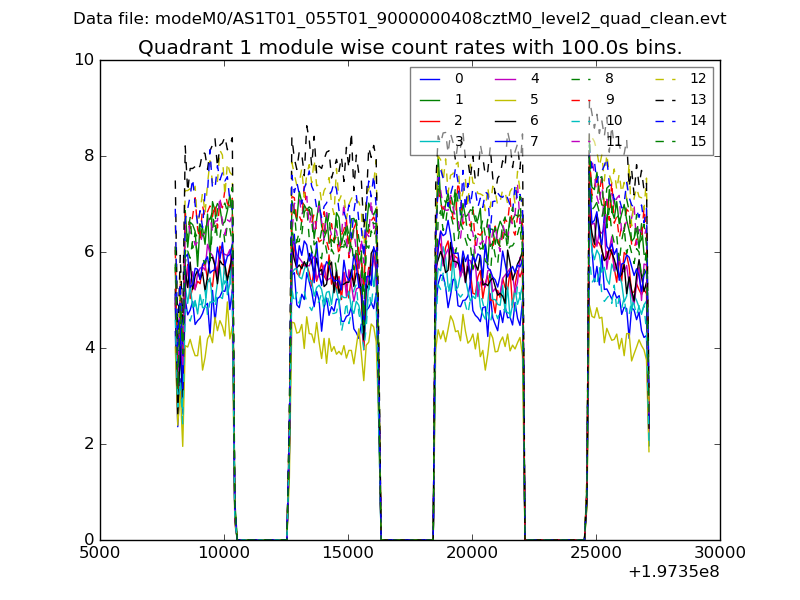
| Module-wise count rates for Quadrant A Data is divided into 100 sec bins |
 |
 |
| Module-wise count rates for Quadrant B Data is divided into 100 sec bins |
 |
 |
| Module-wise count rates for Quadrant C Data is divided into 100 sec bins |
 |
 |
| Module-wise count rates for Quadrant D Data is divided into 100 sec bins |
 |
 |
| Parameter | Plot |
|---|---|
| CZT HV Monitor |  |
| D_VDD | 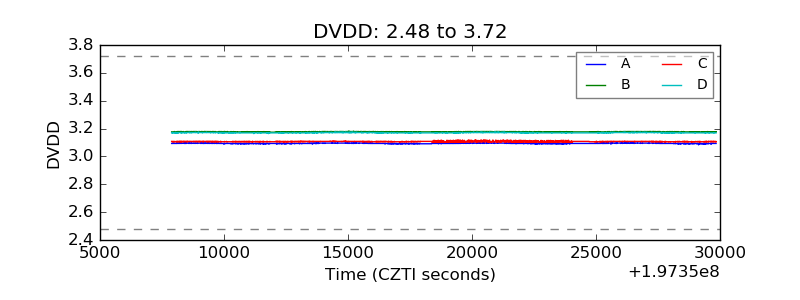 |
| Temperature 1 |  |
| Veto HV Monitor | 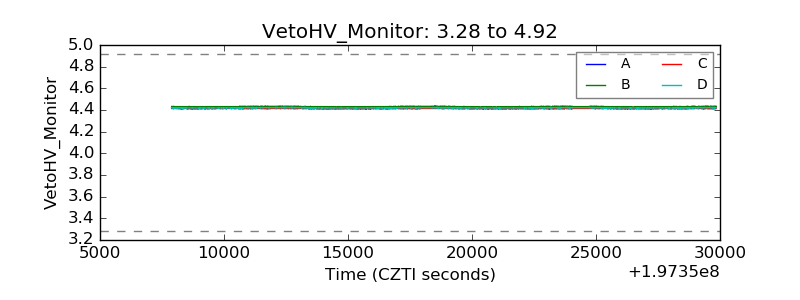 |
| Veto LLD |  |
| Alpha Counter |  |
| _CPM_Rate | 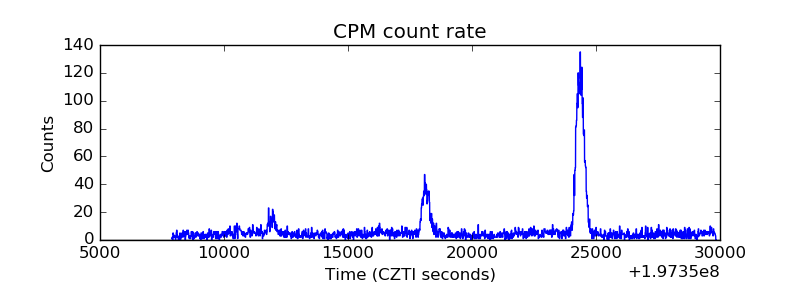 |
| CZT Counter |  |
| +2.5 Volts monitor |  |
| +5 Volts monitor | 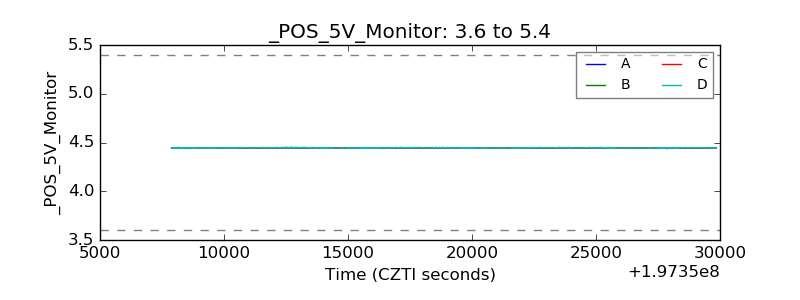 |
| _ROLL_ROT |  |
| _Roll_DEC |  |
| _Roll_RA |  |
| Veto Counter |  |