| Param | Original file | Final file |
|---|---|---|
| Filename | modeM0/AS1T01_055T01_9000000408_02787cztM0_level2.evt | modeM0/AS1T01_055T01_9000000408_02787cztM0_level2_quad_clean.evt |
| Size (bytes) | 544,296,960 | 79,776,000 |
| Size | 519.1 MB | 76.1 MB |
| Events in quadrant A | 3,163,374 | 494,267 |
| Events in quadrant B | 4,340,927 | 478,069 |
| Events in quadrant C | 4,462,323 | 474,045 |
| Events in quadrant D | 4,034,363 | 473,568 |
| Mode M9 | |||
|---|---|---|---|
| Quadrant | BADHDUFLAG | Total packets | Discarded packets |
| A | 0 | 2 | 0 |
| B | 0 | 2 | 0 |
| C | 0 | 2 | 0 |
| D | 0 | 2 | 0 |
| Mode SS | |||
|---|---|---|---|
| Quadrant | BADHDUFLAG | Total packets | Discarded packets |
| A | 0 | 144 | 0 |
| B | 0 | 144 | 0 |
| C | 0 | 144 | 0 |
| D | 0 | 144 | 0 |
| Mode M0 | |||
|---|---|---|---|
| Quadrant | BADHDUFLAG | Total packets | Discarded packets |
| A | 0 | 14565 | 2 |
| B | 0 | 17782 | 1 |
| C | 0 | 17686 | 1 |
| D | 0 | 17034 | 1 |
| Quadrant | Total seconds | Saturated seconds | Saturation percentage |
|---|---|---|---|
| A | 7117 | 155 | 2.177884% |
| B | 7117 | 453 | 6.365041% |
| C | 7117 | 370 | 5.198820% |
| D | 7117 | 237 | 3.330055% |
Noise dominated data is calculated using 1-second bins in cleaned event files. If a bin has >2000 counts, and if more than 50% of those come from <1% of pixels, then it is considered to be noise-dominated and hence unusable.
| Quadrant | # 1 sec bins | Bins with >0 counts | Bins with >2000 counts | High rate bins dominated by noise | Noise dominated (total time) | Noise dominated (detector-on time) | Marked lightcurve |
|---|---|---|---|---|---|---|---|
| A | 7317 | 7117 | 0 | 0 | 0.00% | 0.00% | 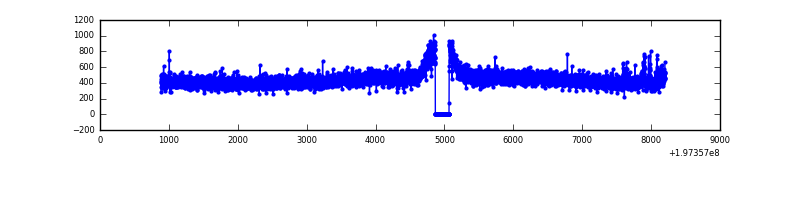 |
| B | 7317 | 7118 | 249 | 249 | 3.40% | 3.50% | 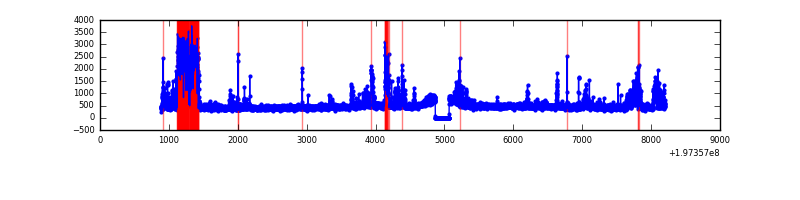 |
| C | 7317 | 7117 | 247 | 247 | 3.38% | 3.47% | 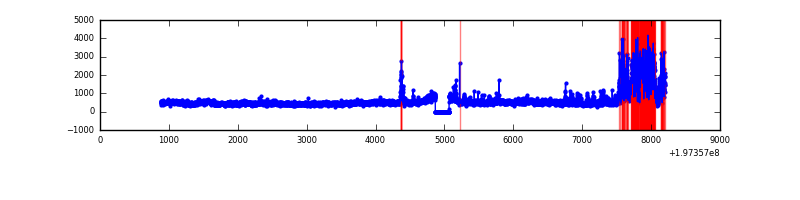 |
| D | 7317 | 7118 | 119 | 119 | 1.63% | 1.67% | 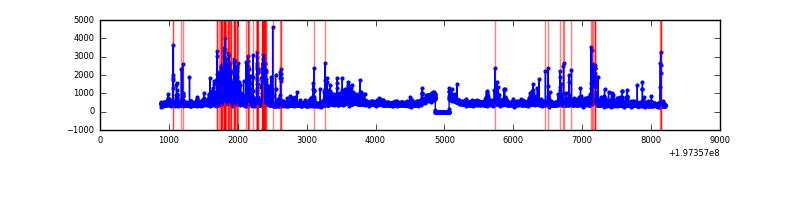 |
Top three noisy pixels from each quadrant. If the there are fewer than three noisy pixels in the level2.evt file, extra rows are filled as -1
| Pixel properties | Quadrant properties | ||||||
|---|---|---|---|---|---|---|---|
| Quadrant | DetID | PixID | Counts | Sigma | Mean | Median | Sigma |
| A | 0 | 128 | 19509 | 111.58 | 809 | 789 | 167.8 |
| A | 8 | 15 | 19479 | 111.41 | 809 | 789 | 167.8 |
| A | 12 | 194 | 9074 | 49.38 | 809 | 789 | 167.8 |
| B | 14 | 167 | 973879 | 6249.04 | 805 | 783 | 155.7 |
| B | 4 | 81 | 135547 | 865.43 | 805 | 783 | 155.7 |
| B | 15 | 85 | 44300 | 279.45 | 805 | 783 | 155.7 |
| C | 2 | 53 | 1082547 | 5909.98 | 775 | 777 | 183.0 |
| C | 0 | 64 | 259195 | 1411.8 | 775 | 777 | 183.0 |
| C | 14 | 67 | 65649 | 354.41 | 775 | 777 | 183.0 |
| D | 13 | 53 | 305851 | 1641.43 | 778 | 758 | 185.9 |
| D | 13 | 169 | 239288 | 1283.31 | 778 | 758 | 185.9 |
| D | 5 | 233 | 104576 | 558.55 | 778 | 758 | 185.9 |
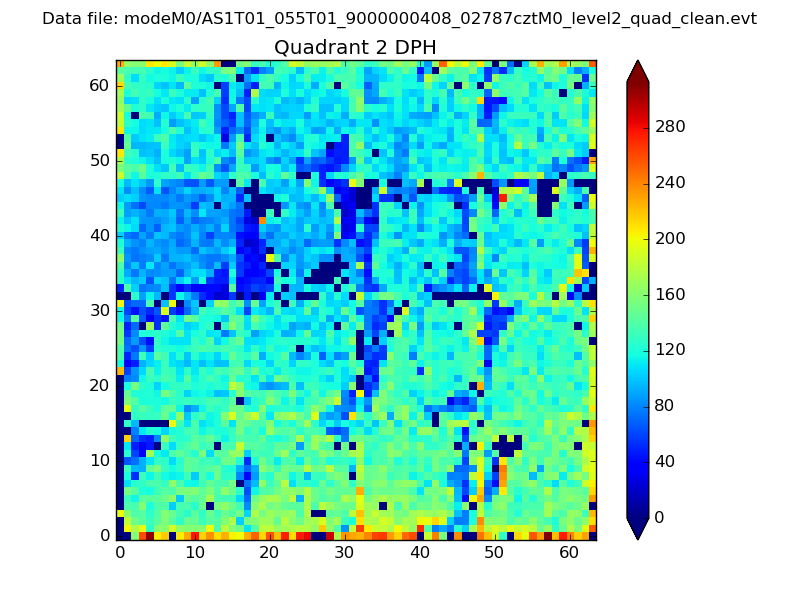
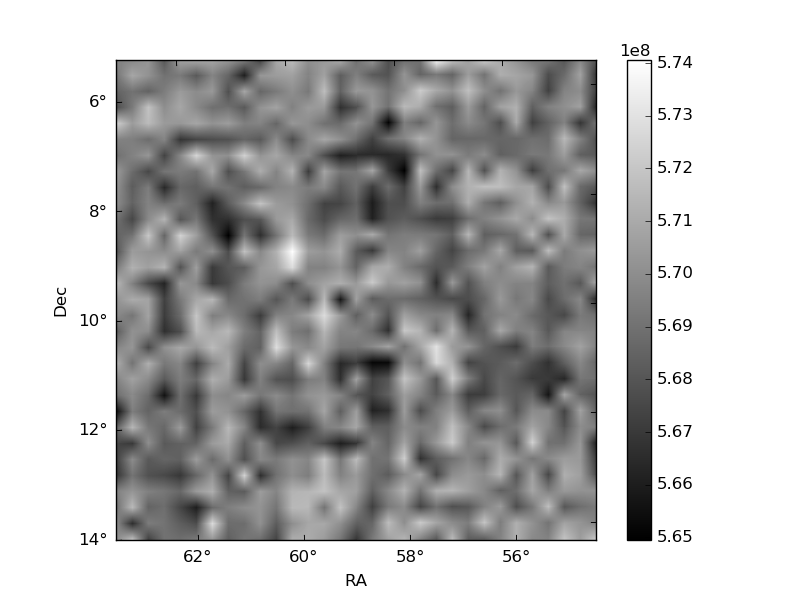
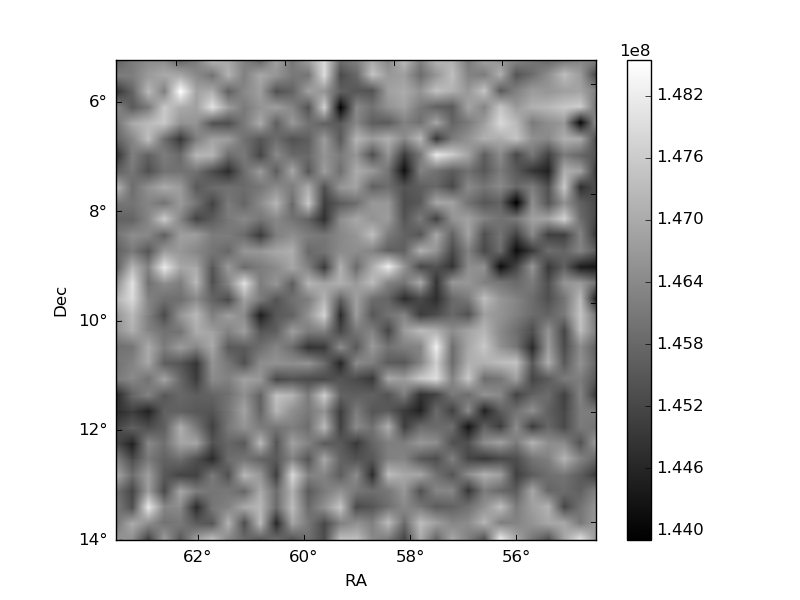
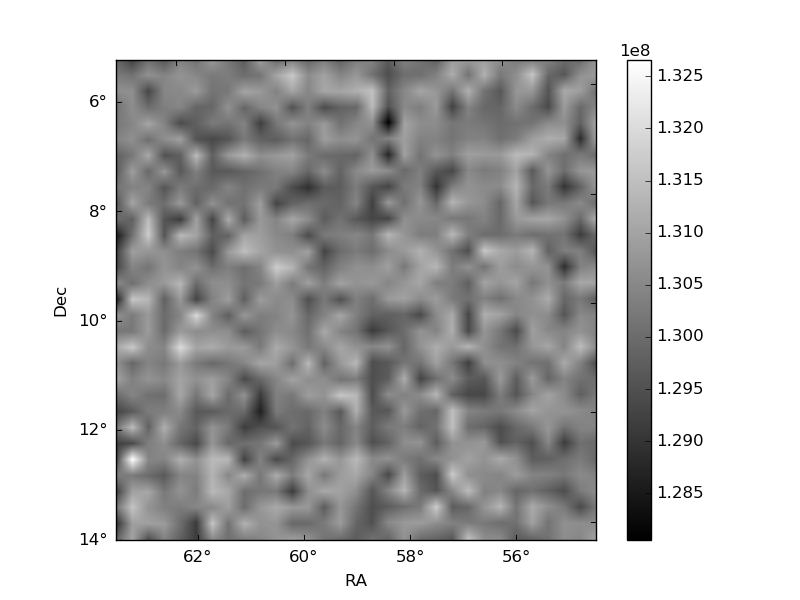
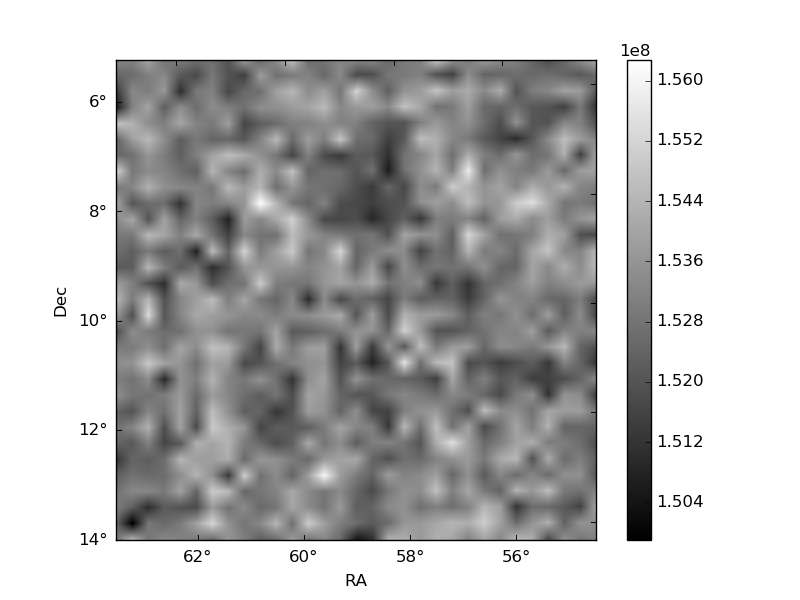
Histogram calculated using DETX and DETY for each event in the final _common_clean file
| Quadrant A | 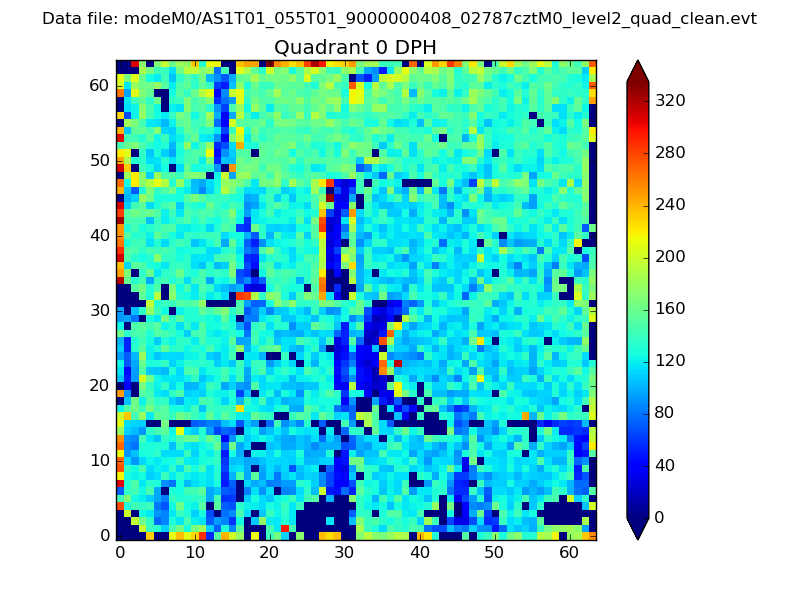 |
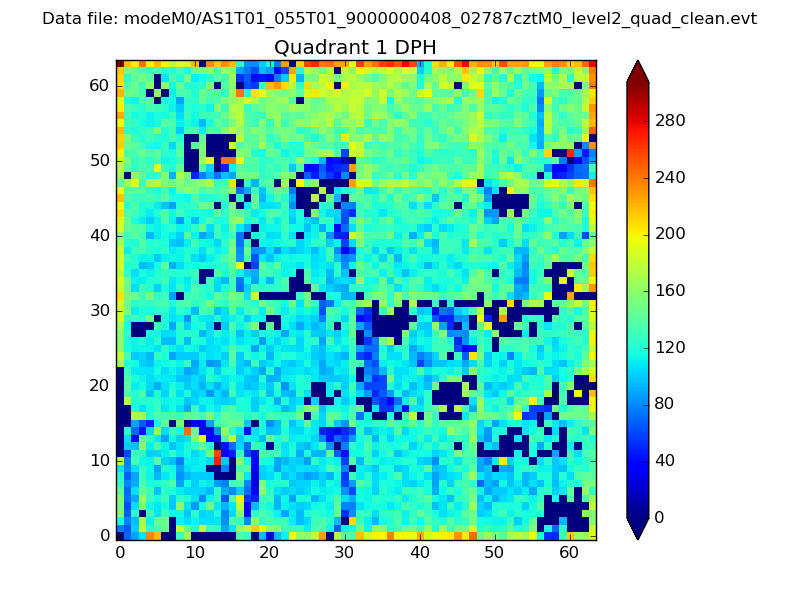 |
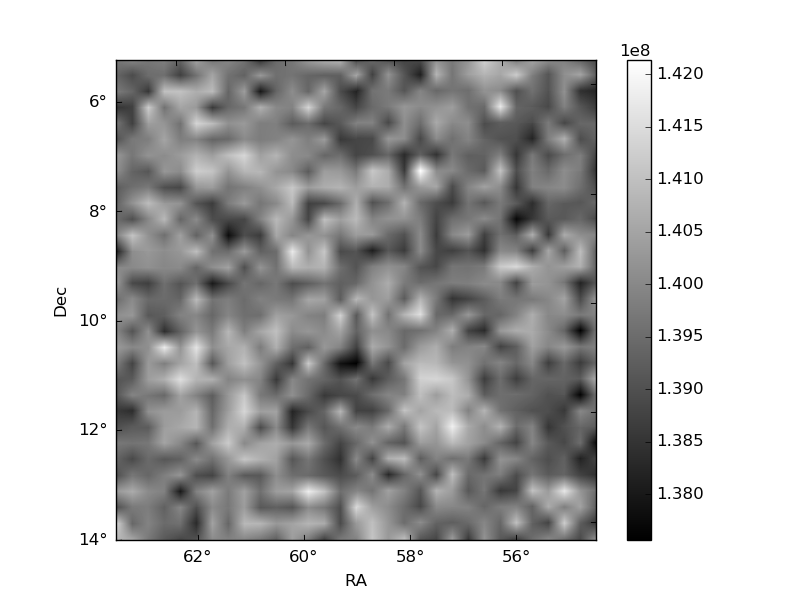
Quadrant B |
|---|---|---|---|
| Quadrant D | 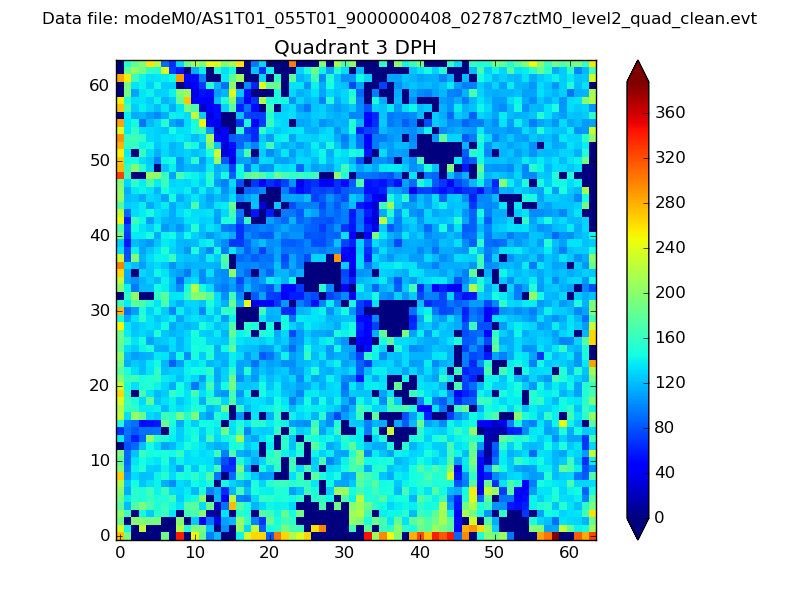 |
 |
Quadrant C |
| Plot type | Count rate plots | Images |
|---|---|---|
| Comparison with Poisson distribution Blue bars denote a histogram of data divided into 1 sec bins. Red curve is a Poisson curve with rate = median count rate of data. |
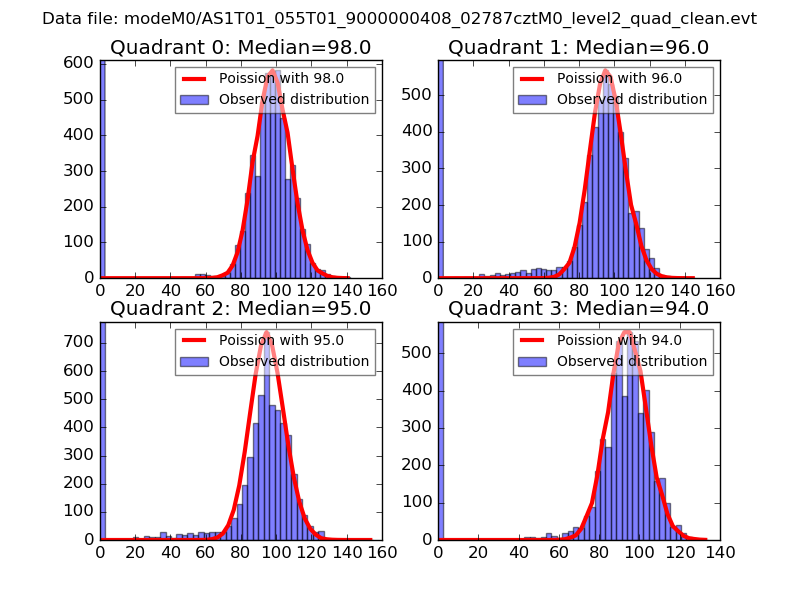 |
 |
| Quadrant-wise count rates Data is divided into 100 sec bins |
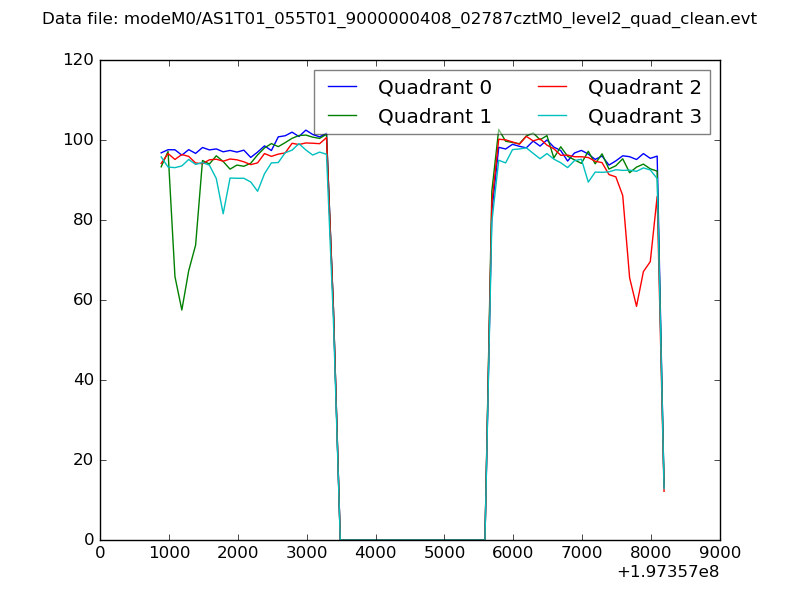 |
|
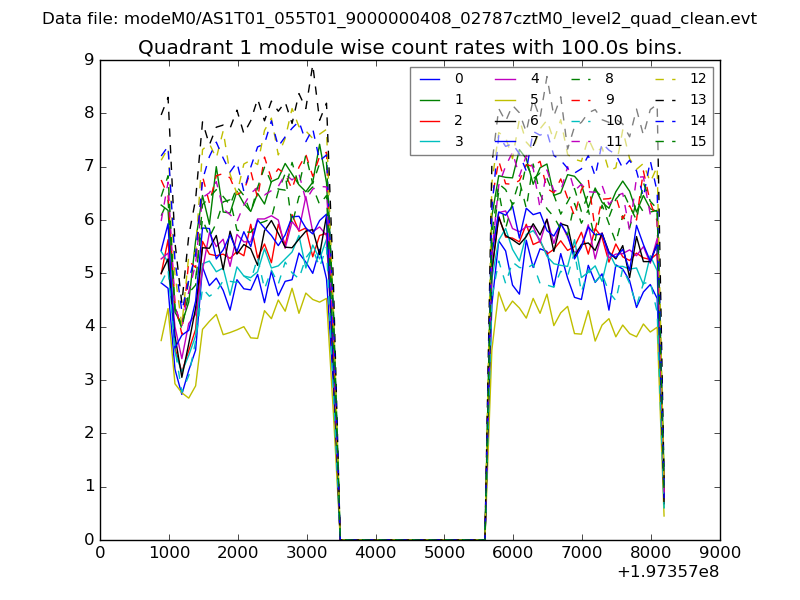
| Module-wise count rates for Quadrant A Data is divided into 100 sec bins |
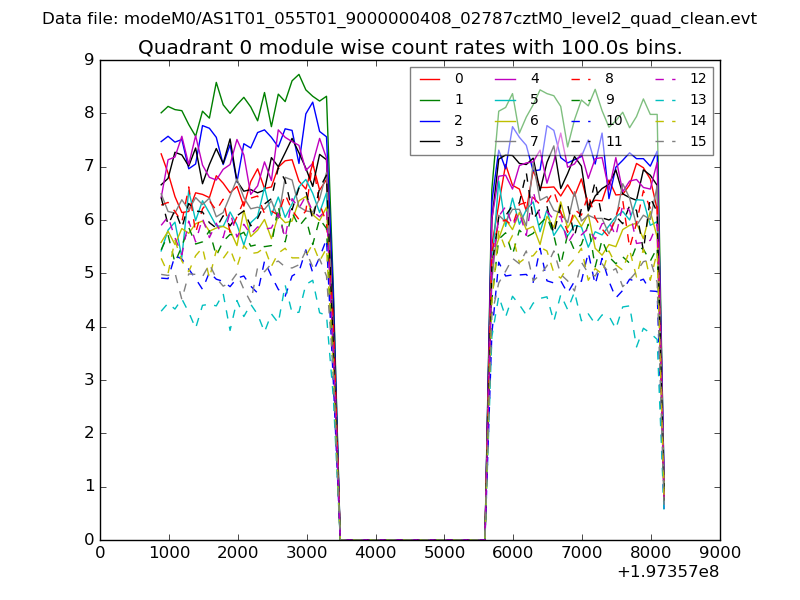 |
 |
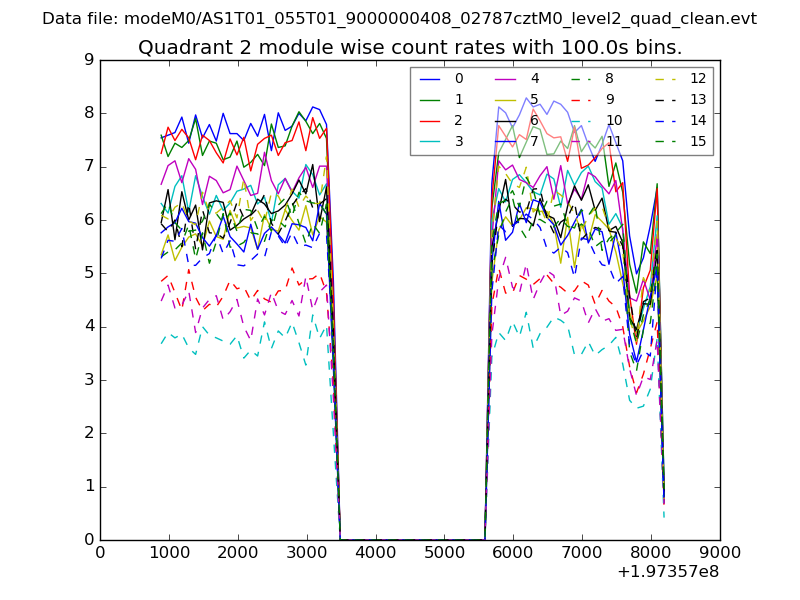
| Module-wise count rates for Quadrant B Data is divided into 100 sec bins |
 |
 |
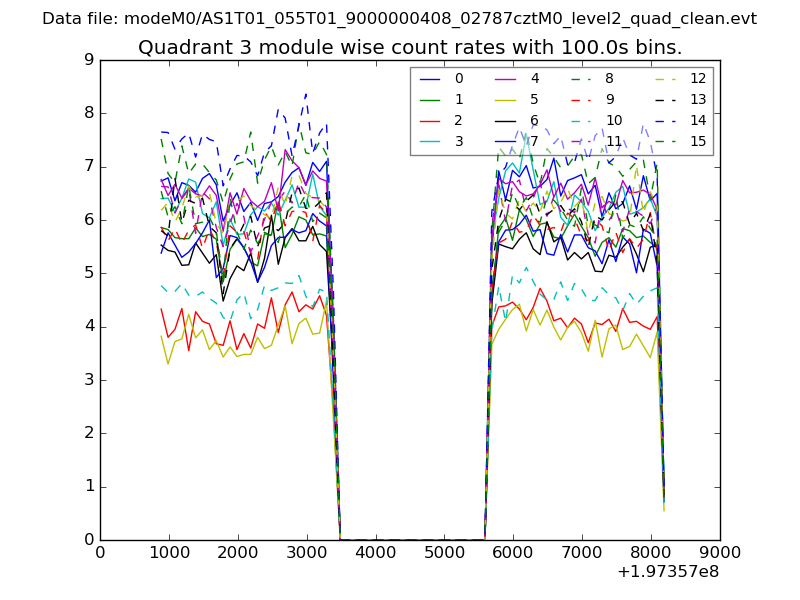
| Module-wise count rates for Quadrant C Data is divided into 100 sec bins |
 |
 |
| Module-wise count rates for Quadrant D Data is divided into 100 sec bins |
 |
 |
| Parameter | Plot |
|---|---|
| CZT HV Monitor | 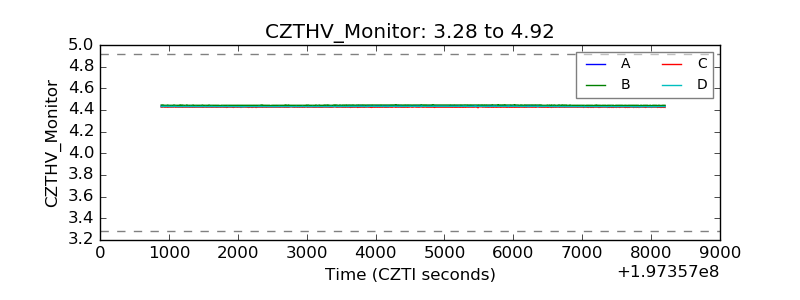 |
| D_VDD | 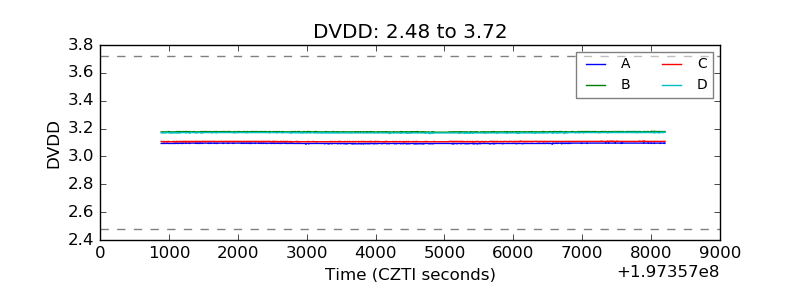 |
| Temperature 1 | 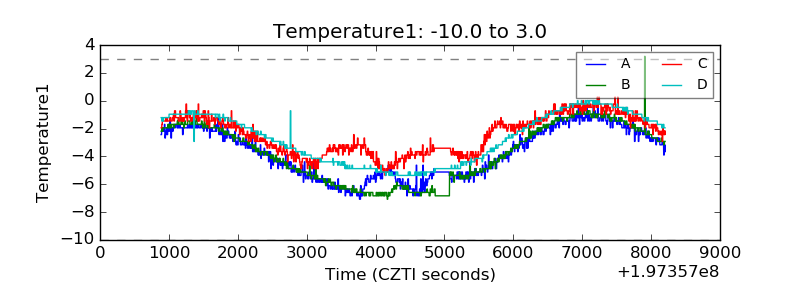 |
| Veto HV Monitor | 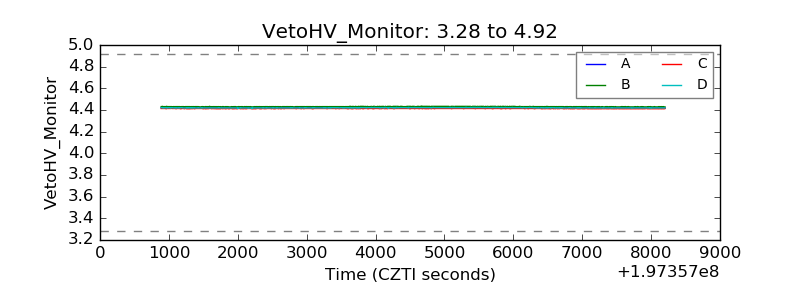 |
| Veto LLD | 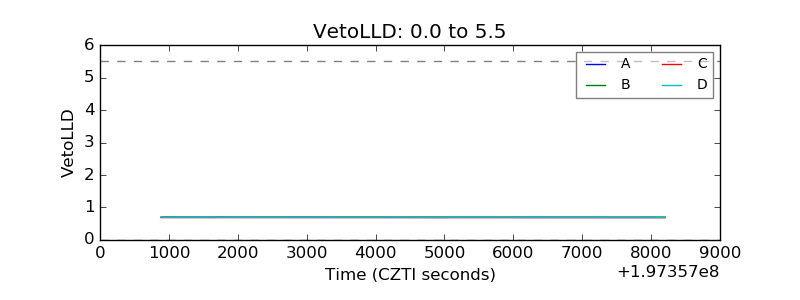 |
| Alpha Counter | 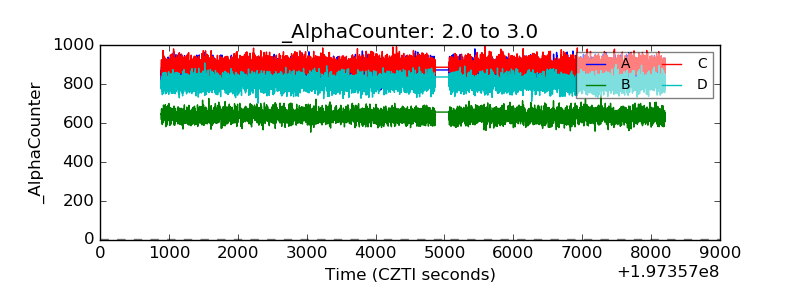 |
| _CPM_Rate | 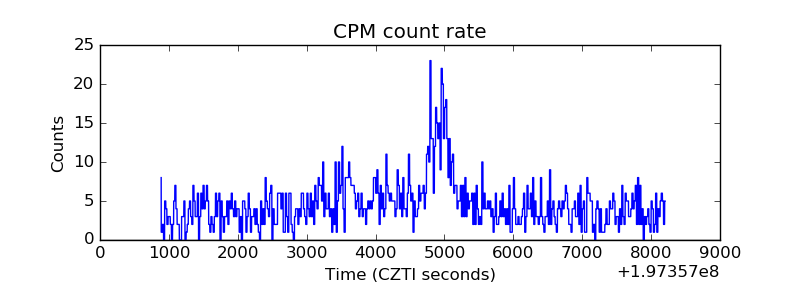 |
| CZT Counter | 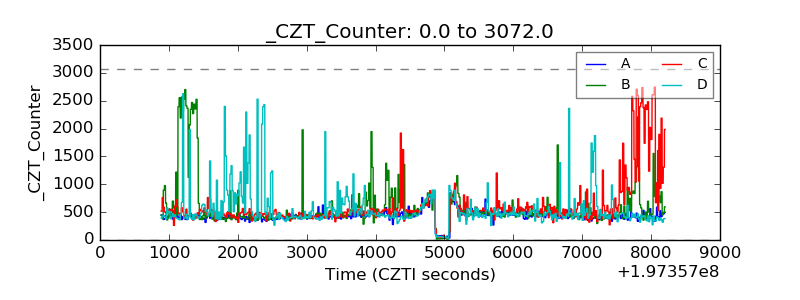 |
| +2.5 Volts monitor | 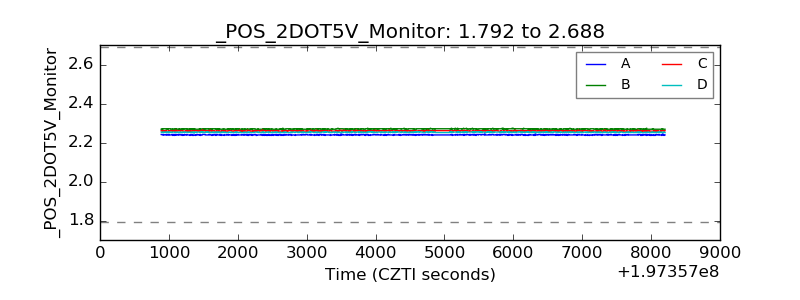 |
| +5 Volts monitor |  |
| Veto Counter | 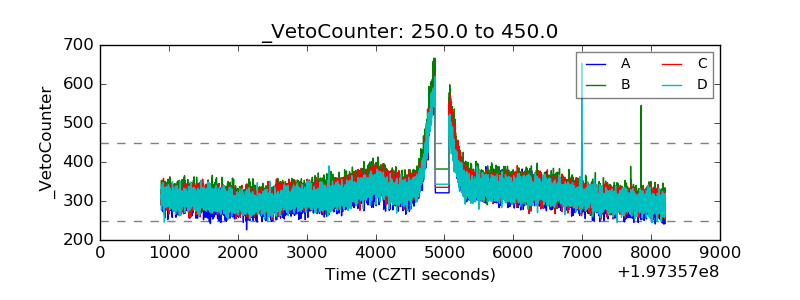 |