| Param | Original file | Final file |
|---|---|---|
| Filename | modeM0/AS1T01_055T01_9000000408_02812cztM0_level2.evt | modeM0/AS1T01_055T01_9000000408_02812cztM0_level2_quad_clean.evt |
| Size (bytes) | 157,250,880 | 16,280,640 |
| Size | 150.0 MB | 15.5 MB |
| Events in quadrant A | 1,115,679 | 76,466 |
| Events in quadrant B | 1,176,525 | 75,417 |
| Events in quadrant C | 1,120,728 | 74,943 |
| Events in quadrant D | 1,165,284 | 74,097 |
| Mode SS | |||
|---|---|---|---|
| Quadrant | BADHDUFLAG | Total packets | Discarded packets |
| A | 0 | 54 | 0 |
| B | 0 | 54 | 0 |
| C | 0 | 54 | 0 |
| D | 0 | 54 | 0 |
| Mode M0 | |||
|---|---|---|---|
| Quadrant | BADHDUFLAG | Total packets | Discarded packets |
| A | 0 | 5367 | 1 |
| B | 0 | 5420 | 2 |
| C | 0 | 5352 | 2 |
| D | 0 | 5483 | 0 |
| Quadrant | Total seconds | Saturated seconds | Saturation percentage |
|---|---|---|---|
| A | 2666 | 5 | 0.187547% |
| B | 2665 | 4 | 0.150094% |
| C | 2665 | 1 | 0.037523% |
| D | 2666 | 2 | 0.075019% |
Noise dominated data is calculated using 1-second bins in cleaned event files. If a bin has >2000 counts, and if more than 50% of those come from <1% of pixels, then it is considered to be noise-dominated and hence unusable.
| Quadrant | # 1 sec bins | Bins with >0 counts | Bins with >2000 counts | High rate bins dominated by noise | Noise dominated (total time) | Noise dominated (detector-on time) | Marked lightcurve |
|---|---|---|---|---|---|---|---|
| A | 2666 | 2666 | 4 | 4 | 0.15% | 0.15% | 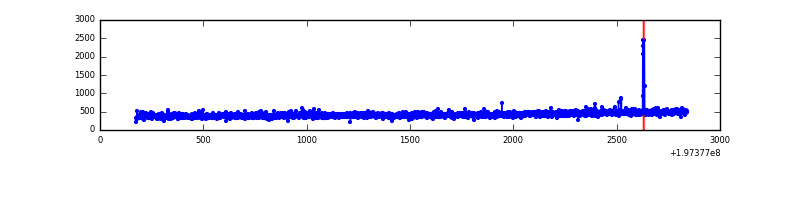 |
| B | 2665 | 2665 | 1 | 1 | 0.04% | 0.04% | 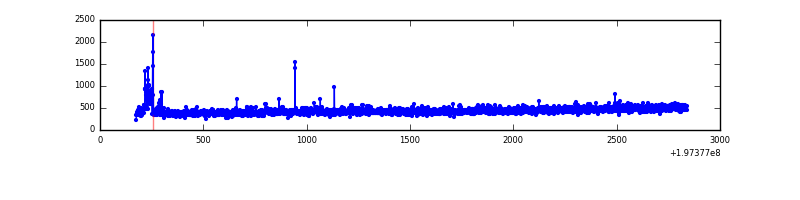 |
| C | 2665 | 2665 | 0 | 0 | 0.00% | 0.00% | 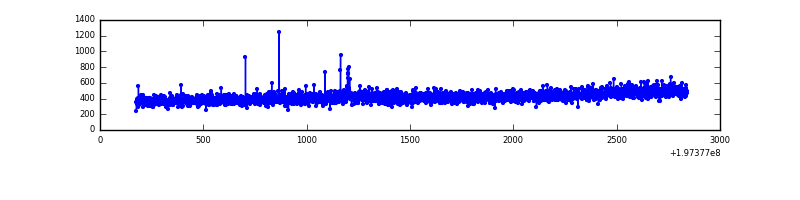 |
| D | 2666 | 2666 | 1 | 1 | 0.04% | 0.04% | 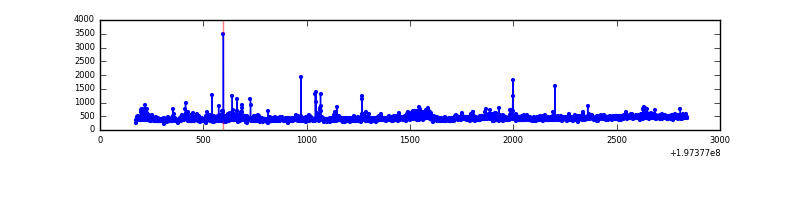 |
Top three noisy pixels from each quadrant. If the there are fewer than three noisy pixels in the level2.evt file, extra rows are filled as -1
| Pixel properties | Quadrant properties | ||||||
|---|---|---|---|---|---|---|---|
| Quadrant | DetID | PixID | Counts | Sigma | Mean | Median | Sigma |
| A | 0 | 128 | 12090 | 194.52 | 285 | 279 | 60.7 |
| A | 0 | 149 | 3091 | 46.31 | 285 | 279 | 60.7 |
| A | 0 | 226 | 3061 | 45.82 | 285 | 279 | 60.7 |
| B | 0 | 168 | 20213 | 340.28 | 294 | 287 | 58.6 |
| B | 0 | 182 | 10908 | 181.38 | 294 | 287 | 58.6 |
| B | 0 | 189 | 7074 | 115.9 | 294 | 287 | 58.6 |
| C | 1 | 3 | 7616 | 106.6 | 283 | 285 | 68.8 |
| C | 3 | 14 | 2449 | 31.47 | 283 | 285 | 68.8 |
| C | 3 | 202 | 2398 | 30.73 | 283 | 285 | 68.8 |
| D | 0 | 226 | 35364 | 515.24 | 275 | 268 | 68.1 |
| D | 1 | 4 | 22495 | 326.31 | 275 | 268 | 68.1 |
| D | 1 | 66 | 21926 | 317.96 | 275 | 268 | 68.1 |
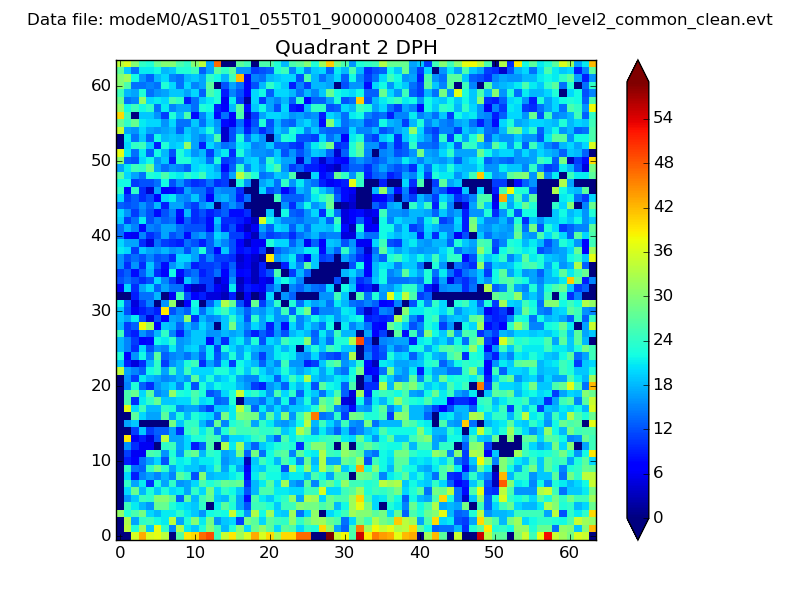
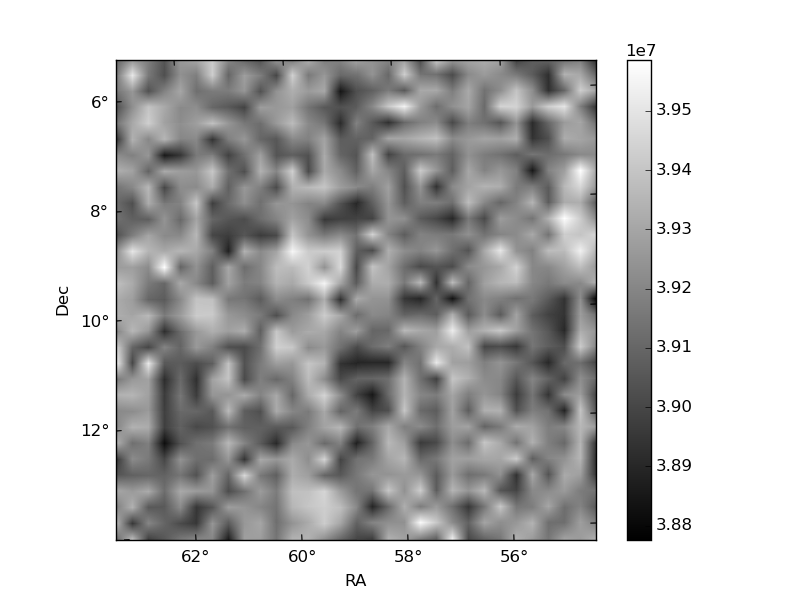
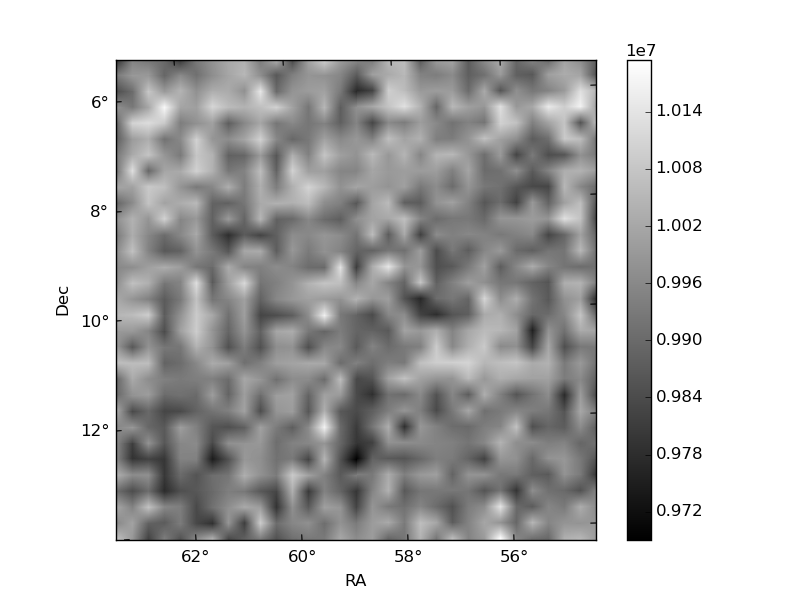
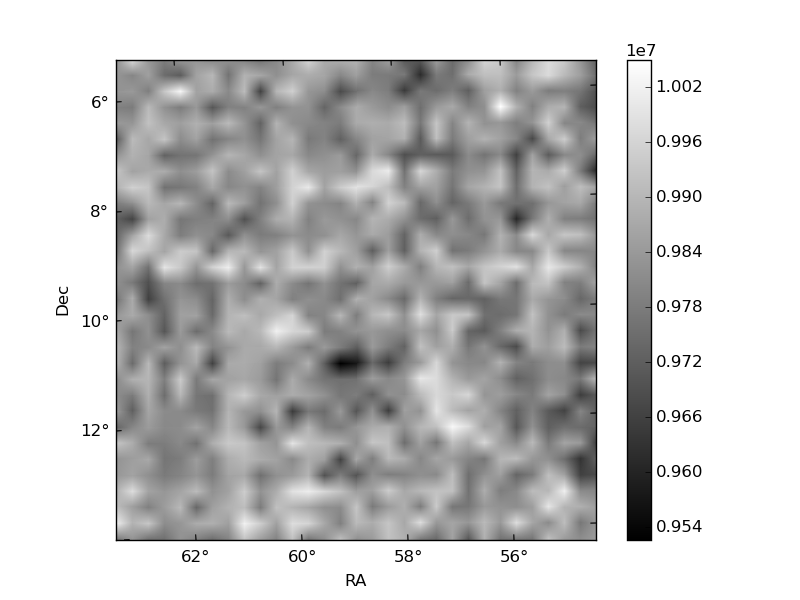
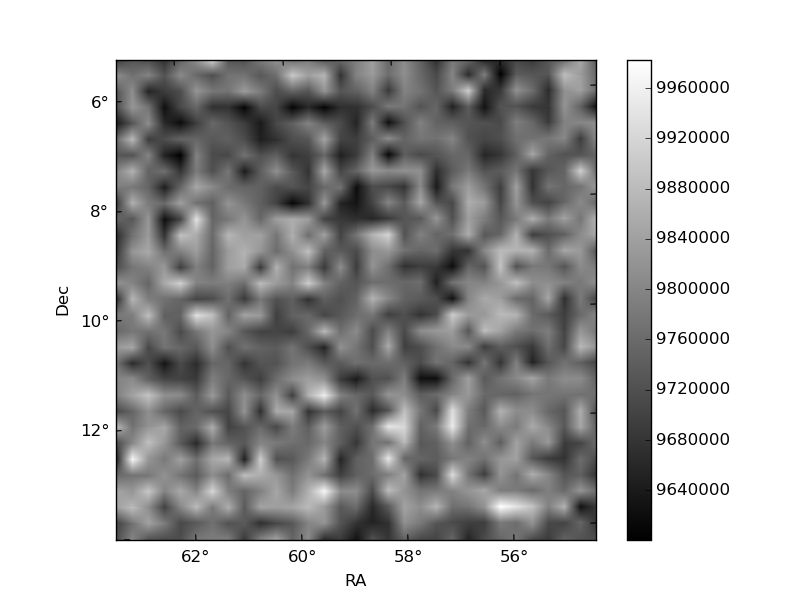
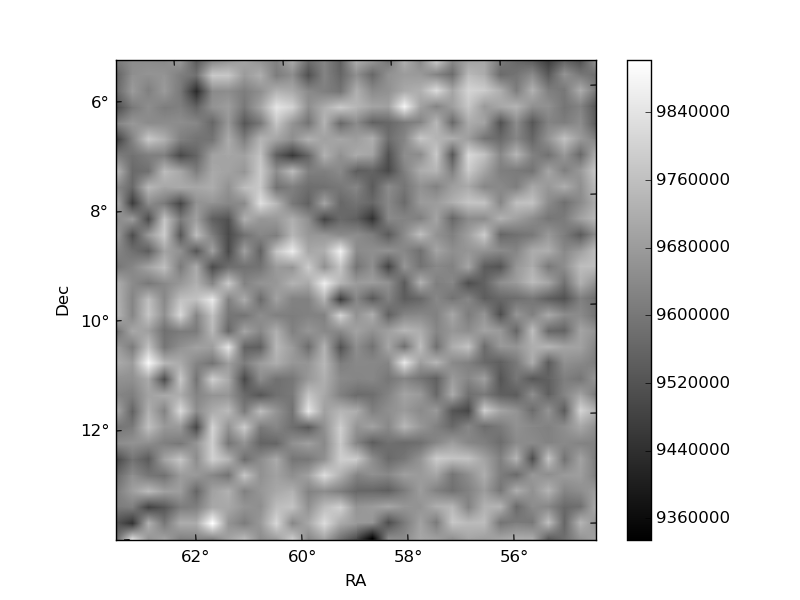
Histogram calculated using DETX and DETY for each event in the final _common_clean file
| Quadrant A | 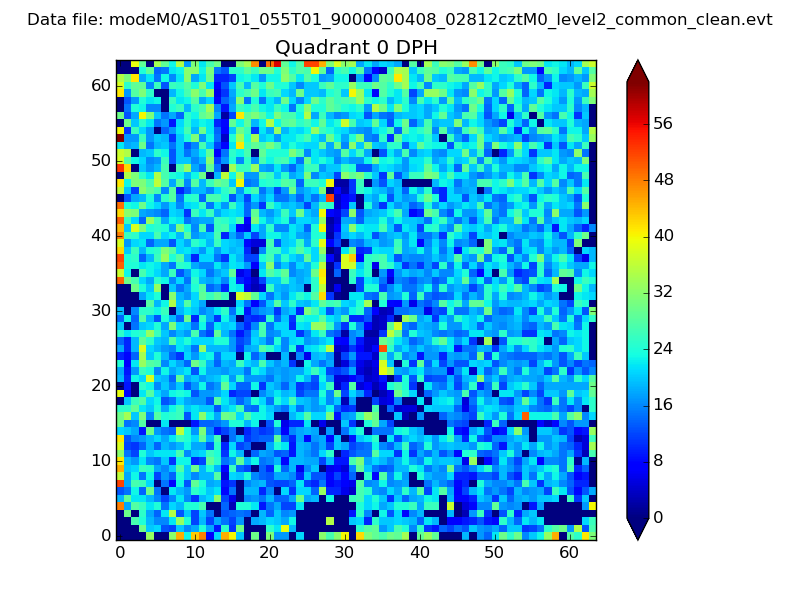 |
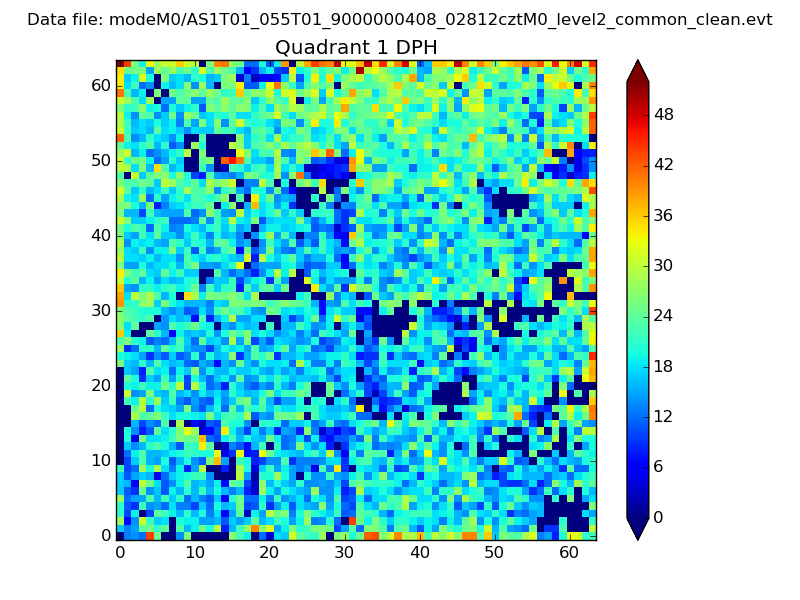 |
Quadrant B |
|---|---|---|---|
| Quadrant D | 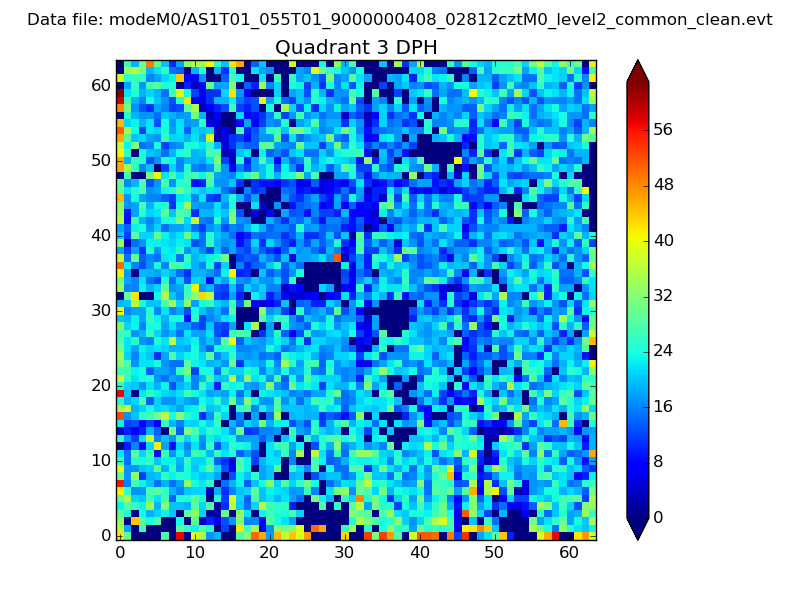 |
 |
Quadrant C |
| Plot type | Count rate plots | Images |
|---|---|---|
| Comparison with Poisson distribution Blue bars denote a histogram of data divided into 1 sec bins. Red curve is a Poisson curve with rate = median count rate of data. |
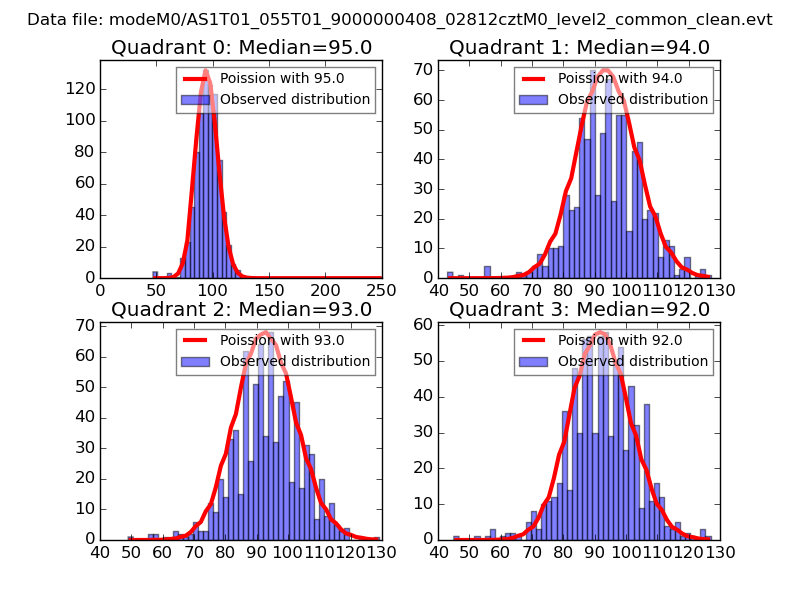 |
 |
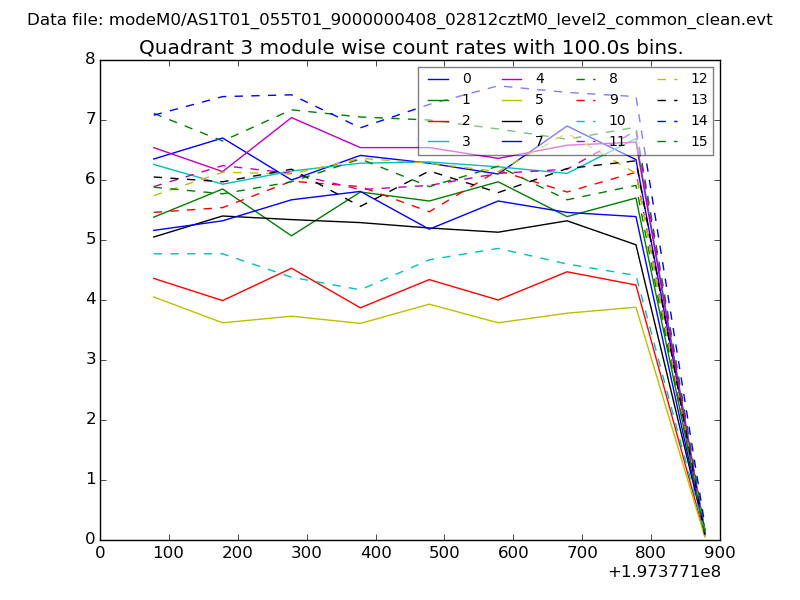
| Quadrant-wise count rates Data is divided into 100 sec bins |
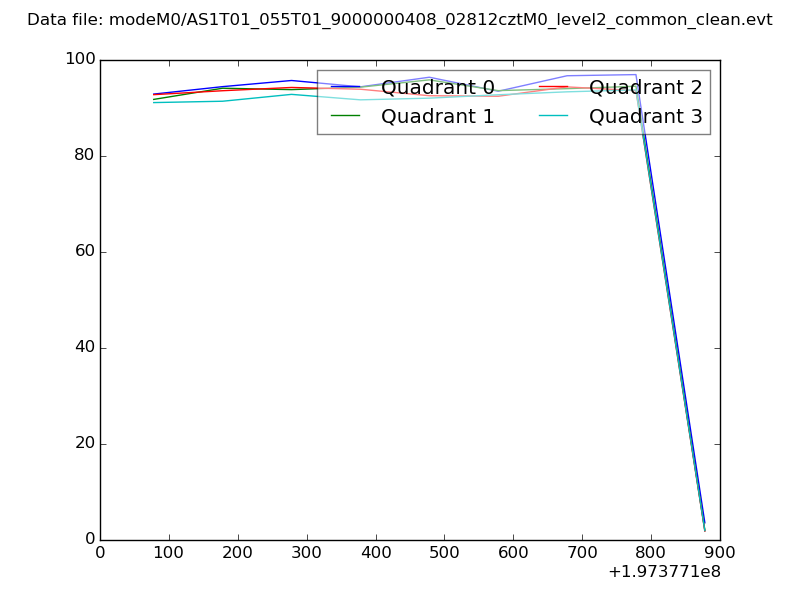 |
|
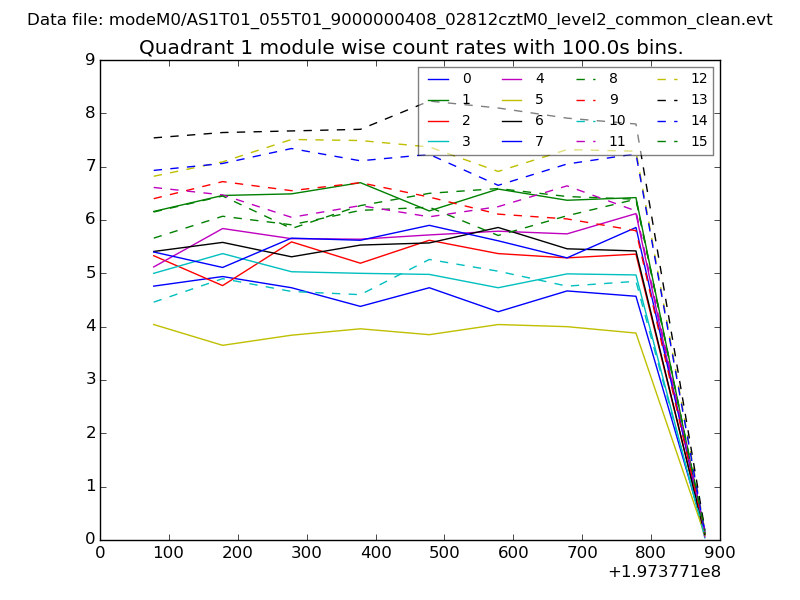
| Module-wise count rates for Quadrant A Data is divided into 100 sec bins |
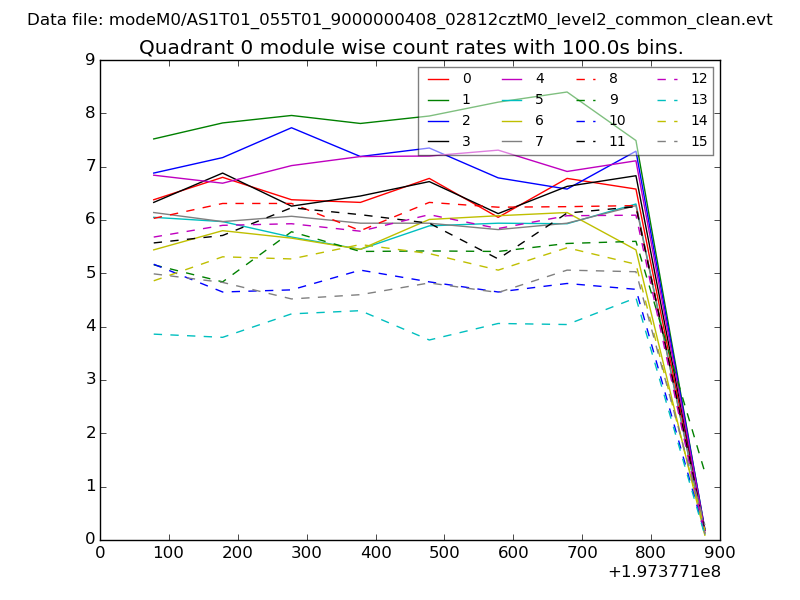 |
 |
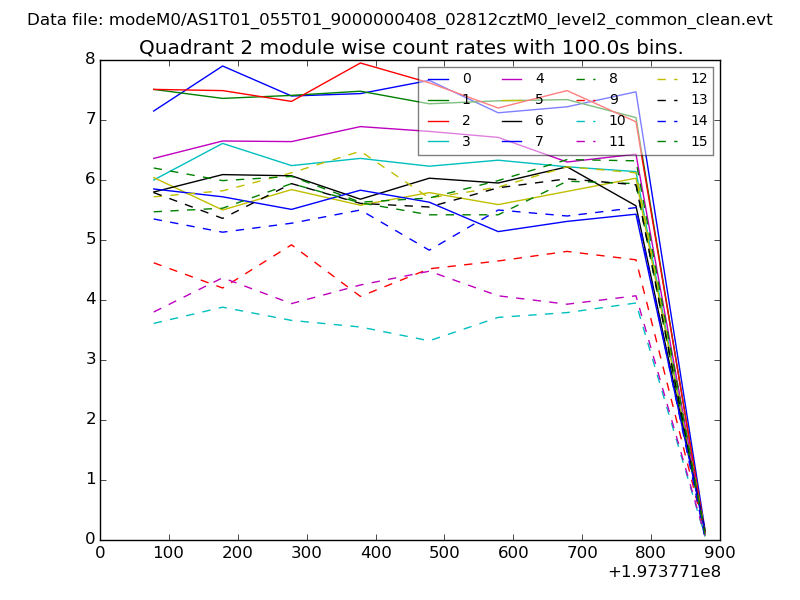
| Module-wise count rates for Quadrant B Data is divided into 100 sec bins |
 |
 |
| Module-wise count rates for Quadrant C Data is divided into 100 sec bins |
 |
 |
| Module-wise count rates for Quadrant D Data is divided into 100 sec bins |
 |
 |
| Parameter | Plot |
|---|---|
| CZT HV Monitor | 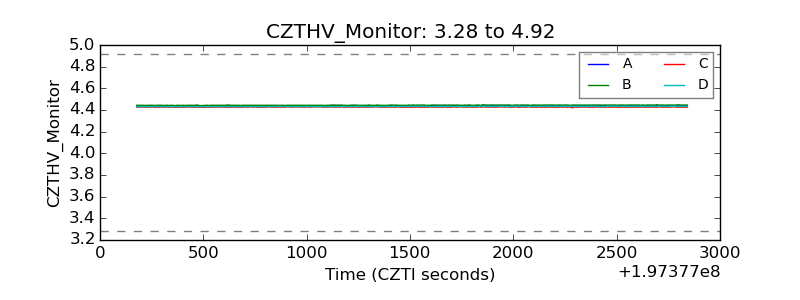 |
| D_VDD | 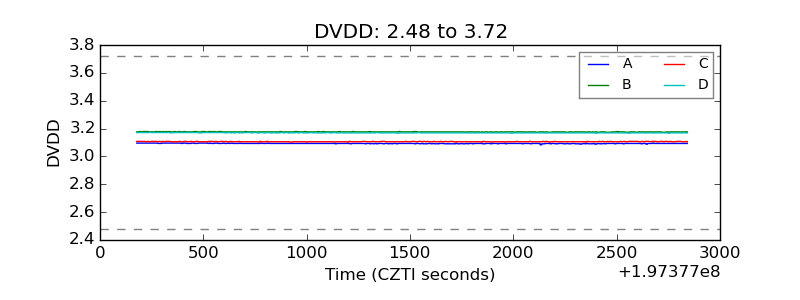 |
| Temperature 1 | 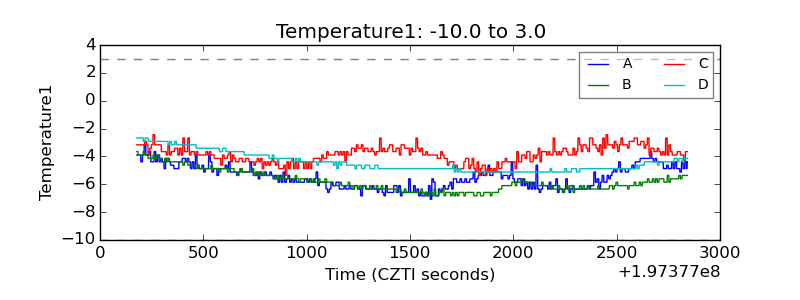 |
| Veto HV Monitor | 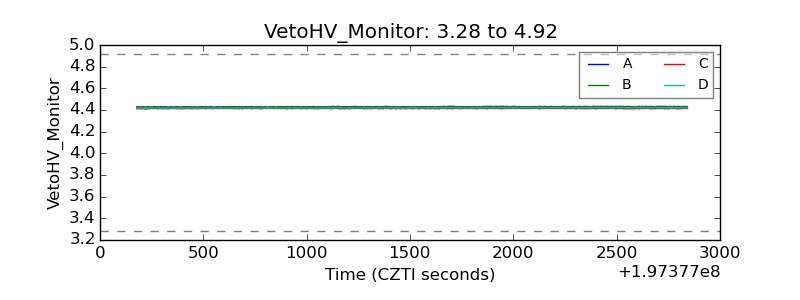 |
| Veto LLD | 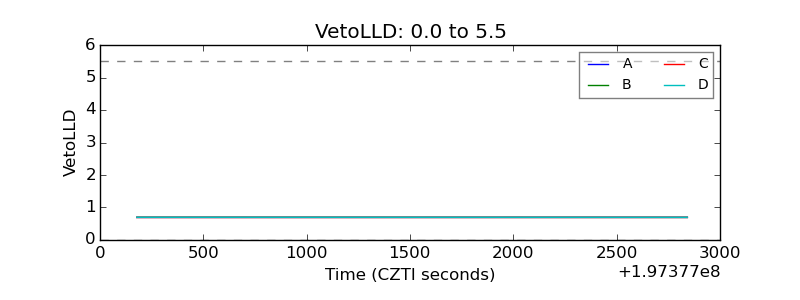 |
| Alpha Counter | 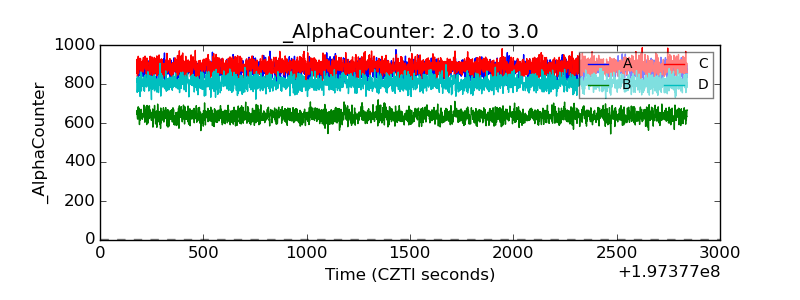 |
| _CPM_Rate | 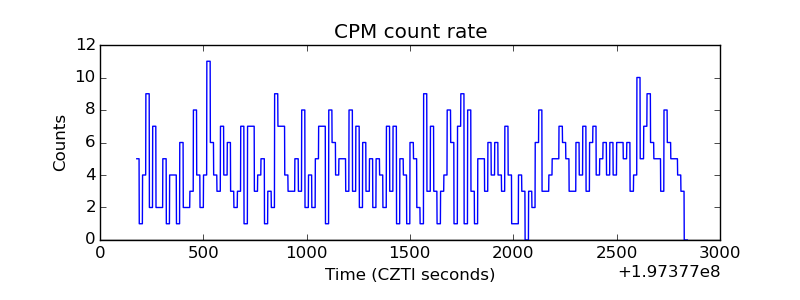 |
| CZT Counter | 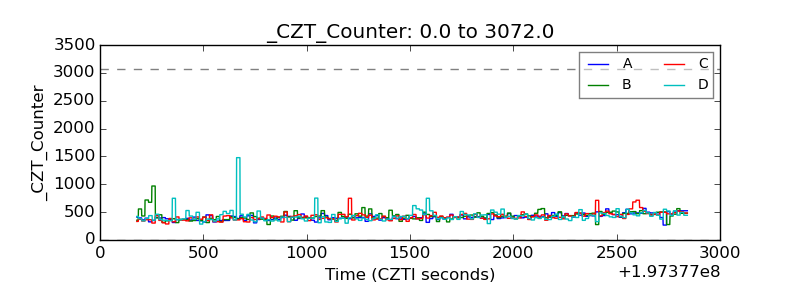 |
| +2.5 Volts monitor | 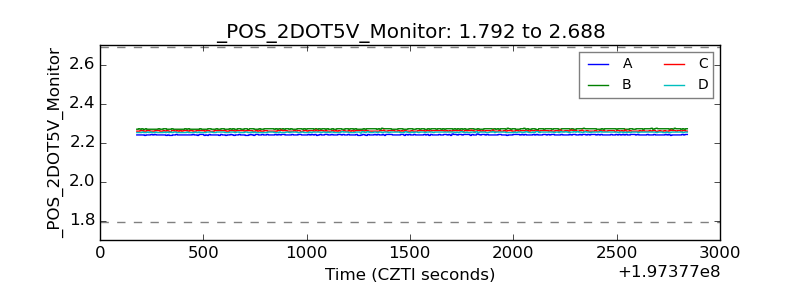 |
| +5 Volts monitor |  |
| Veto Counter | 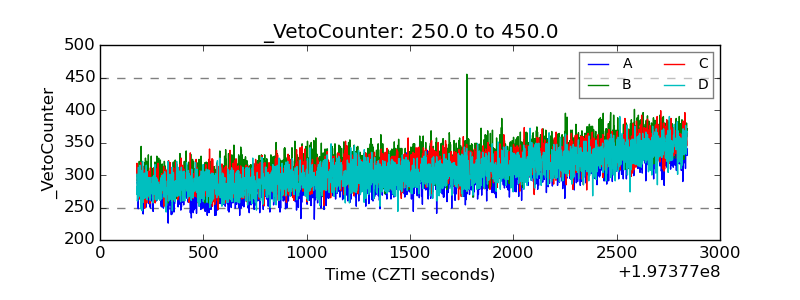 |