| Param | Original file | Final file |
|---|---|---|
| Filename | modeM0/AS1P01_999T99_9000000414_02936cztM0_level2.evt | modeM0/AS1P01_999T99_9000000414_02936cztM0_level2_quad_clean.evt |
| Size (bytes) | 1,159,655,040 | 58,464,000 |
| Size | 1.1 GB | 55.8 MB |
| Events in quadrant A | 6,881,116 | 379,685 |
| Events in quadrant B | 8,892,029 | 378,026 |
| Events in quadrant C | 7,195,233 | 369,468 |
| Events in quadrant D | 11,832,190 | 300,399 |
| Mode M0 | |||
|---|---|---|---|
| Quadrant | BADHDUFLAG | Total packets | Discarded packets |
| A | 0 | 23904 | 3 |
| B | 0 | 29948 | 2 |
| C | 0 | 24838 | 2 |
| D | 0 | 38806 | 2 |
| Mode M9 | |||
|---|---|---|---|
| Quadrant | BADHDUFLAG | Total packets | Discarded packets |
| A | 0 | 13 | 0 |
| B | 0 | 13 | 0 |
| C | 0 | 12 | 0 |
| D | 0 | 12 | 0 |
| Mode SS | |||
|---|---|---|---|
| Quadrant | BADHDUFLAG | Total packets | Discarded packets |
| A | 0 | 102 | 0 |
| B | 0 | 100 | 0 |
| C | 0 | 100 | 0 |
| D | 0 | 100 | 0 |
| Quadrant | Total seconds | Saturated seconds | Saturation percentage |
|---|---|---|---|
| A | 4896 | 88 | 1.797386% |
| B | 4879 | 700 | 14.347202% |
| C | 4859 | 141 | 2.901832% |
| D | 4843 | 1788 | 36.919265% |
Noise dominated data is calculated using 1-second bins in cleaned event files. If a bin has >2000 counts, and if more than 50% of those come from <1% of pixels, then it is considered to be noise-dominated and hence unusable.
| Quadrant | # 1 sec bins | Bins with >0 counts | Bins with >2000 counts | High rate bins dominated by noise | Noise dominated (total time) | Noise dominated (detector-on time) | Marked lightcurve |
|---|---|---|---|---|---|---|---|
| A | 6031 | 4896 | 382 | 382 | 6.33% | 7.80% | 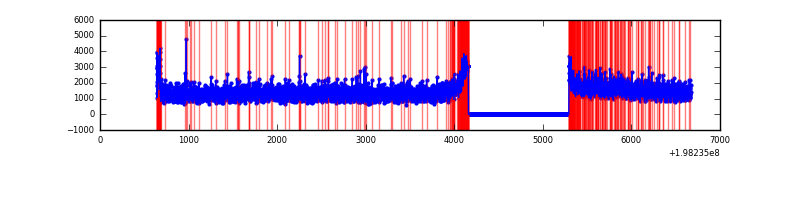 |
| B | 6014 | 4879 | 1569 | 1569 | 26.09% | 32.16% | 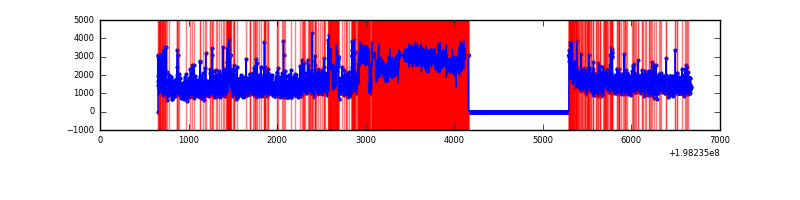 |
| C | 5994 | 4859 | 609 | 609 | 10.16% | 12.53% | 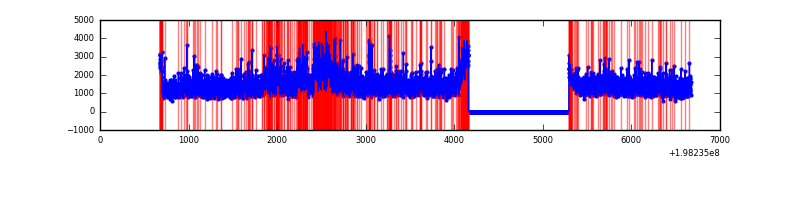 |
| D | 5978 | 4843 | 3145 | 3145 | 52.61% | 64.94% | 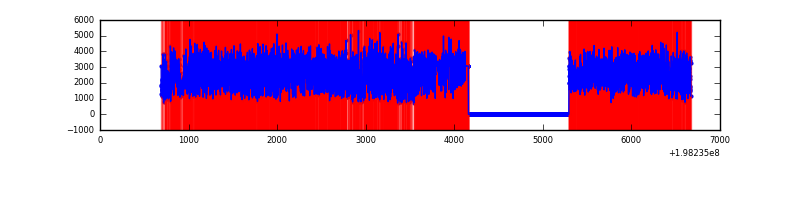 |
Top three noisy pixels from each quadrant. If the there are fewer than three noisy pixels in the level2.evt file, extra rows are filled as -1
| Pixel properties | Quadrant properties | ||||||
|---|---|---|---|---|---|---|---|
| Quadrant | DetID | PixID | Counts | Sigma | Mean | Median | Sigma |
| A | 0 | 143 | 81074 | 197.31 | 1743 | 1731 | 402.1 |
| A | 0 | 31 | 41421 | 98.7 | 1743 | 1731 | 402.1 |
| A | 0 | 149 | 28617 | 66.86 | 1743 | 1731 | 402.1 |
| B | 6 | 203 | 1876098 | 4542.59 | 1676 | 1677 | 412.6 |
| B | 3 | 27 | 126782 | 303.19 | 1676 | 1677 | 412.6 |
| B | 10 | 244 | 82189 | 195.12 | 1676 | 1677 | 412.6 |
| C | 7 | 220 | 244870 | 515.16 | 1606 | 1660 | 472.1 |
| C | 12 | 206 | 242420 | 509.97 | 1606 | 1660 | 472.1 |
| C | 6 | 80 | 140001 | 293.03 | 1606 | 1660 | 472.1 |
| D | 14 | 81 | 1839809 | 4076.77 | 1382 | 1413 | 450.9 |
| D | 14 | 97 | 1084236 | 2401.23 | 1382 | 1413 | 450.9 |
| D | 15 | 50 | 962898 | 2132.16 | 1382 | 1413 | 450.9 |
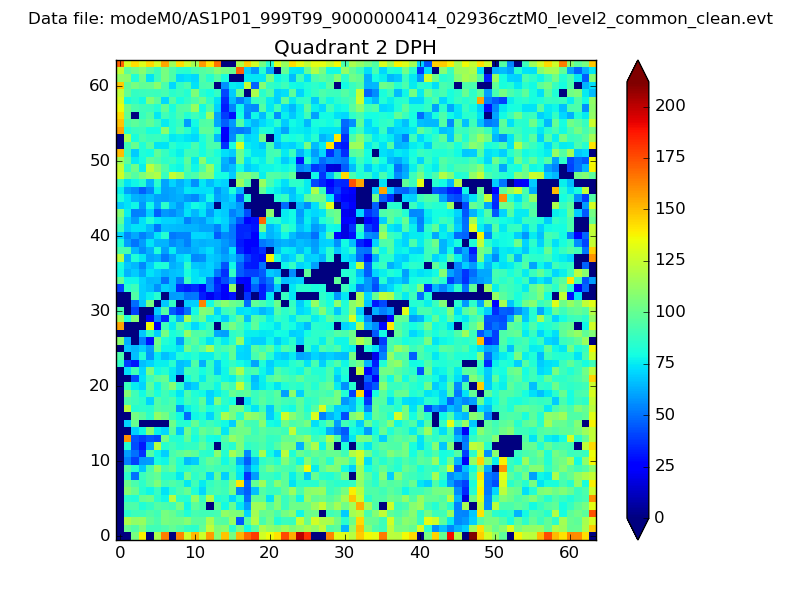
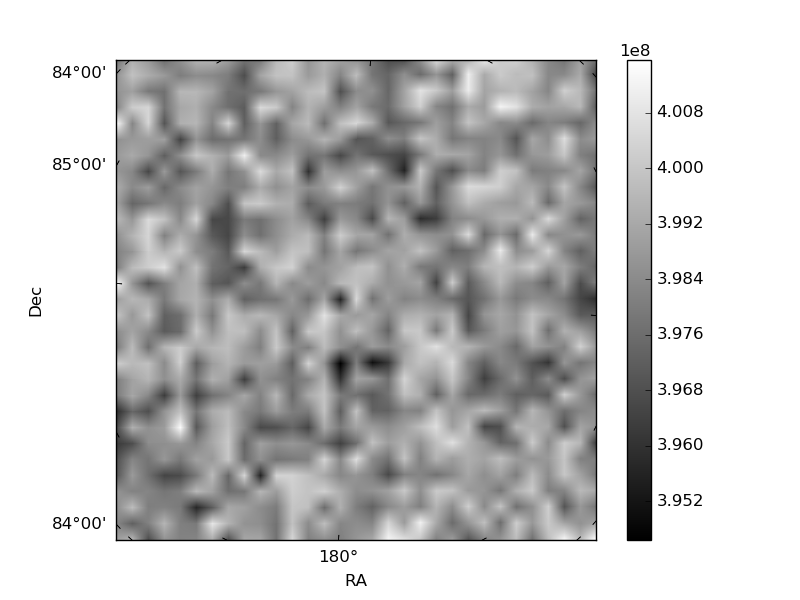
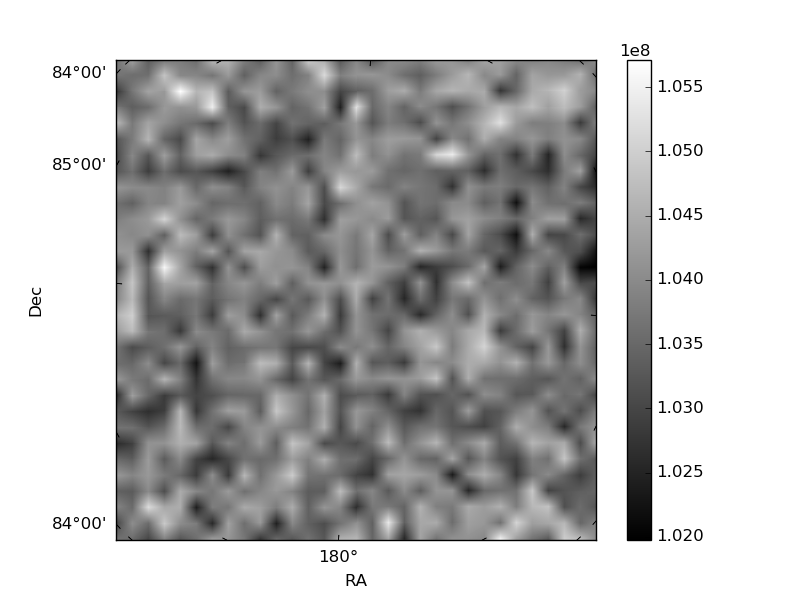
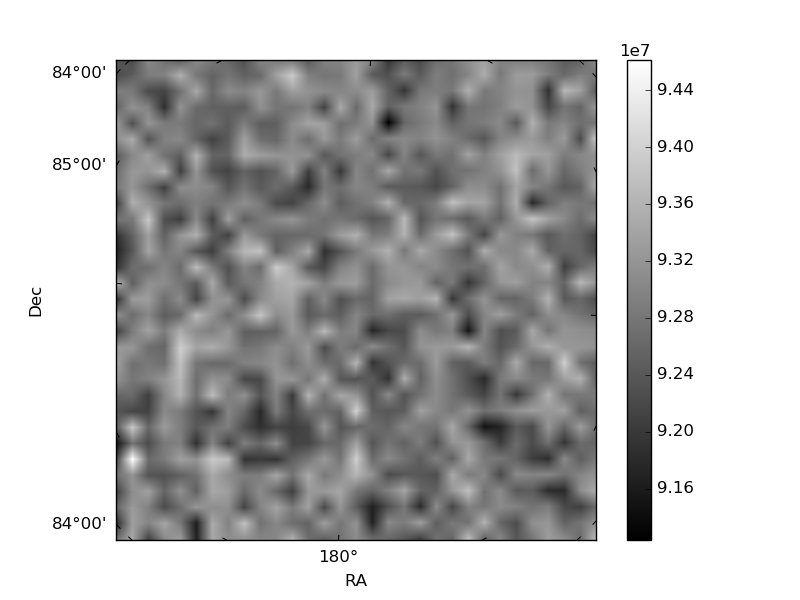
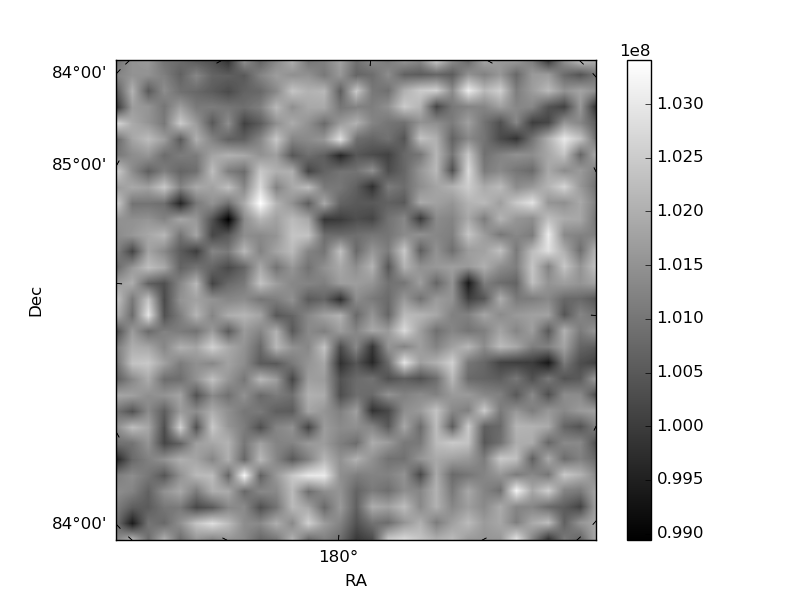
Histogram calculated using DETX and DETY for each event in the final _common_clean file
| Quadrant A | 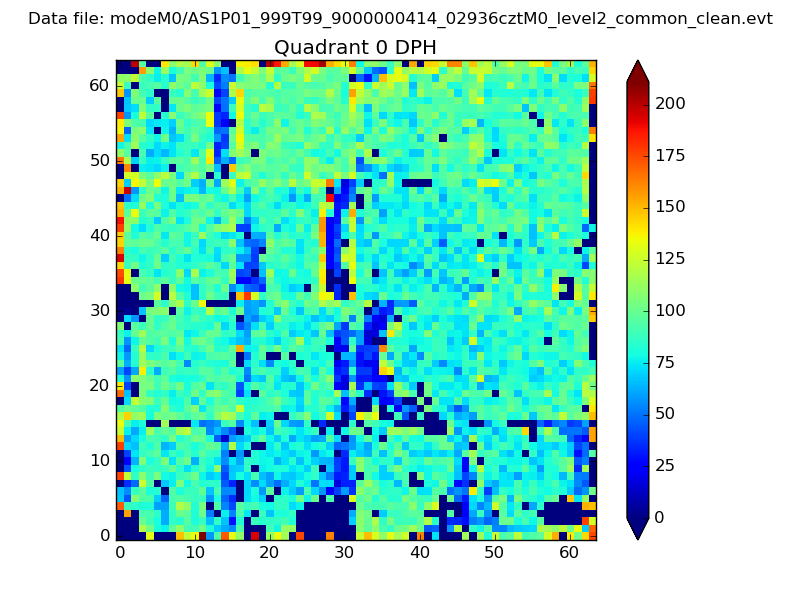 |
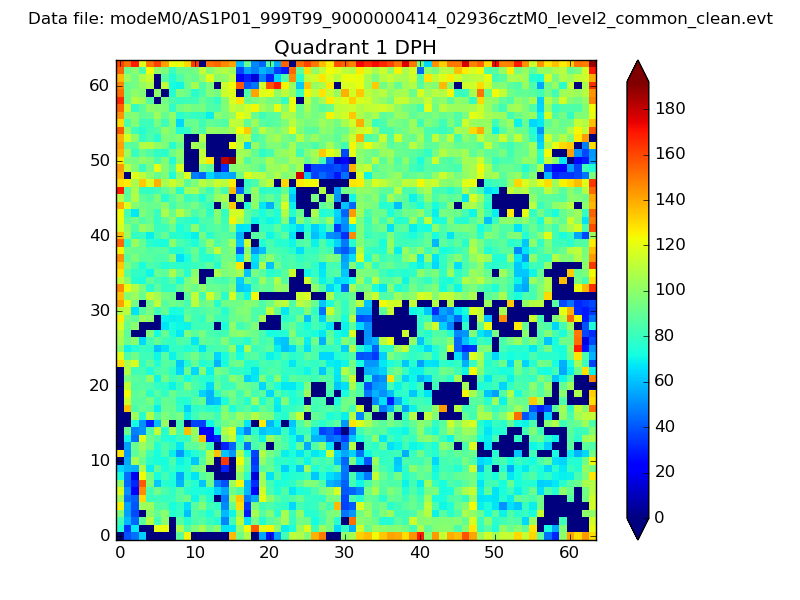 |
Quadrant B |
|---|---|---|---|
| Quadrant D | 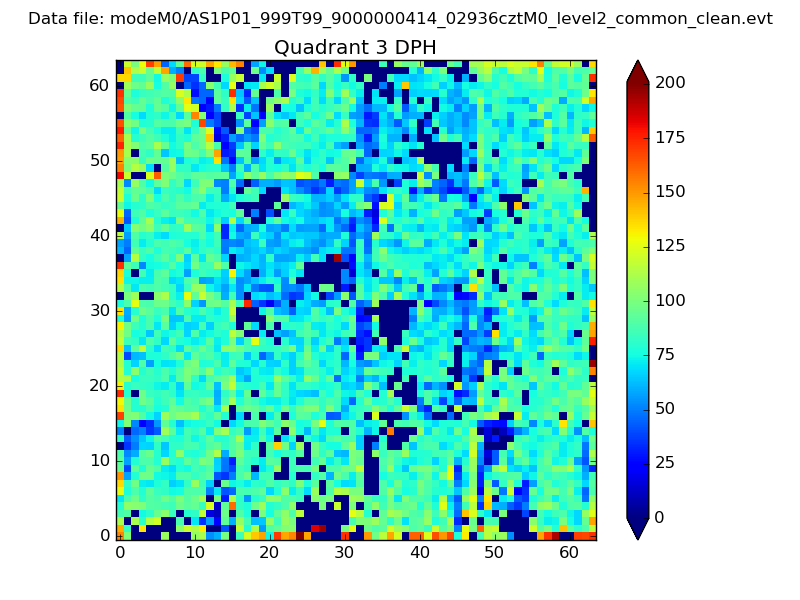 |
 |
Quadrant C |
| Plot type | Count rate plots | Images |
|---|---|---|
| Comparison with Poisson distribution Blue bars denote a histogram of data divided into 1 sec bins. Red curve is a Poisson curve with rate = median count rate of data. |
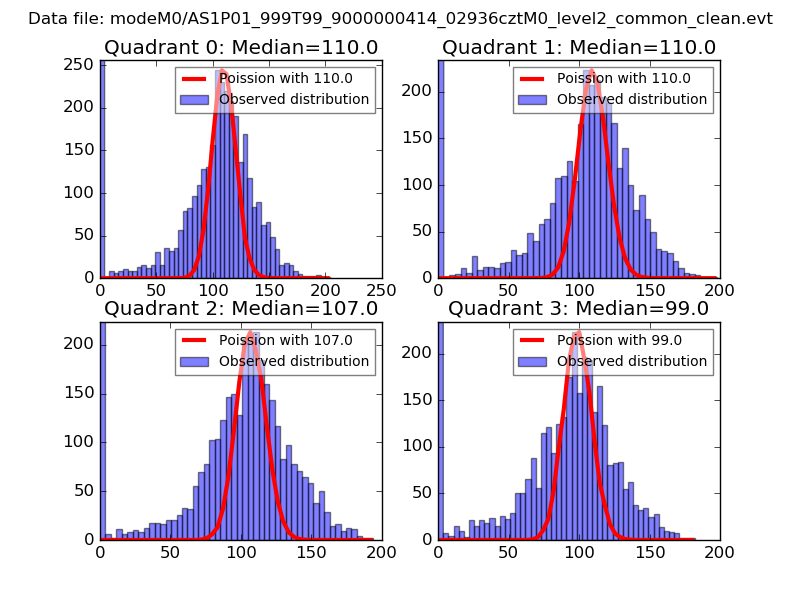 |
 |
| Quadrant-wise count rates Data is divided into 100 sec bins |
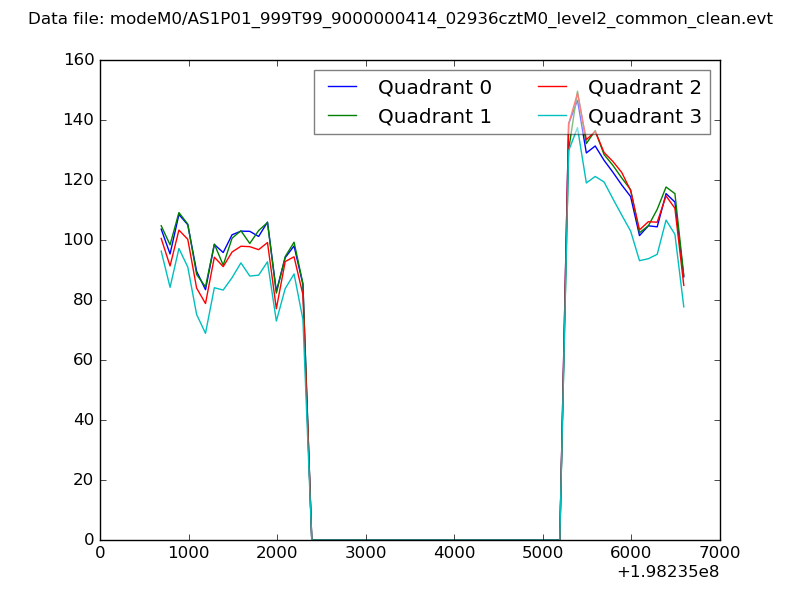 |
|
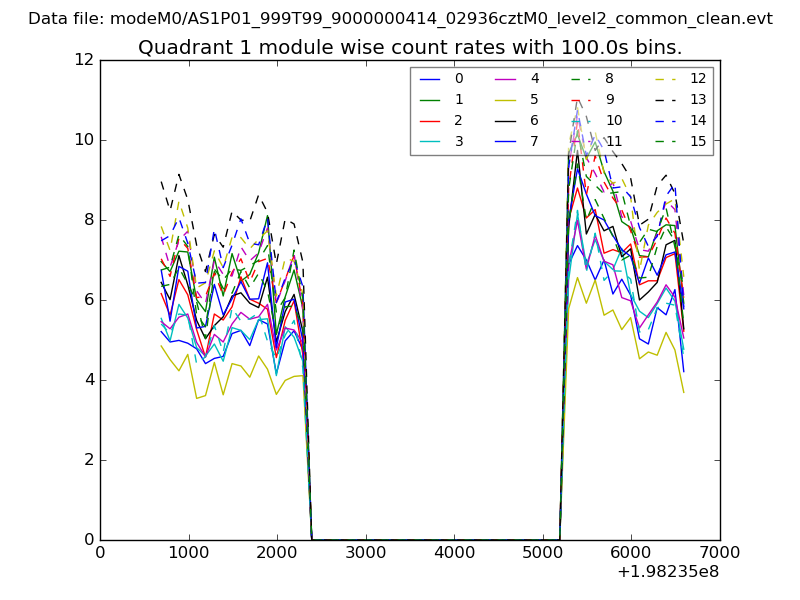
| Module-wise count rates for Quadrant A Data is divided into 100 sec bins |
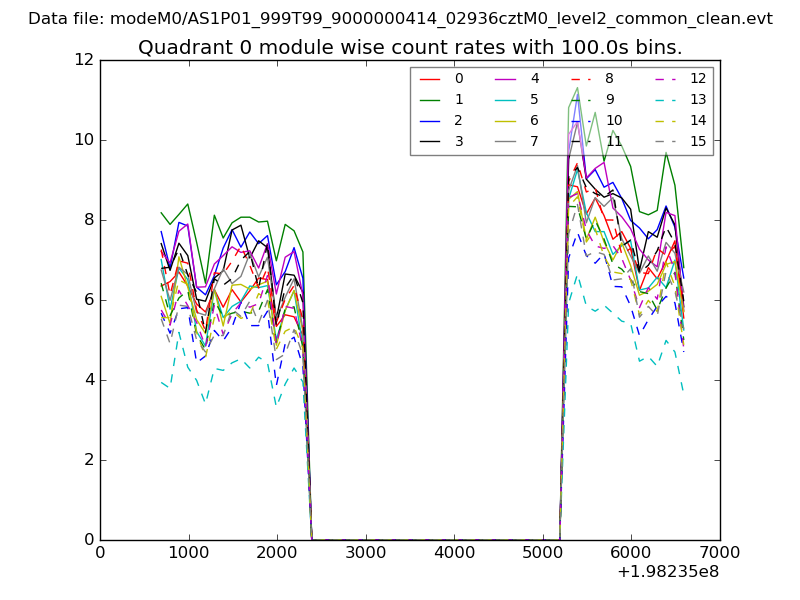 |
 |
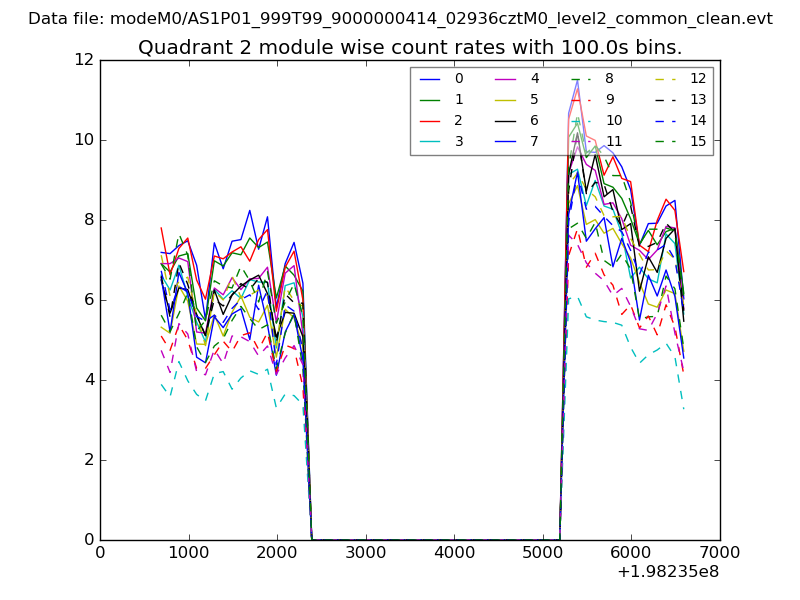
| Module-wise count rates for Quadrant B Data is divided into 100 sec bins |
 |
 |
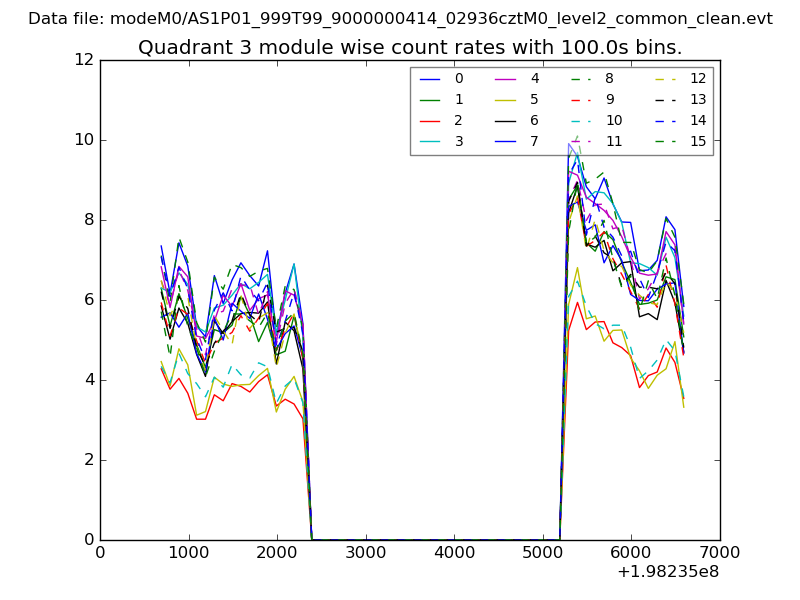
| Module-wise count rates for Quadrant C Data is divided into 100 sec bins |
 |
 |
| Module-wise count rates for Quadrant D Data is divided into 100 sec bins |
 |
 |
| Parameter | Plot |
|---|---|
| CZT HV Monitor | 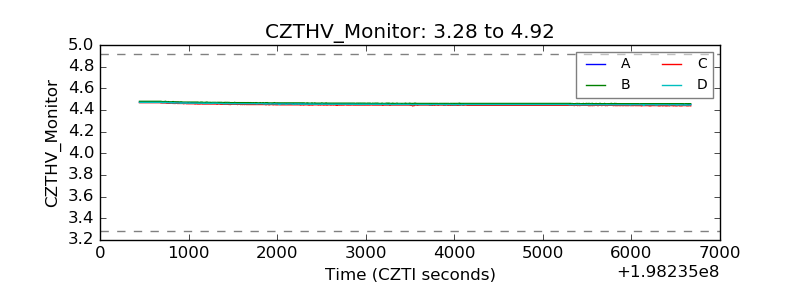 |
| D_VDD |  |
| Temperature 1 |  |
| Veto HV Monitor | 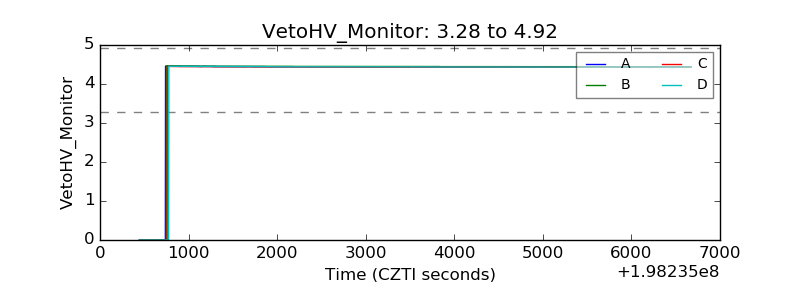 |
| Veto LLD | 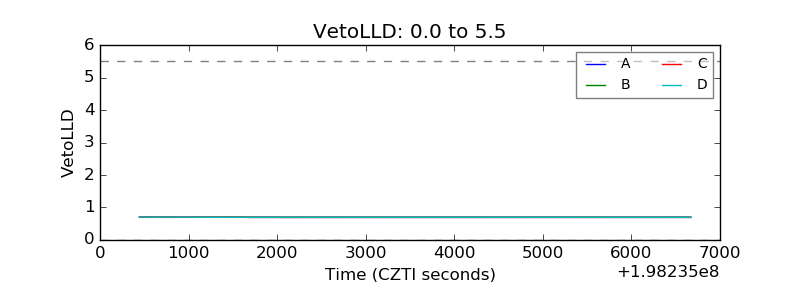 |
| Alpha Counter | 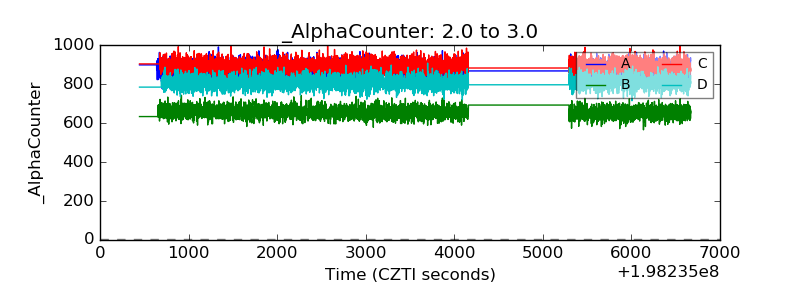 |
| _CPM_Rate | 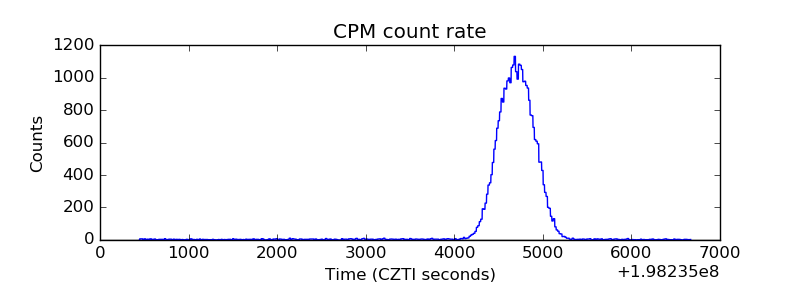 |
| CZT Counter | 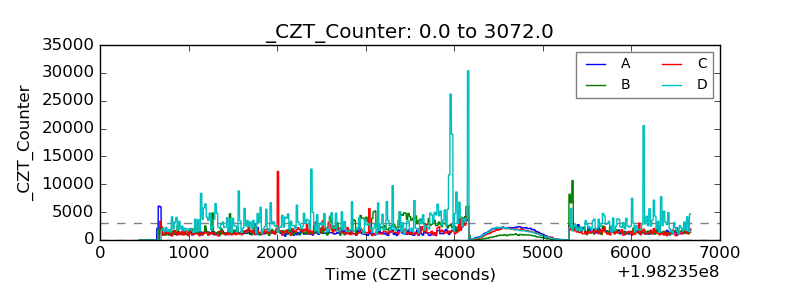 |
| +2.5 Volts monitor |  |
| +5 Volts monitor | 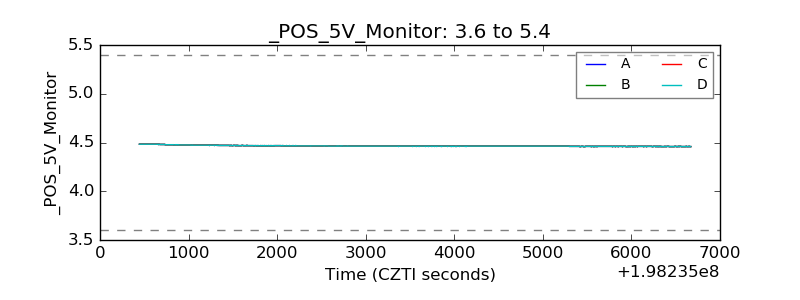 |
| Veto Counter | 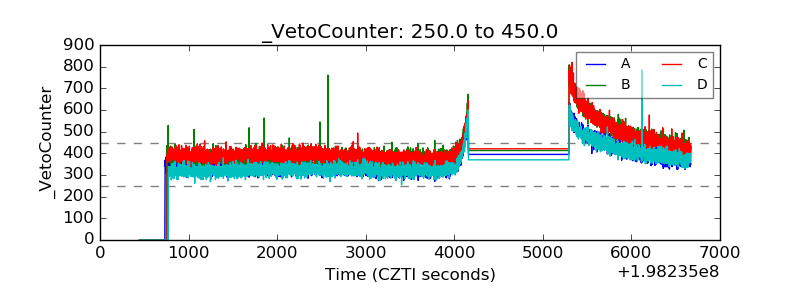 |