| Param | Original file | Final file |
|---|---|---|
| Filename | modeM0/AS1P01_999T99_9000000414_02938cztM0_level2.evt | modeM0/AS1P01_999T99_9000000414_02938cztM0_level2_quad_clean.evt |
| Size (bytes) | 560,468,160 | 59,797,440 |
| Size | 534.5 MB | 57.0 MB |
| Events in quadrant A | 2,604,372 | 389,577 |
| Events in quadrant B | 3,380,940 | 386,600 |
| Events in quadrant C | 2,925,131 | 363,355 |
| Events in quadrant D | 7,703,728 | 298,518 |
| Mode M0 | |||
|---|---|---|---|
| Quadrant | BADHDUFLAG | Total packets | Discarded packets |
| A | 0 | 11355 | 3 |
| B | 0 | 13508 | 2 |
| C | 0 | 12403 | 2 |
| D | 0 | 26601 | 2 |
| Mode M9 | |||
|---|---|---|---|
| Quadrant | BADHDUFLAG | Total packets | Discarded packets |
| A | 0 | 26 | 0 |
| B | 0 | 26 | 0 |
| C | 0 | 26 | 0 |
| D | 0 | 27 | 0 |
| Mode SS | |||
|---|---|---|---|
| Quadrant | BADHDUFLAG | Total packets | Discarded packets |
| A | 0 | 108 | 0 |
| B | 0 | 108 | 0 |
| C | 0 | 108 | 0 |
| D | 0 | 108 | 0 |
| Quadrant | Total seconds | Saturated seconds | Saturation percentage |
|---|---|---|---|
| A | 5307 | 16 | 0.301489% |
| B | 5307 | 116 | 2.185792% |
| C | 5307 | 201 | 3.787451% |
| D | 5307 | 1859 | 35.029207% |
Noise dominated data is calculated using 1-second bins in cleaned event files. If a bin has >2000 counts, and if more than 50% of those come from <1% of pixels, then it is considered to be noise-dominated and hence unusable.
| Quadrant | # 1 sec bins | Bins with >0 counts | Bins with >2000 counts | High rate bins dominated by noise | Noise dominated (total time) | Noise dominated (detector-on time) | Marked lightcurve |
|---|---|---|---|---|---|---|---|
| A | 14593 | 12451 | 4 | 4 | 0.03% | 0.03% | 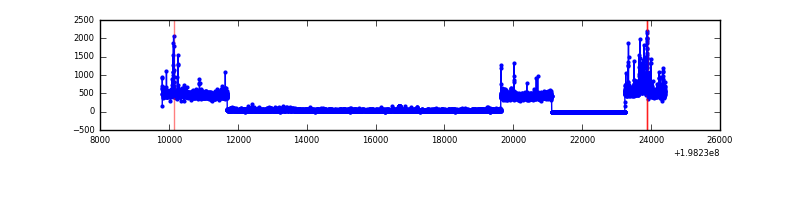 |
| B | 14593 | 12353 | 59 | 59 | 0.40% | 0.48% | 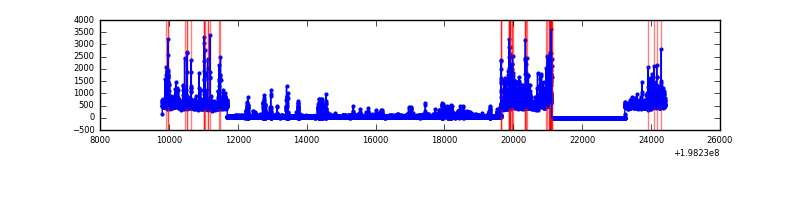 |
| C | 14593 | 12435 | 148 | 148 | 1.01% | 1.19% | 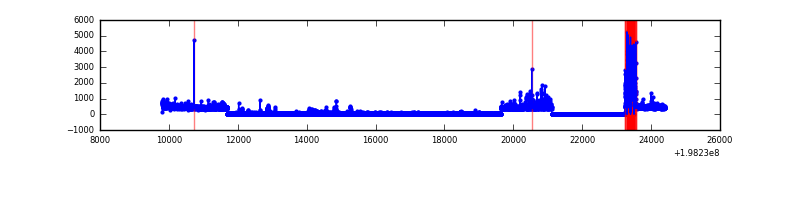 |
| D | 14593 | 11974 | 1171 | 1171 | 8.02% | 9.78% | 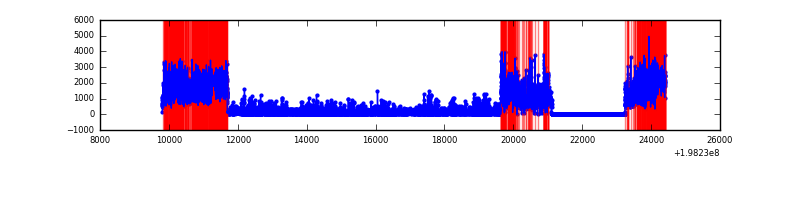 |
Top three noisy pixels from each quadrant. If the there are fewer than three noisy pixels in the level2.evt file, extra rows are filled as -1
| Pixel properties | Quadrant properties | ||||||
|---|---|---|---|---|---|---|---|
| Quadrant | DetID | PixID | Counts | Sigma | Mean | Median | Sigma |
| A | 13 | 164 | 107382 | 920.79 | 587 | 576 | 116.0 |
| A | 15 | 249 | 65579 | 560.4 | 587 | 576 | 116.0 |
| A | 12 | 113 | 41772 | 355.16 | 587 | 576 | 116.0 |
| B | 3 | 27 | 595023 | 5282.51 | 586 | 574 | 112.5 |
| B | 3 | 11 | 102596 | 906.61 | 586 | 574 | 112.5 |
| B | 5 | 70 | 98586 | 870.97 | 586 | 574 | 112.5 |
| C | 9 | 204 | 481794 | 3689.29 | 559 | 561 | 130.4 |
| C | 6 | 80 | 101180 | 771.38 | 559 | 561 | 130.4 |
| C | 8 | 162 | 23006 | 172.07 | 559 | 561 | 130.4 |
| D | 14 | 81 | 1345374 | 11073.9 | 487 | 476 | 121.4 |
| D | 15 | 50 | 1116088 | 9185.95 | 487 | 476 | 121.4 |
| D | 15 | 194 | 768629 | 6324.97 | 487 | 476 | 121.4 |
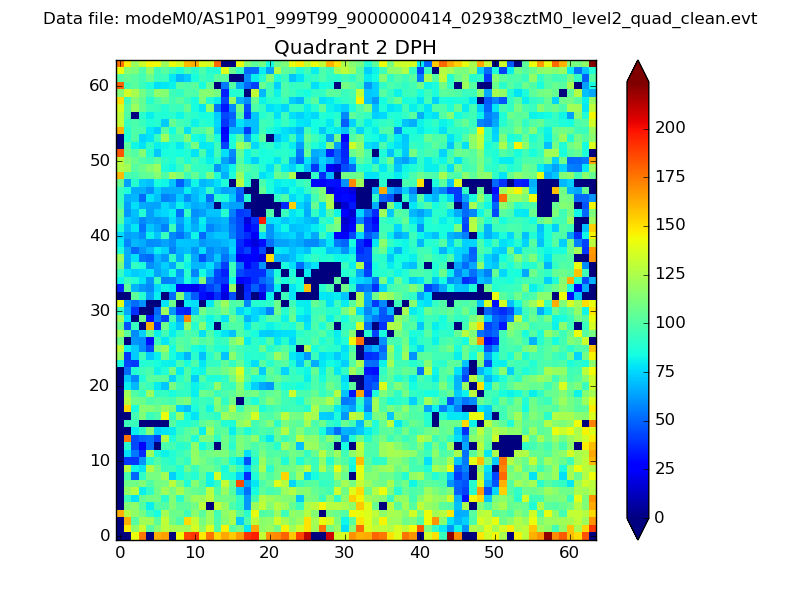
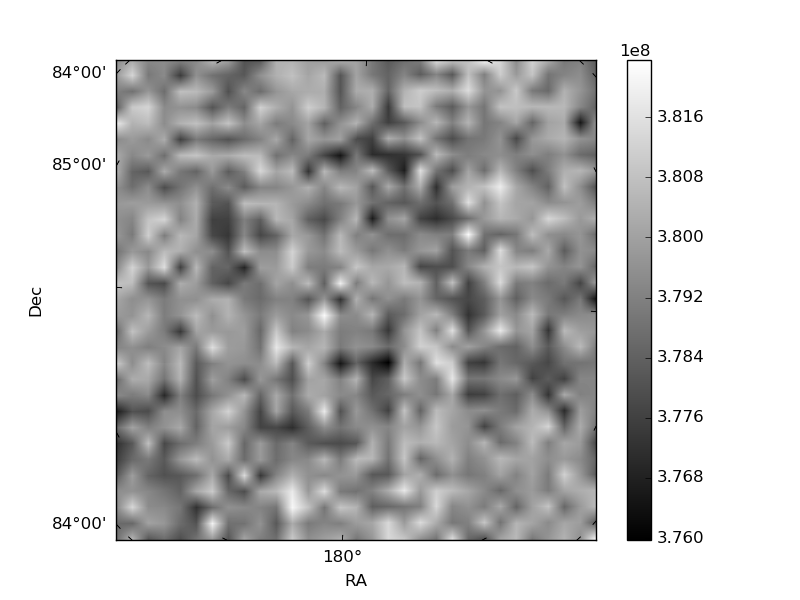
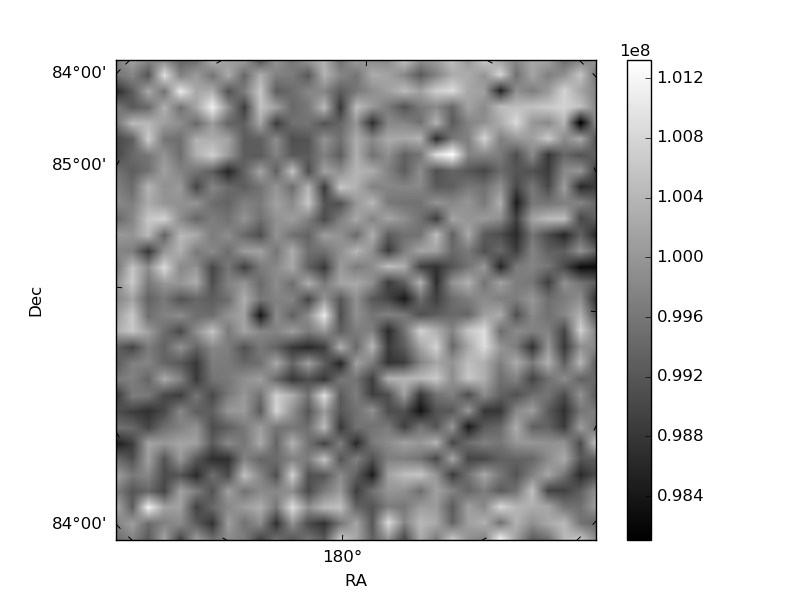
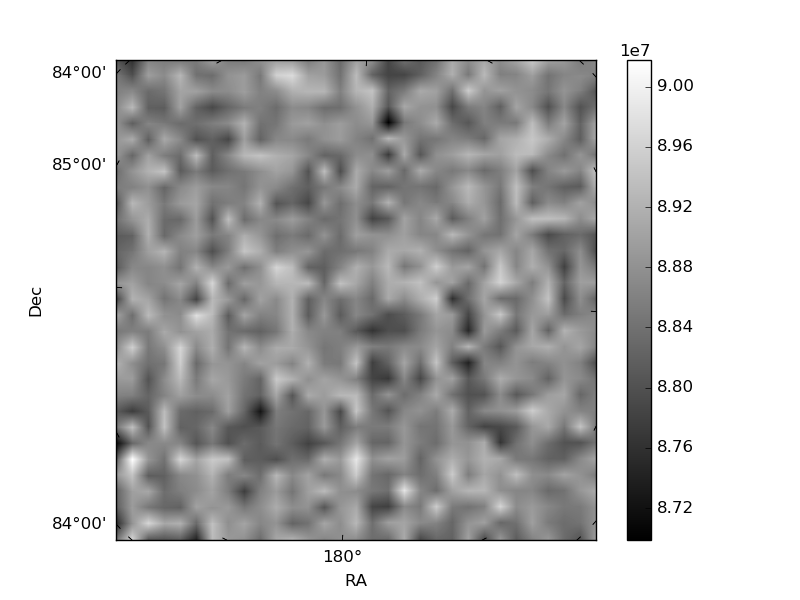
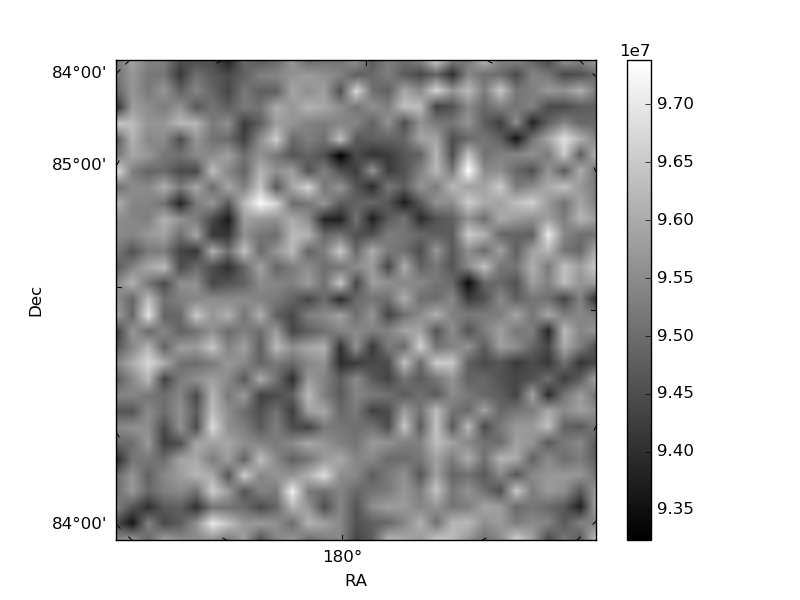
Histogram calculated using DETX and DETY for each event in the final _common_clean file
| Quadrant A | 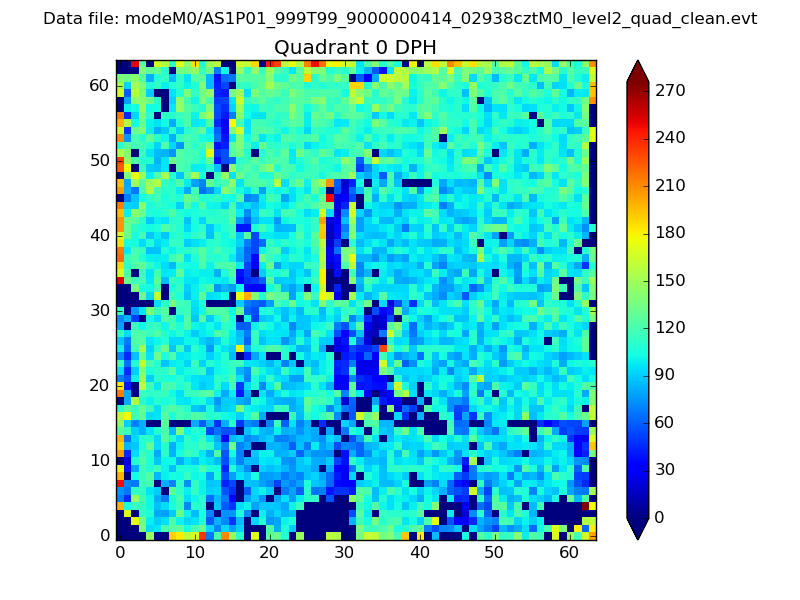 |
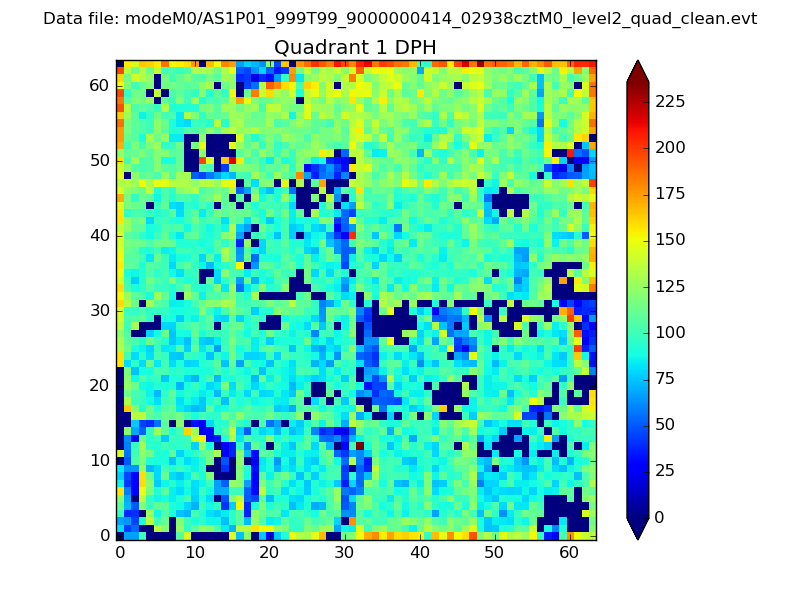 |
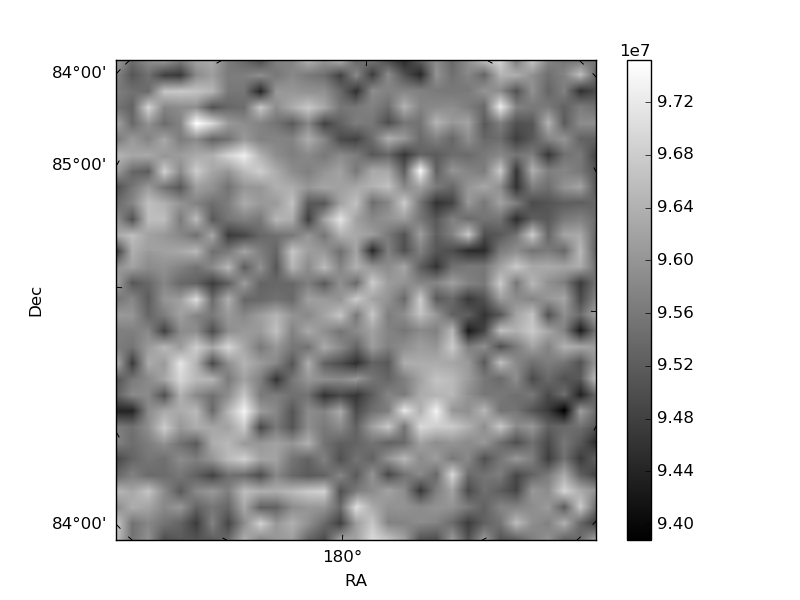
Quadrant B |
|---|---|---|---|
| Quadrant D | 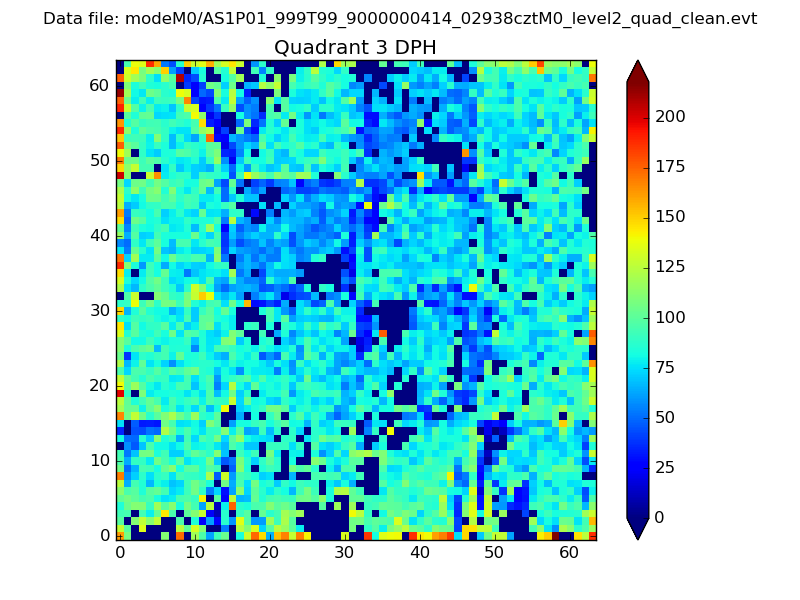 |
 |
Quadrant C |
| Plot type | Count rate plots | Images |
|---|---|---|
| Comparison with Poisson distribution Blue bars denote a histogram of data divided into 1 sec bins. Red curve is a Poisson curve with rate = median count rate of data. |
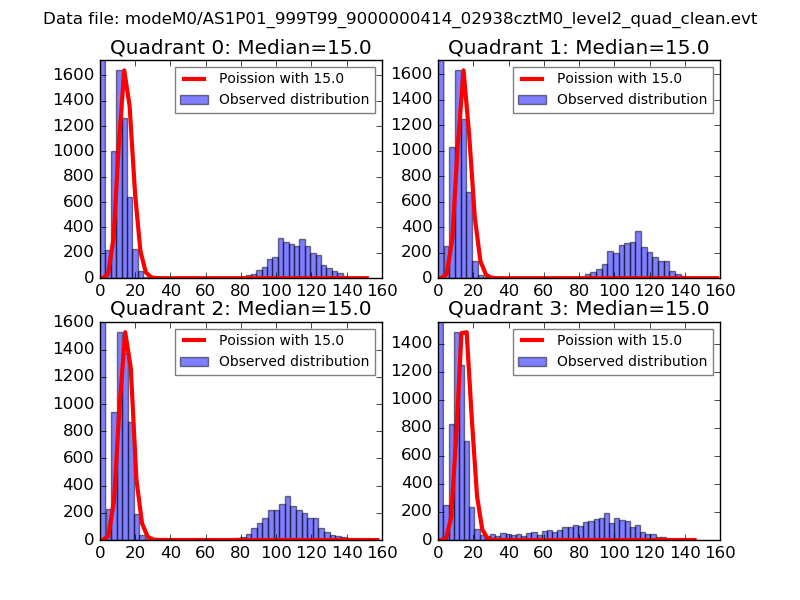 |
 |
| Quadrant-wise count rates Data is divided into 100 sec bins |
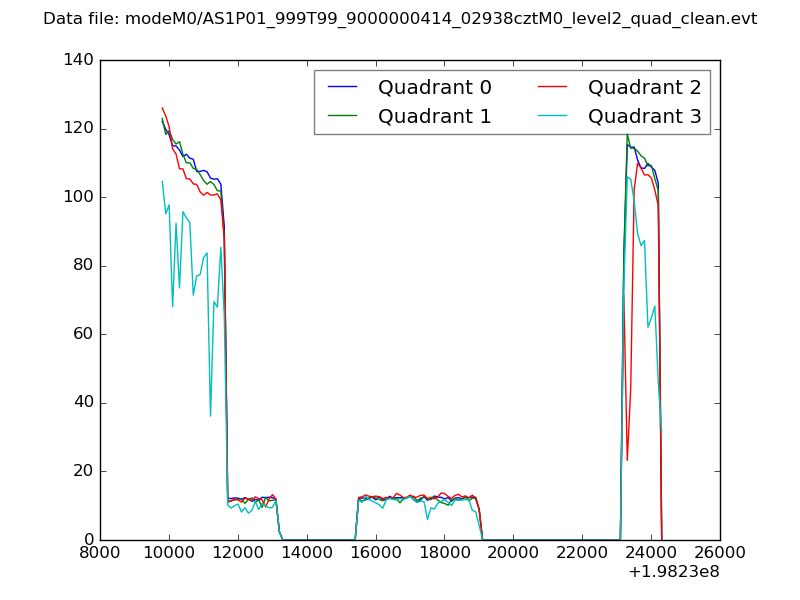 |
|
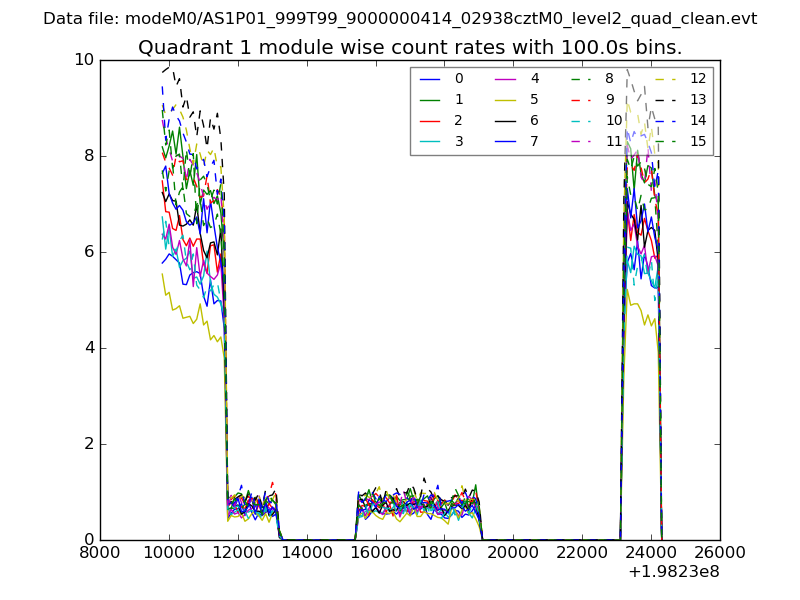
| Module-wise count rates for Quadrant A Data is divided into 100 sec bins |
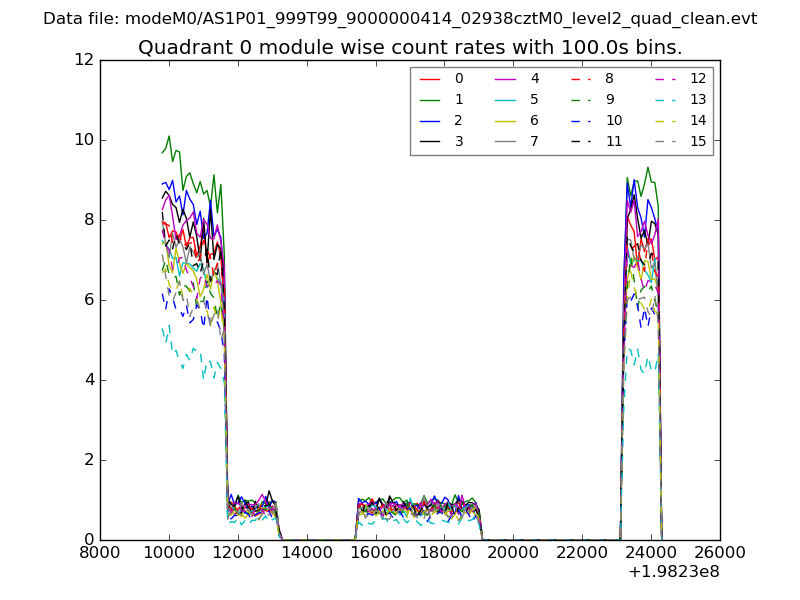 |
 |
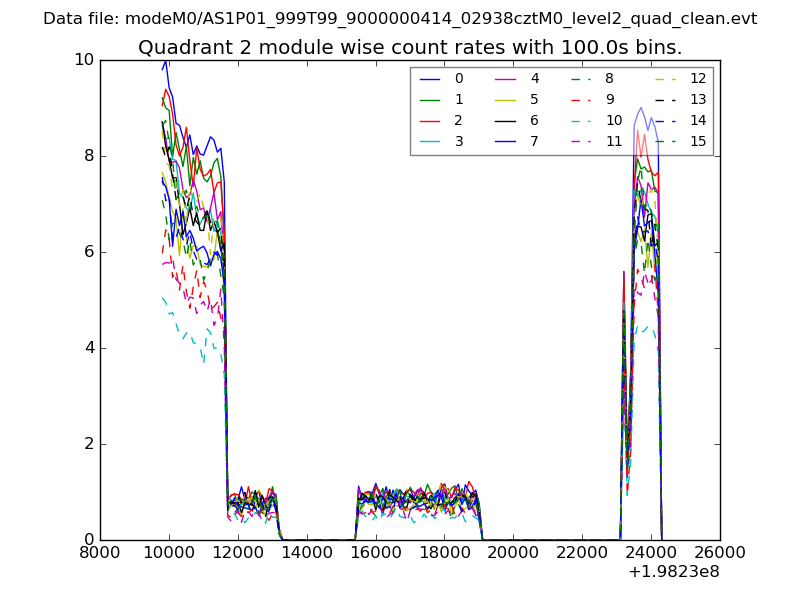
| Module-wise count rates for Quadrant B Data is divided into 100 sec bins |
 |
 |
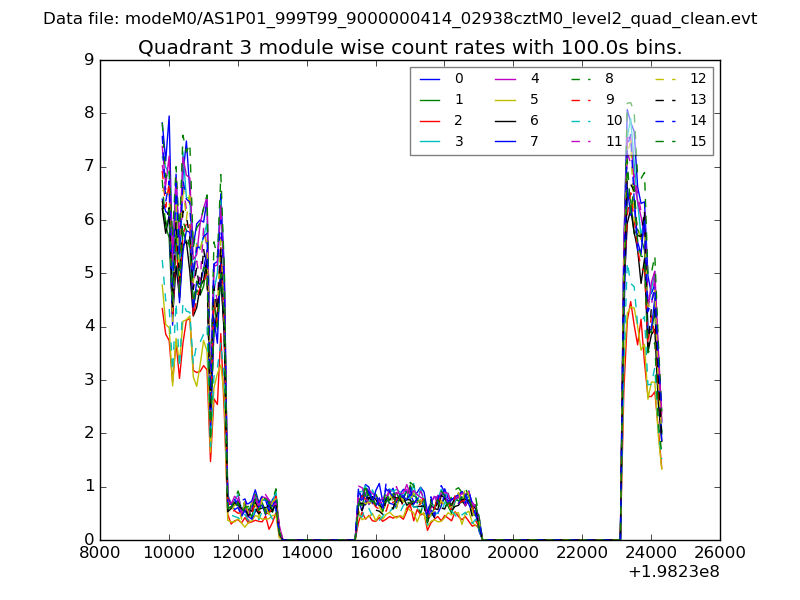
| Module-wise count rates for Quadrant C Data is divided into 100 sec bins |
 |
 |
| Module-wise count rates for Quadrant D Data is divided into 100 sec bins |
 |
 |
| Parameter | Plot |
|---|---|
| CZT HV Monitor | 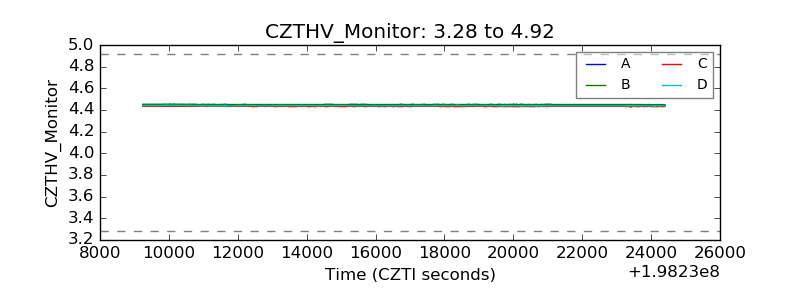 |
| D_VDD | 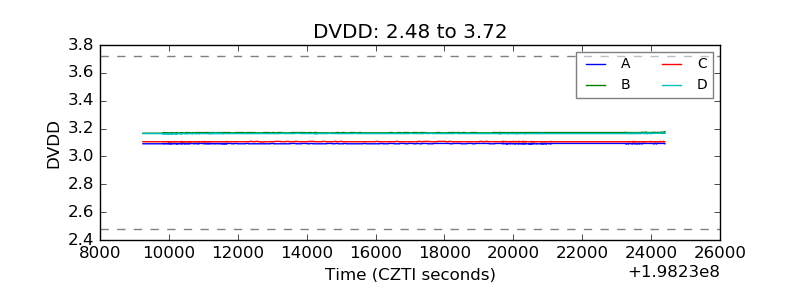 |
| Temperature 1 | 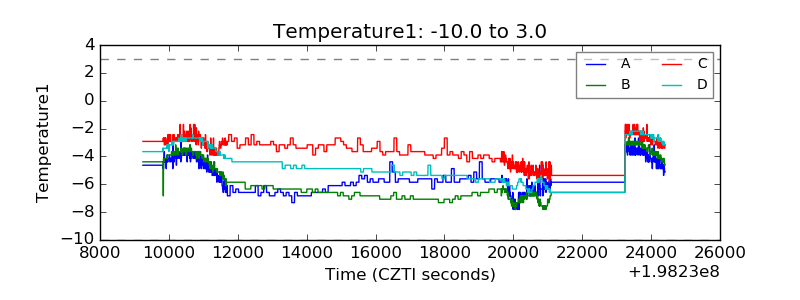 |
| Veto HV Monitor | 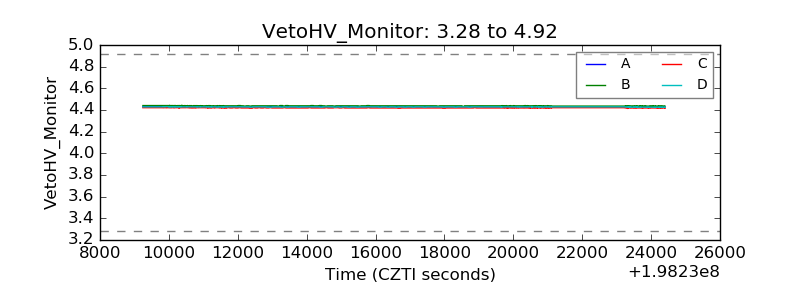 |
| Veto LLD | 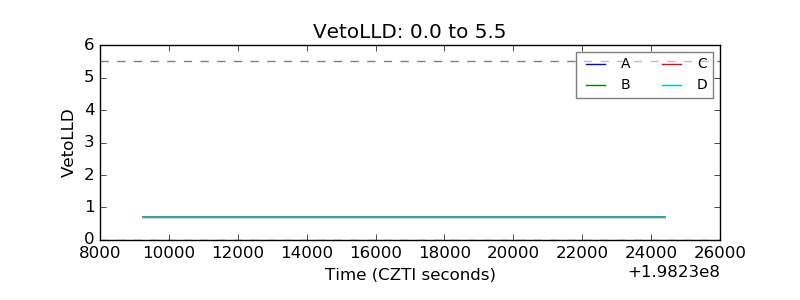 |
| Alpha Counter | 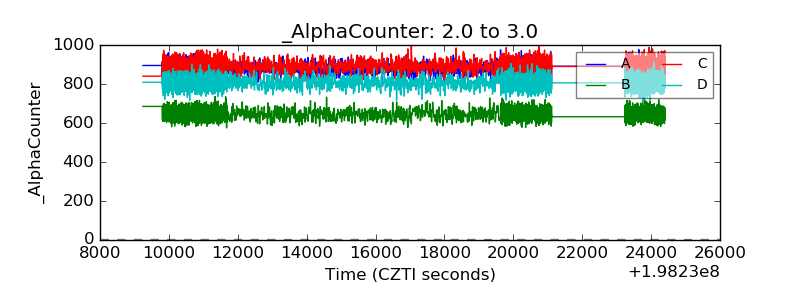 |
| _CPM_Rate | 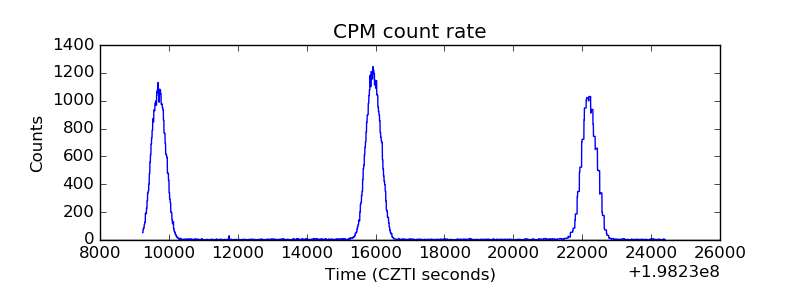 |
| CZT Counter | 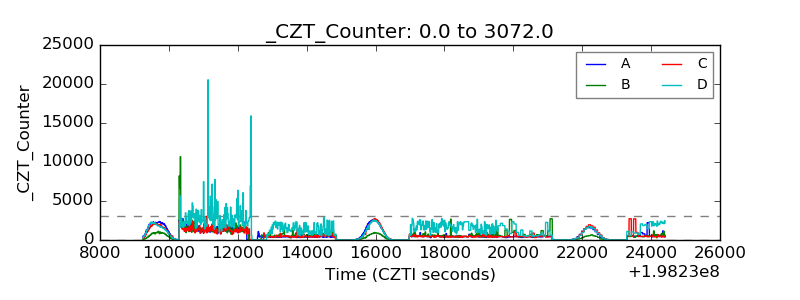 |
| +2.5 Volts monitor | 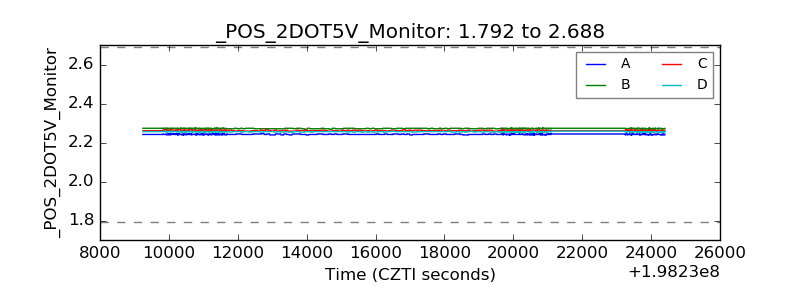 |
| +5 Volts monitor | 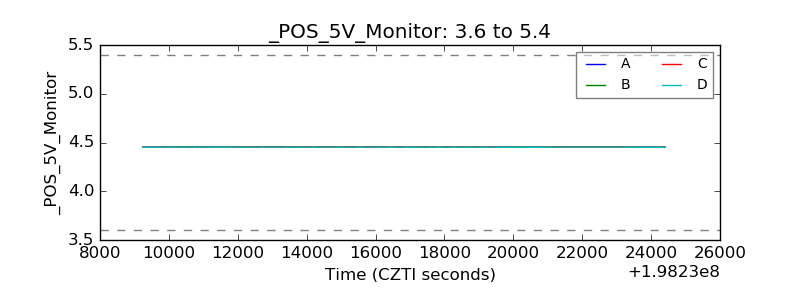 |
| Veto Counter | 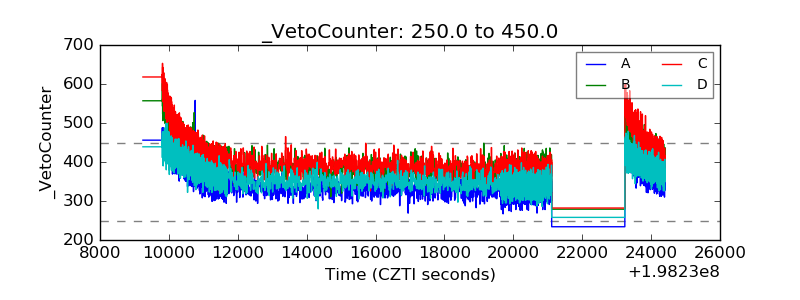 |