| Param | Original file | Final file |
|---|---|---|
| Filename | modeM0/AS1P01_999T99_9000000414_02939cztM0_level2.evt | modeM0/AS1P01_999T99_9000000414_02939cztM0_level2_quad_clean.evt |
| Size (bytes) | 545,011,200 | 45,711,360 |
| Size | 519.8 MB | 43.6 MB |
| Events in quadrant A | 2,465,240 | 283,637 |
| Events in quadrant B | 2,761,168 | 282,004 |
| Events in quadrant C | 2,762,842 | 270,844 |
| Events in quadrant D | 8,181,140 | 199,747 |
| Mode M0 | |||
|---|---|---|---|
| Quadrant | BADHDUFLAG | Total packets | Discarded packets |
| A | 0 | 10846 | 2 |
| B | 0 | 11484 | 1 |
| C | 0 | 11634 | 1 |
| D | 0 | 27779 | 1 |
| Mode M9 | |||
|---|---|---|---|
| Quadrant | BADHDUFLAG | Total packets | Discarded packets |
| A | 0 | 22 | 0 |
| B | 0 | 22 | 0 |
| C | 0 | 22 | 0 |
| D | 0 | 22 | 0 |
| Mode SS | |||
|---|---|---|---|
| Quadrant | BADHDUFLAG | Total packets | Discarded packets |
| A | 0 | 100 | 0 |
| B | 0 | 100 | 0 |
| C | 0 | 100 | 0 |
| D | 0 | 100 | 0 |
| Quadrant | Total seconds | Saturated seconds | Saturation percentage |
|---|---|---|---|
| A | 4946 | 19 | 0.384149% |
| B | 4946 | 31 | 0.626769% |
| C | 4946 | 93 | 1.880307% |
| D | 4946 | 2264 | 45.774363% |
Noise dominated data is calculated using 1-second bins in cleaned event files. If a bin has >2000 counts, and if more than 50% of those come from <1% of pixels, then it is considered to be noise-dominated and hence unusable.
| Quadrant | # 1 sec bins | Bins with >0 counts | Bins with >2000 counts | High rate bins dominated by noise | Noise dominated (total time) | Noise dominated (detector-on time) | Marked lightcurve |
|---|---|---|---|---|---|---|---|
| A | 7103 | 4947 | 9 | 9 | 0.13% | 0.18% | 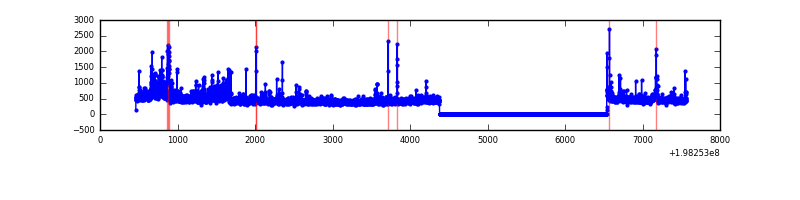 |
| B | 7103 | 4947 | 28 | 28 | 0.39% | 0.57% | 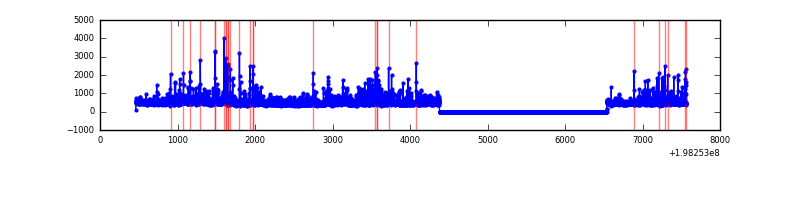 |
| C | 7103 | 4947 | 70 | 70 | 0.99% | 1.41% | 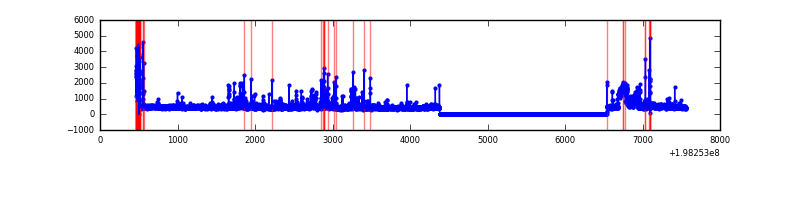 |
| D | 7103 | 4947 | 1681 | 1681 | 23.67% | 33.98% | 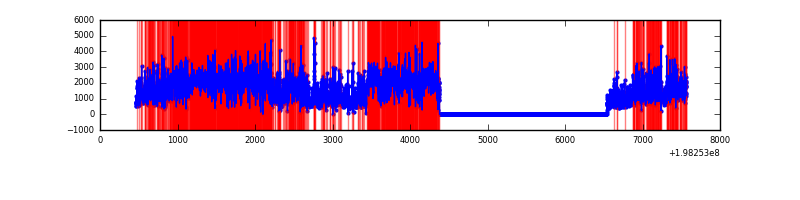 |
Top three noisy pixels from each quadrant. If the there are fewer than three noisy pixels in the level2.evt file, extra rows are filled as -1
| Pixel properties | Quadrant properties | ||||||
|---|---|---|---|---|---|---|---|
| Quadrant | DetID | PixID | Counts | Sigma | Mean | Median | Sigma |
| A | 15 | 249 | 133164 | 1241.79 | 528 | 517 | 106.8 |
| A | 13 | 164 | 90363 | 841.1 | 528 | 517 | 106.8 |
| A | 14 | 249 | 51879 | 480.83 | 528 | 517 | 106.8 |
| B | 3 | 27 | 444173 | 4315.29 | 534 | 522 | 102.8 |
| B | 3 | 11 | 62320 | 601.09 | 534 | 522 | 102.8 |
| B | 8 | 3 | 50553 | 486.64 | 534 | 522 | 102.8 |
| C | 0 | 219 | 231433 | 1874.17 | 520 | 522 | 123.2 |
| C | 9 | 204 | 170493 | 1379.55 | 520 | 522 | 123.2 |
| C | 6 | 80 | 107799 | 870.7 | 520 | 522 | 123.2 |
| D | 15 | 50 | 2269679 | 21809.52 | 416 | 408 | 104.0 |
| D | 15 | 194 | 1436210 | 13799.21 | 416 | 408 | 104.0 |
| D | 14 | 81 | 843142 | 8099.35 | 416 | 408 | 104.0 |
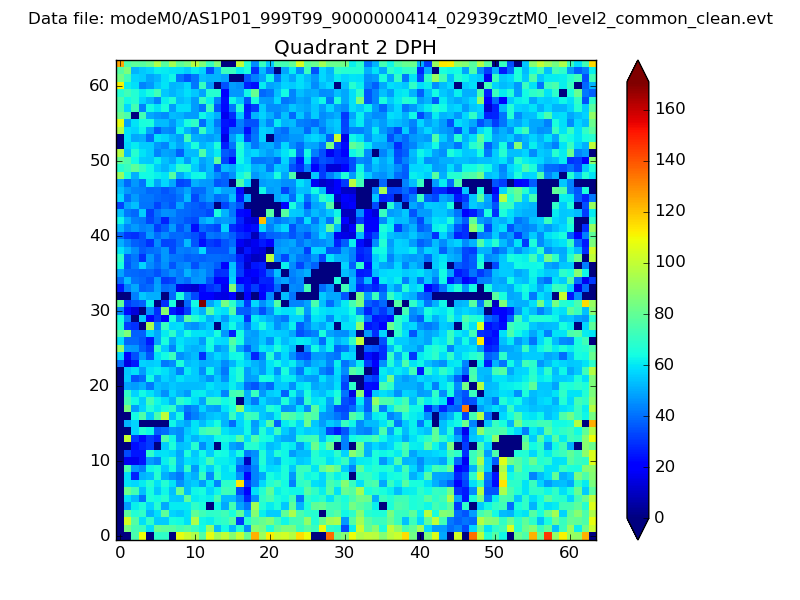
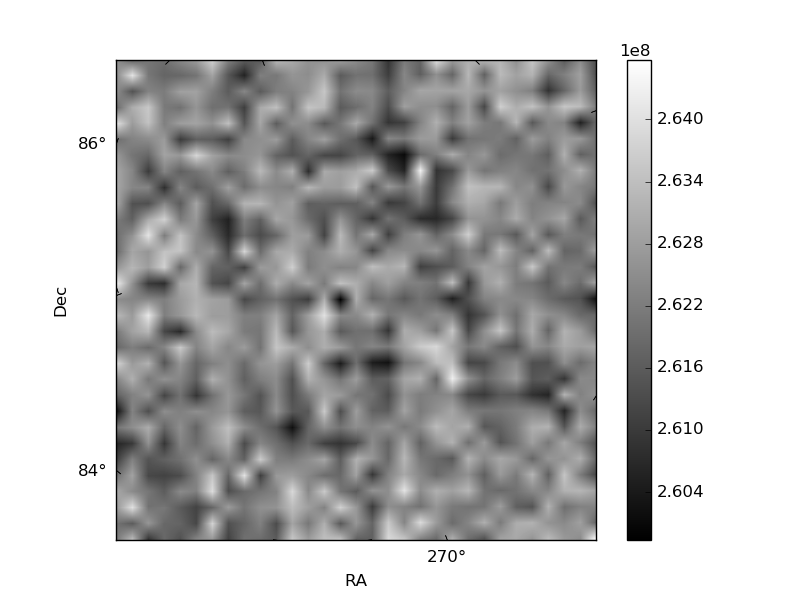
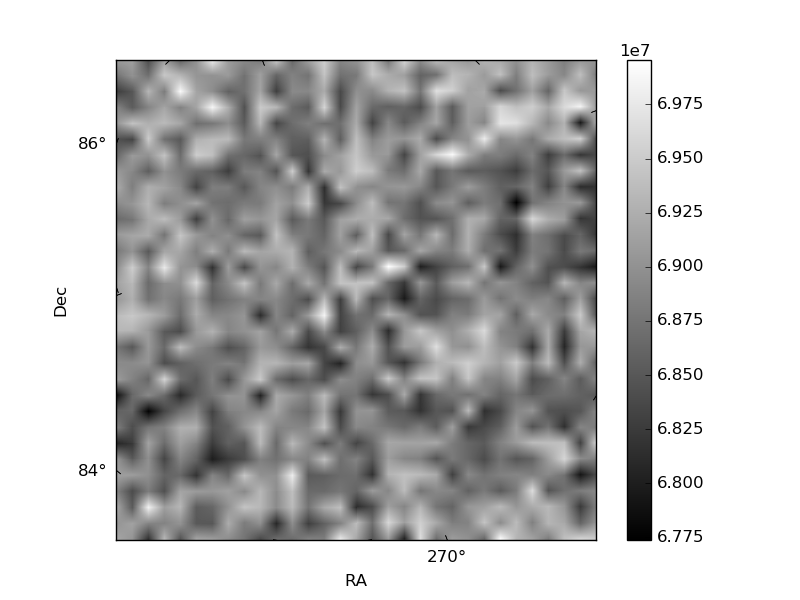
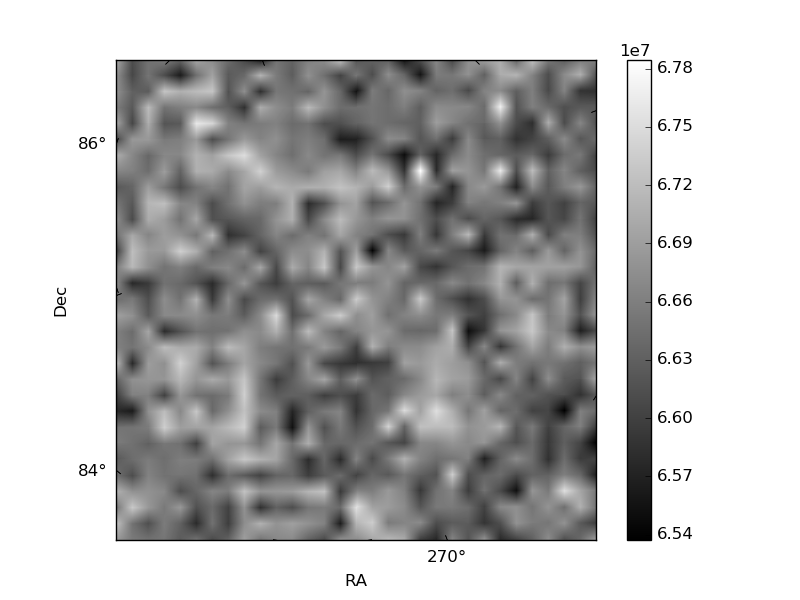
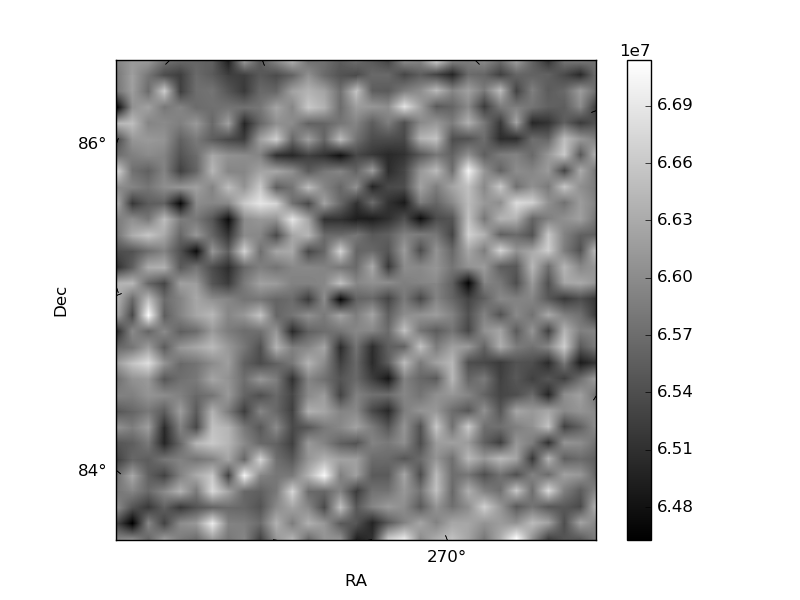
Histogram calculated using DETX and DETY for each event in the final _common_clean file
| Quadrant A | 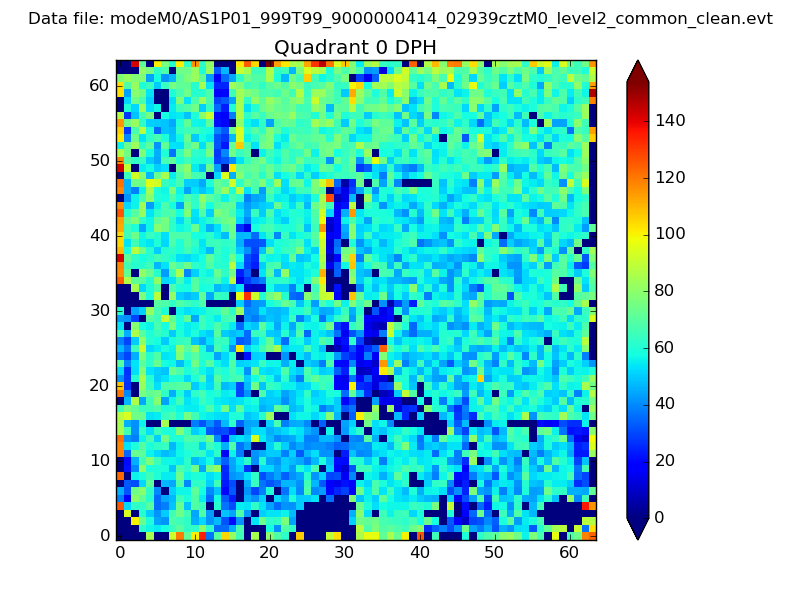 |
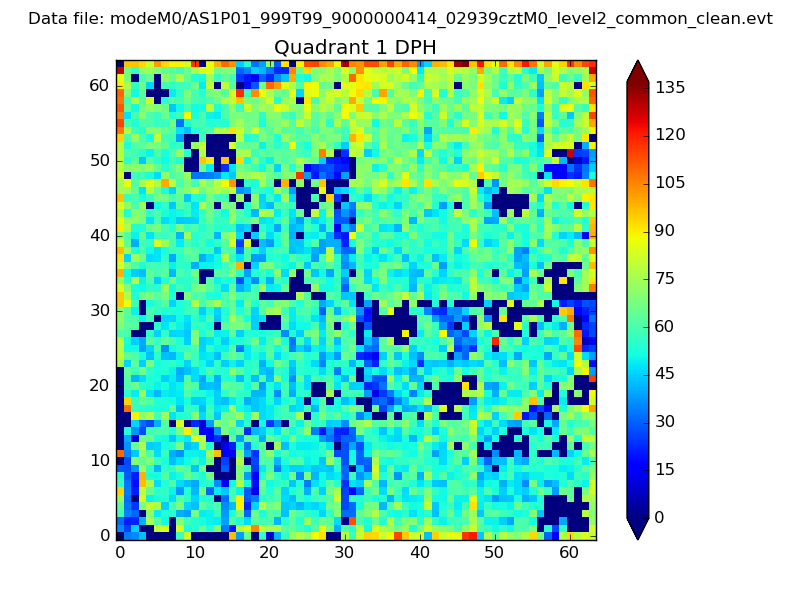 |
Quadrant B |
|---|---|---|---|
| Quadrant D | 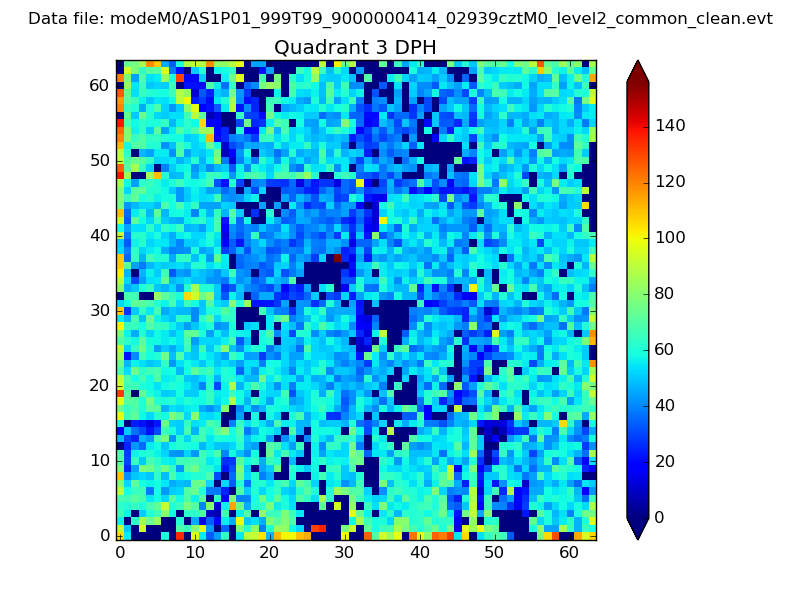 |
 |
Quadrant C |
| Plot type | Count rate plots | Images |
|---|---|---|
| Comparison with Poisson distribution Blue bars denote a histogram of data divided into 1 sec bins. Red curve is a Poisson curve with rate = median count rate of data. |
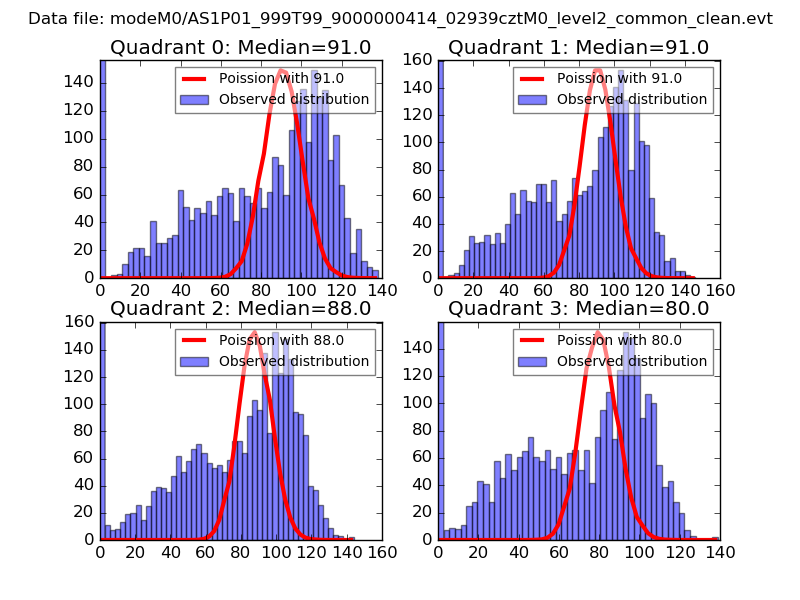 |
 |
| Quadrant-wise count rates Data is divided into 100 sec bins |
 |
|
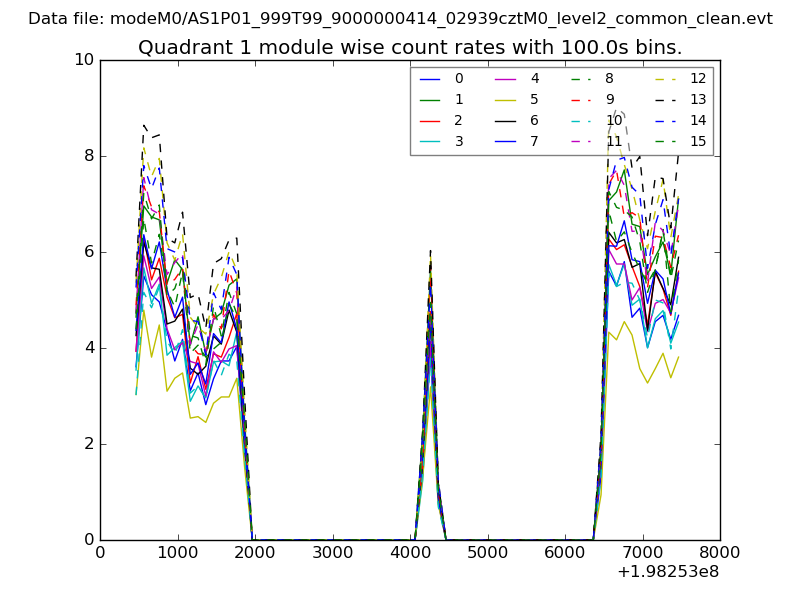
| Module-wise count rates for Quadrant A Data is divided into 100 sec bins |
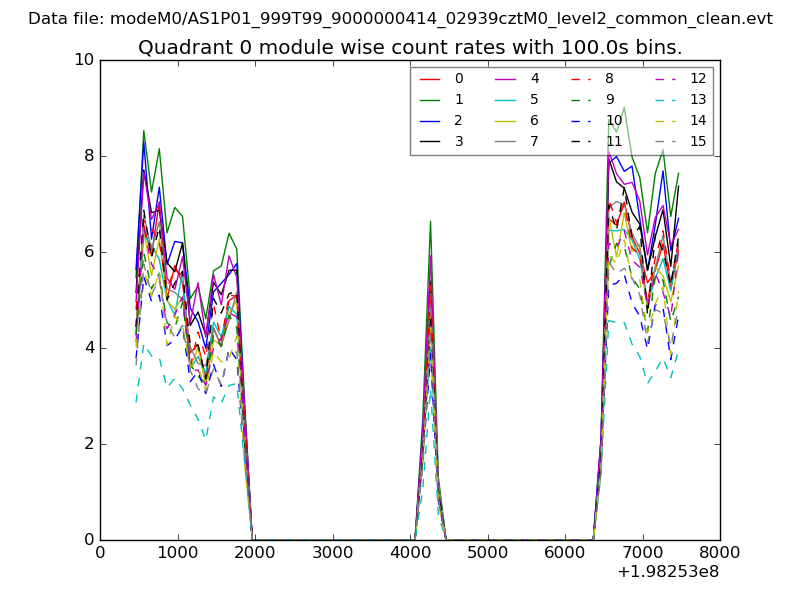 |
 |
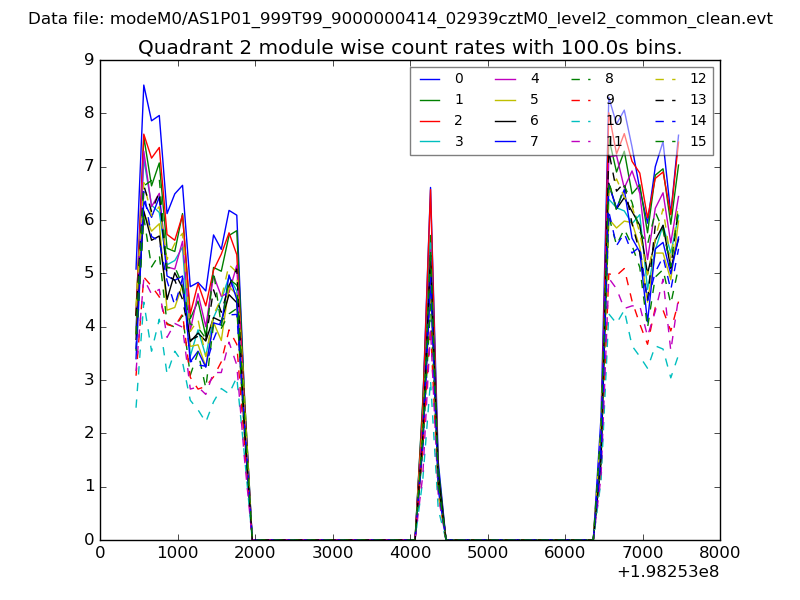
| Module-wise count rates for Quadrant B Data is divided into 100 sec bins |
 |
 |
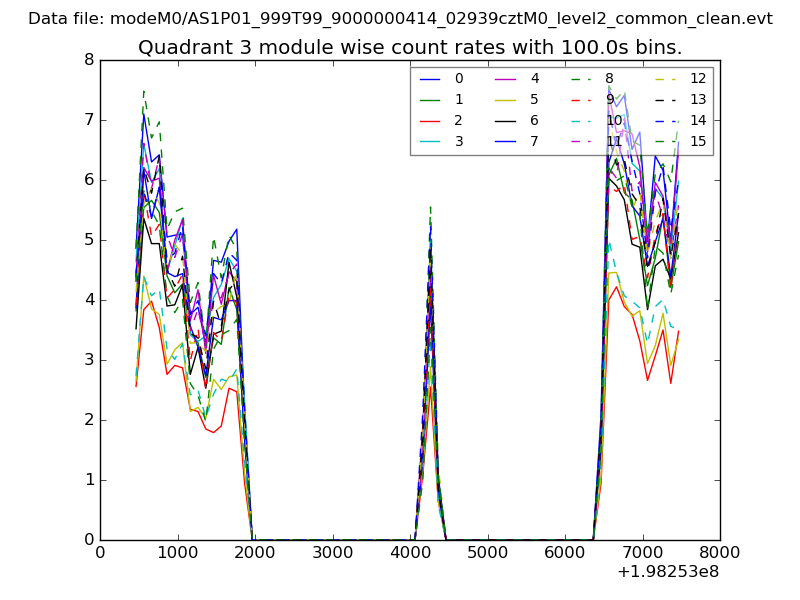
| Module-wise count rates for Quadrant C Data is divided into 100 sec bins |
 |
 |
| Module-wise count rates for Quadrant D Data is divided into 100 sec bins |
 |
 |
| Parameter | Plot |
|---|---|
| CZT HV Monitor | 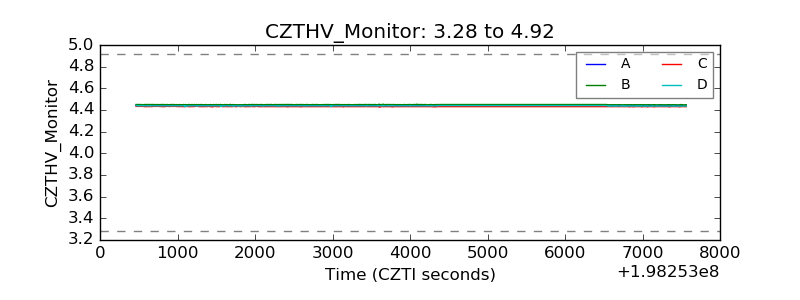 |
| D_VDD | 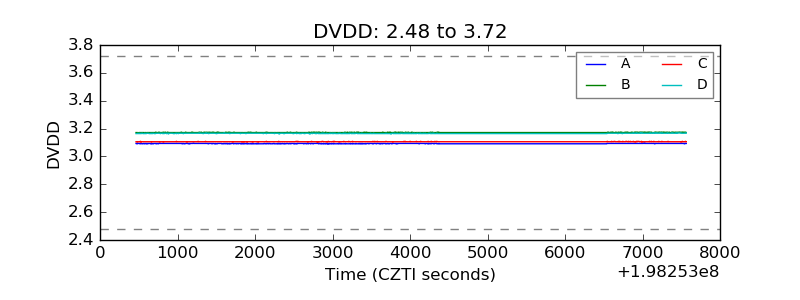 |
| Temperature 1 | 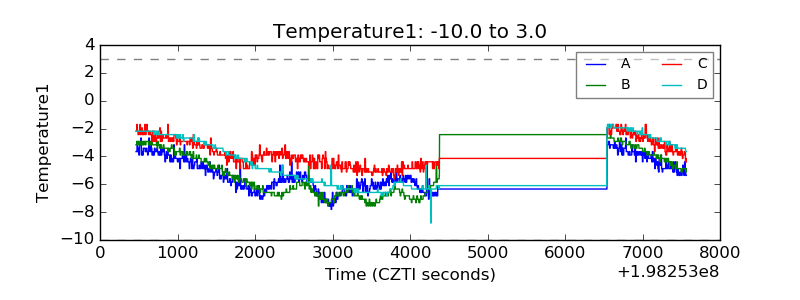 |
| Veto HV Monitor | 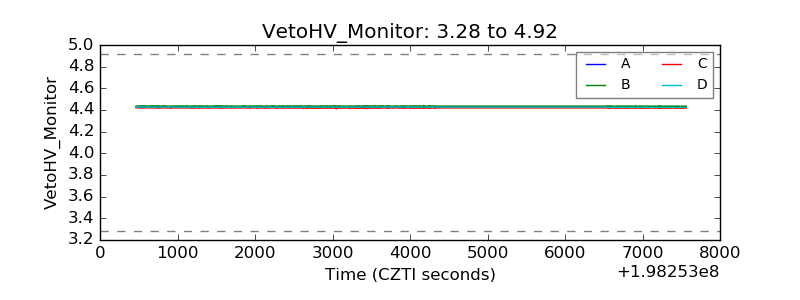 |
| Veto LLD | 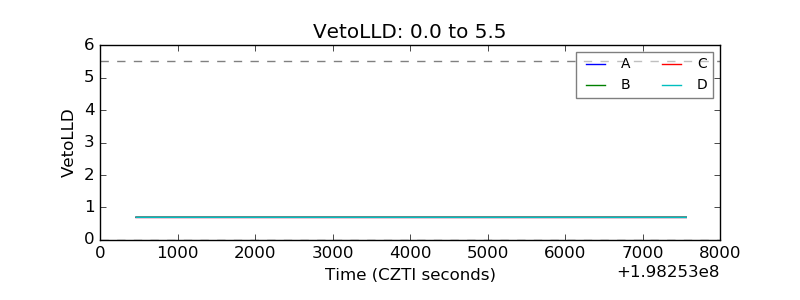 |
| Alpha Counter | 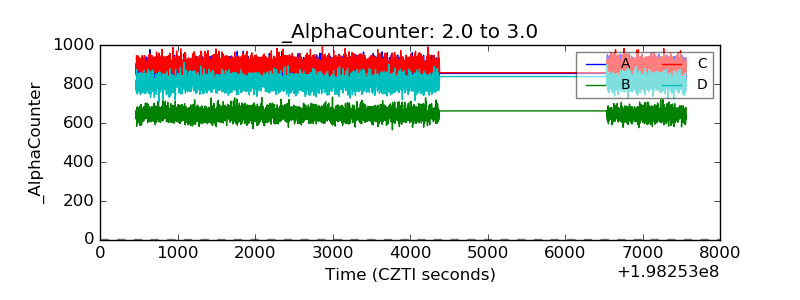 |
| _CPM_Rate | 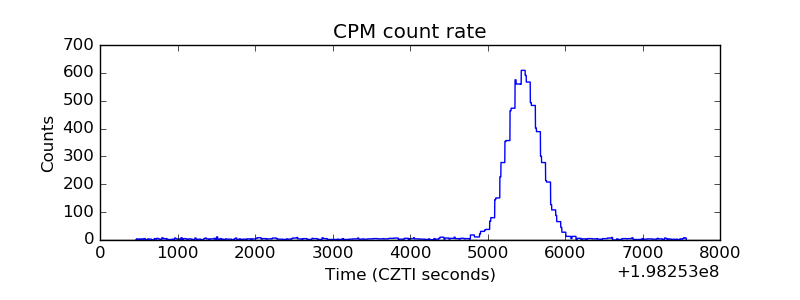 |
| CZT Counter | 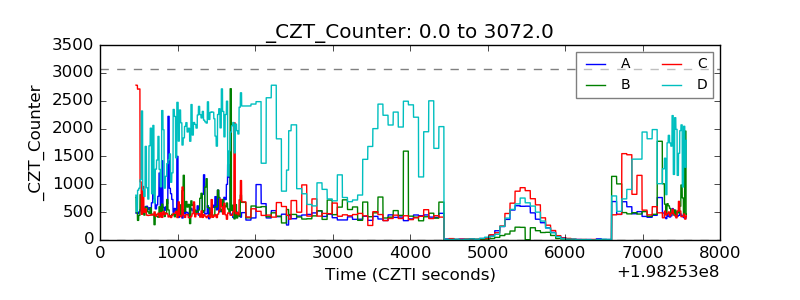 |
| +2.5 Volts monitor |  |
| +5 Volts monitor |  |
| Veto Counter |  |