| Param | Original file | Final file |
|---|---|---|
| Filename | modeM0/AS1P01_999T99_9000000414_02940cztM0_level2.evt | modeM0/AS1P01_999T99_9000000414_02940cztM0_level2_quad_clean.evt |
| Size (bytes) | 544,403,520 | 45,028,800 |
| Size | 519.2 MB | 42.9 MB |
| Events in quadrant A | 2,655,415 | 268,618 |
| Events in quadrant B | 2,985,655 | 269,558 |
| Events in quadrant C | 2,910,619 | 251,995 |
| Events in quadrant D | 7,597,227 | 222,239 |
| Mode M0 | |||
|---|---|---|---|
| Quadrant | BADHDUFLAG | Total packets | Discarded packets |
| A | 0 | 11636 | 3 |
| B | 0 | 12251 | 2 |
| C | 0 | 12287 | 2 |
| D | 0 | 26122 | 2 |
| Mode M9 | |||
|---|---|---|---|
| Quadrant | BADHDUFLAG | Total packets | Discarded packets |
| A | 0 | 24 | 0 |
| B | 0 | 24 | 0 |
| C | 0 | 24 | 0 |
| D | 0 | 25 | 0 |
| Mode SS | |||
|---|---|---|---|
| Quadrant | BADHDUFLAG | Total packets | Discarded packets |
| A | 0 | 100 | 0 |
| B | 0 | 100 | 0 |
| C | 0 | 100 | 0 |
| D | 0 | 100 | 0 |
| Quadrant | Total seconds | Saturated seconds | Saturation percentage |
|---|---|---|---|
| A | 4998 | 63 | 1.260504% |
| B | 4998 | 111 | 2.220888% |
| C | 4998 | 260 | 5.202081% |
| D | 4998 | 1869 | 37.394958% |
Noise dominated data is calculated using 1-second bins in cleaned event files. If a bin has >2000 counts, and if more than 50% of those come from <1% of pixels, then it is considered to be noise-dominated and hence unusable.
| Quadrant | # 1 sec bins | Bins with >0 counts | Bins with >2000 counts | High rate bins dominated by noise | Noise dominated (total time) | Noise dominated (detector-on time) | Marked lightcurve |
|---|---|---|---|---|---|---|---|
| A | 7155 | 4999 | 56 | 56 | 0.78% | 1.12% | 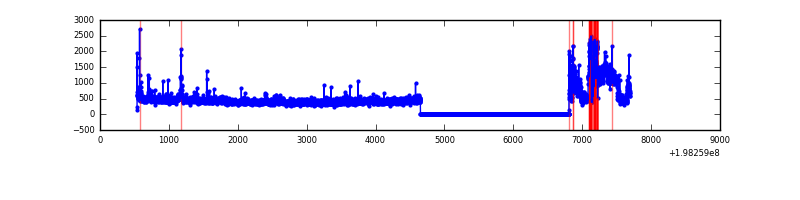 |
| B | 7155 | 4999 | 93 | 93 | 1.30% | 1.86% | 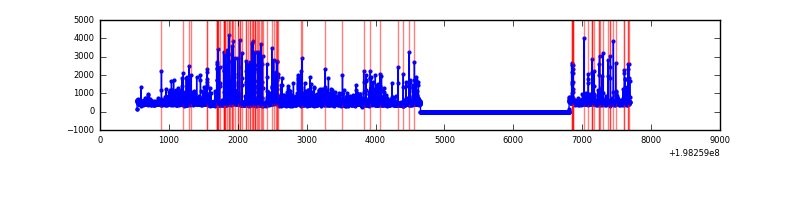 |
| C | 7155 | 4999 | 121 | 121 | 1.69% | 2.42% | 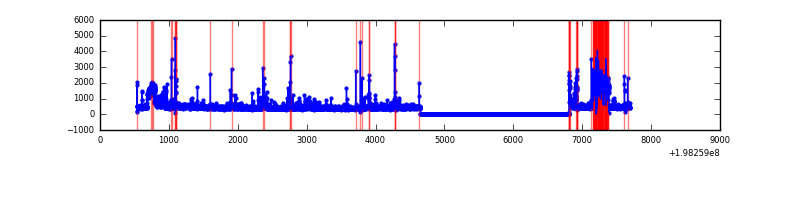 |
| D | 7155 | 4999 | 1322 | 1322 | 18.48% | 26.45% | 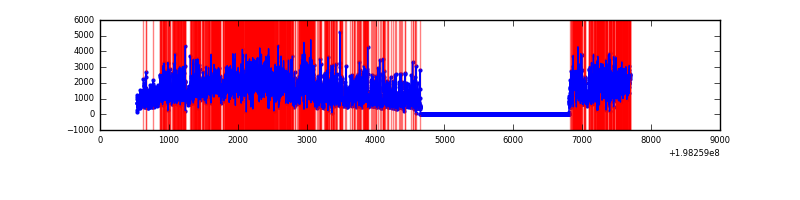 |
Top three noisy pixels from each quadrant. If the there are fewer than three noisy pixels in the level2.evt file, extra rows are filled as -1
| Pixel properties | Quadrant properties | ||||||
|---|---|---|---|---|---|---|---|
| Quadrant | DetID | PixID | Counts | Sigma | Mean | Median | Sigma |
| A | 14 | 63 | 446205 | 4217.38 | 519 | 509 | 105.7 |
| A | 8 | 15 | 70205 | 659.5 | 519 | 509 | 105.7 |
| A | 0 | 31 | 51787 | 485.22 | 519 | 509 | 105.7 |
| B | 3 | 27 | 676700 | 6693.31 | 523 | 513 | 101.0 |
| B | 8 | 3 | 70139 | 689.2 | 523 | 513 | 101.0 |
| B | 0 | 219 | 27688 | 268.99 | 523 | 513 | 101.0 |
| C | 0 | 219 | 699354 | 6024.66 | 500 | 503 | 116.0 |
| C | 6 | 80 | 101313 | 869.06 | 500 | 503 | 116.0 |
| C | 9 | 204 | 40204 | 342.25 | 500 | 503 | 116.0 |
| D | 15 | 50 | 2250898 | 20761.37 | 428 | 420 | 108.4 |
| D | 15 | 194 | 1442289 | 13301.7 | 428 | 420 | 108.4 |
| D | 14 | 97 | 638523 | 5886.7 | 428 | 420 | 108.4 |
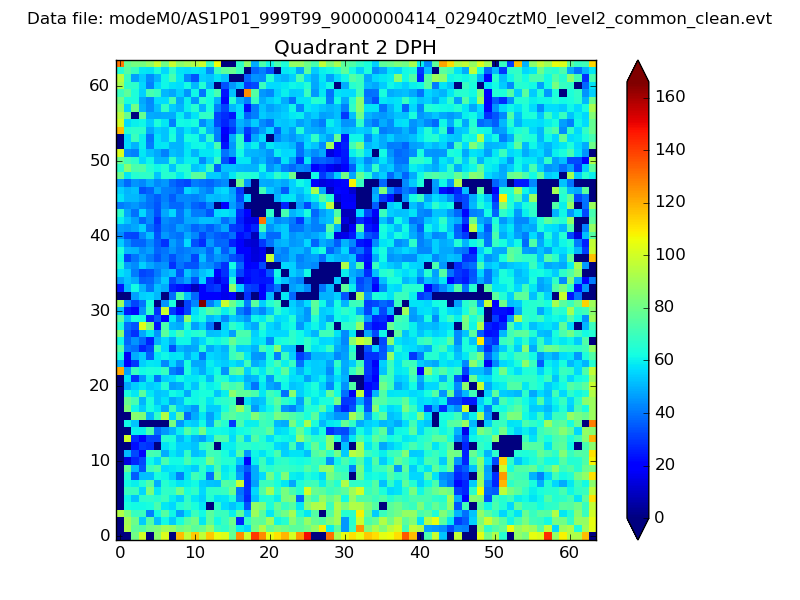
Histogram calculated using DETX and DETY for each event in the final _common_clean file
| Quadrant A | 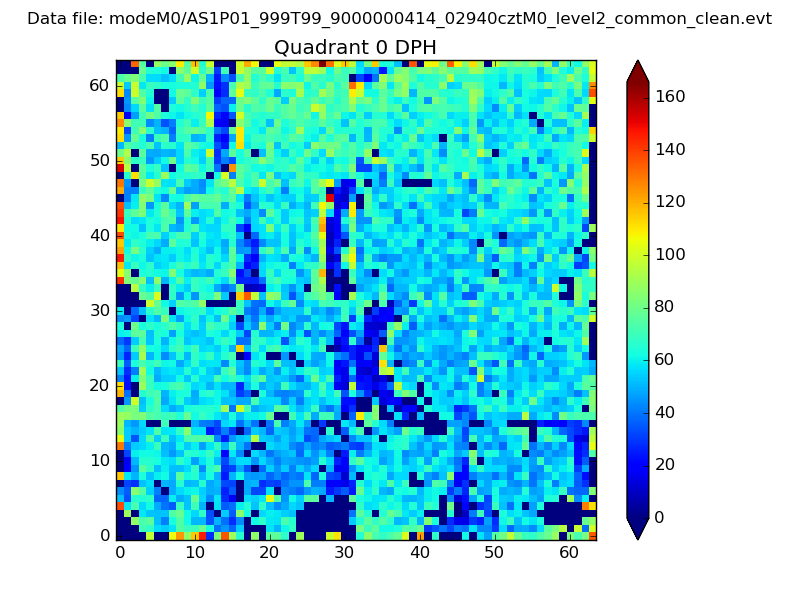 |
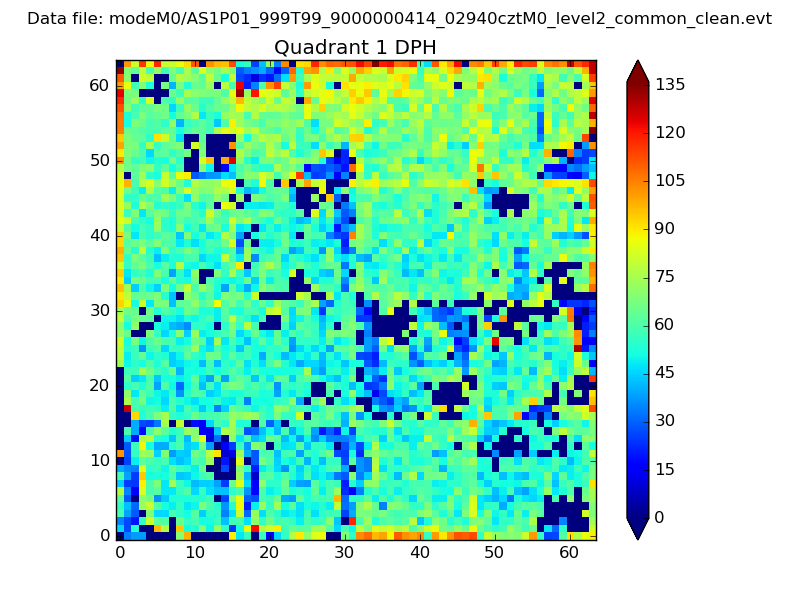 |
Quadrant B |
|---|---|---|---|
| Quadrant D | 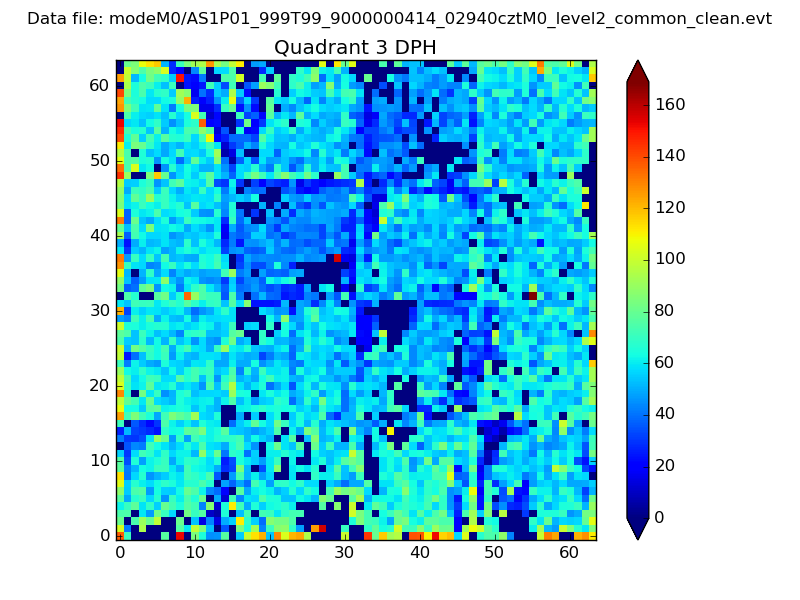 |
 |
Quadrant C |
| Plot type | Count rate plots | Images |
|---|---|---|
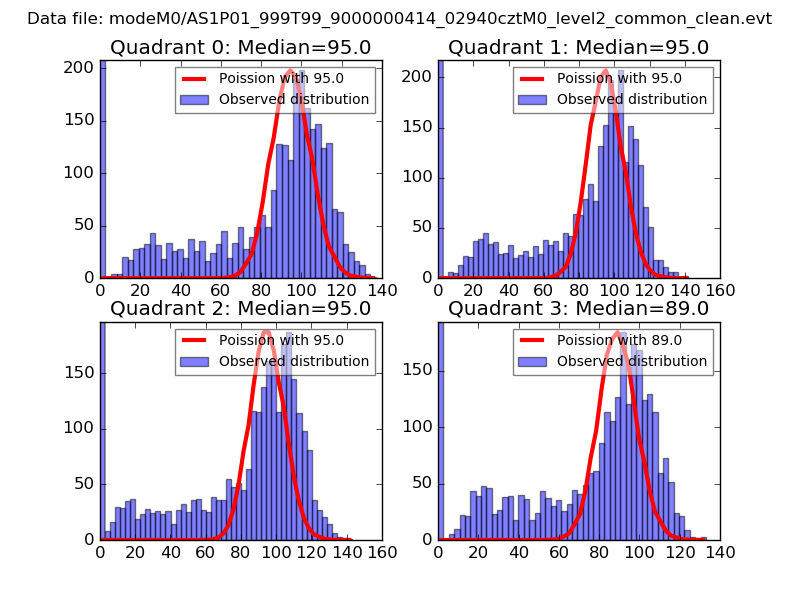
| Comparison with Poisson distribution Blue bars denote a histogram of data divided into 1 sec bins. Red curve is a Poisson curve with rate = median count rate of data. |
 |
 |
| Quadrant-wise count rates Data is divided into 100 sec bins |
 |
|
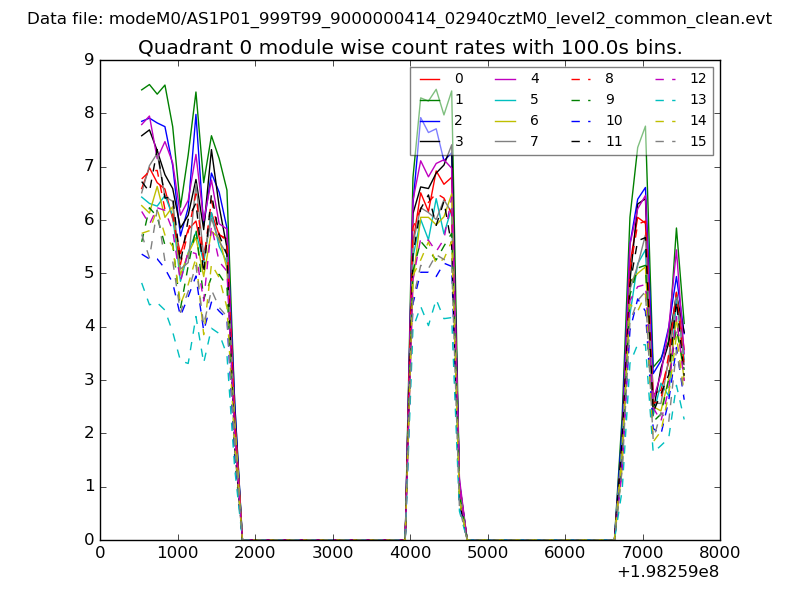
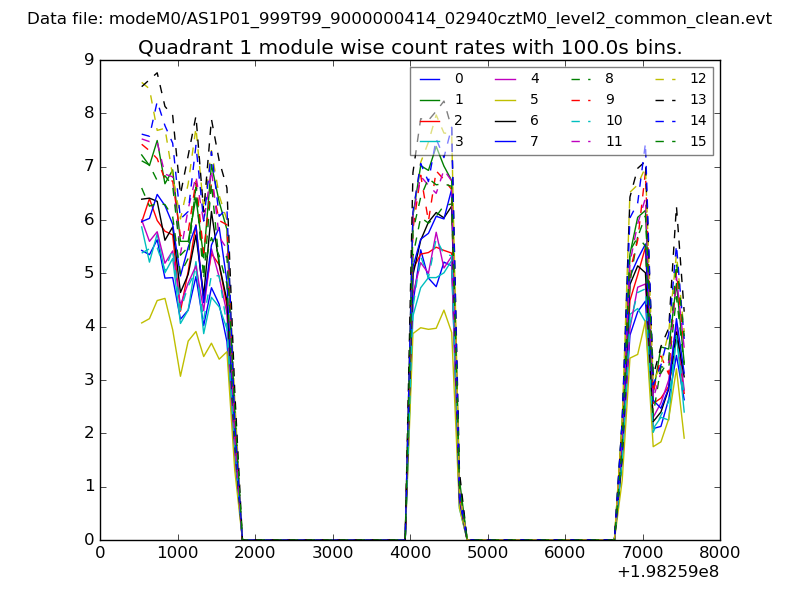
| Module-wise count rates for Quadrant A Data is divided into 100 sec bins |
 |
 |
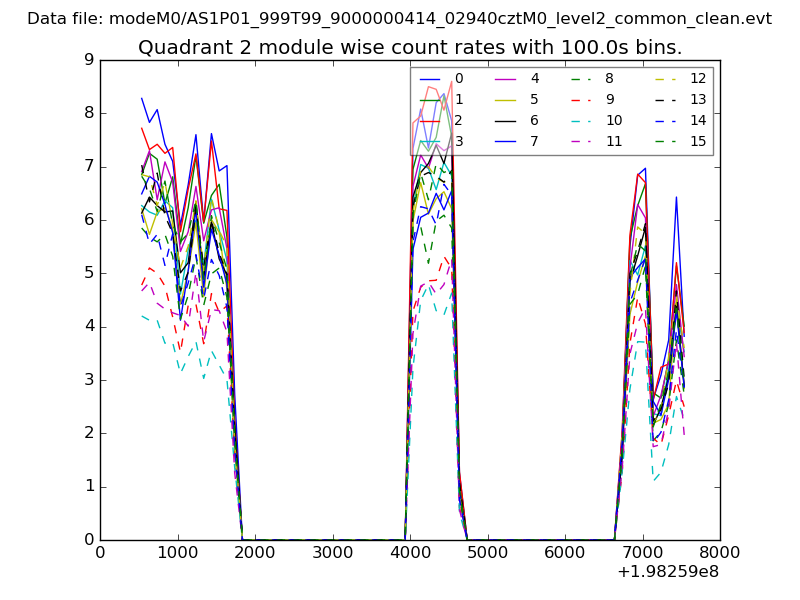
| Module-wise count rates for Quadrant B Data is divided into 100 sec bins |
 |
 |
| Module-wise count rates for Quadrant C Data is divided into 100 sec bins |
 |
 |
| Module-wise count rates for Quadrant D Data is divided into 100 sec bins |
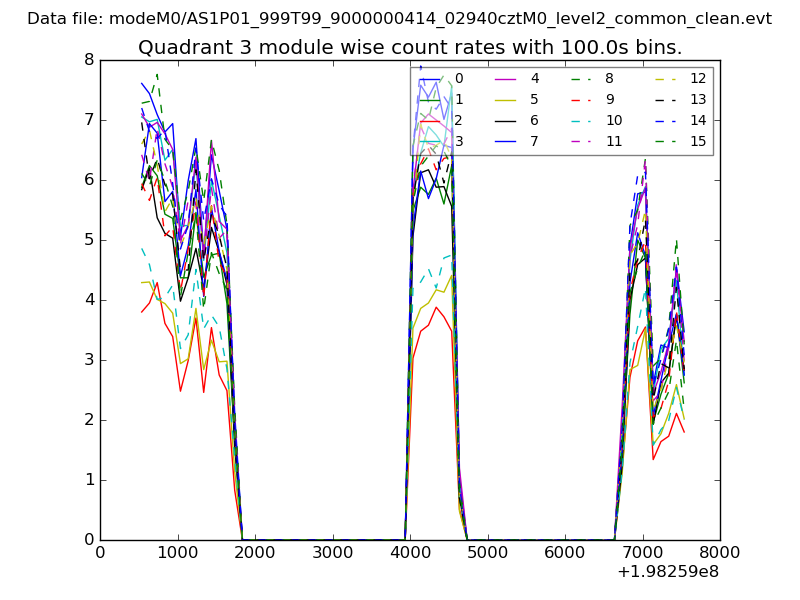 |
 |
| Parameter | Plot |
|---|---|
| CZT HV Monitor | 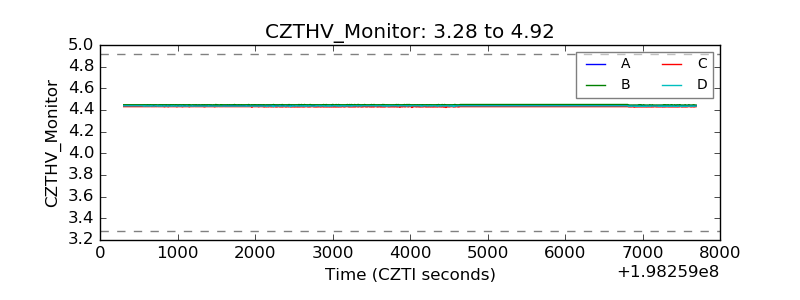 |
| D_VDD | 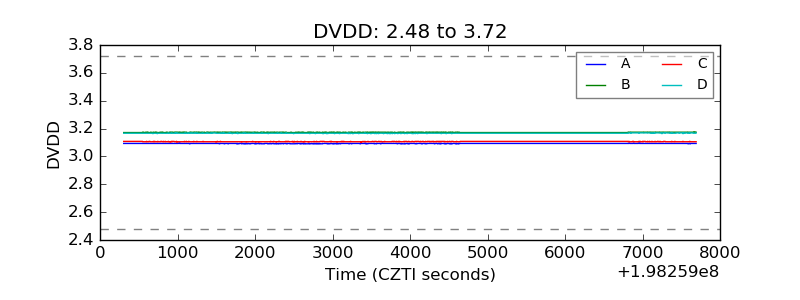 |
| Temperature 1 |  |
| Veto HV Monitor | 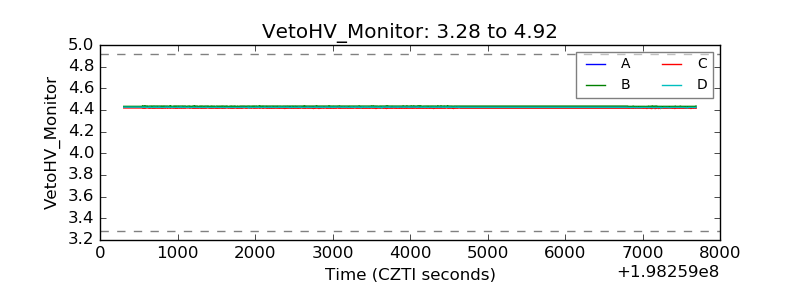 |
| Veto LLD | 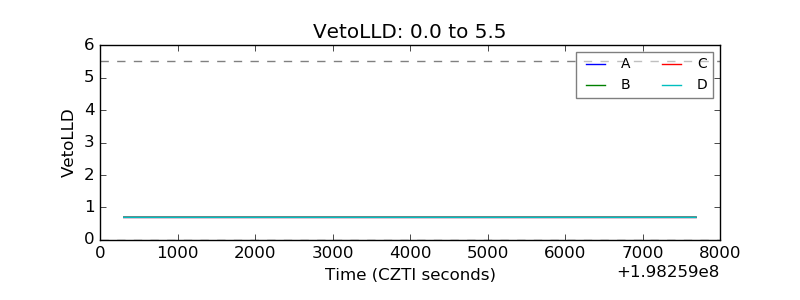 |
| Alpha Counter | 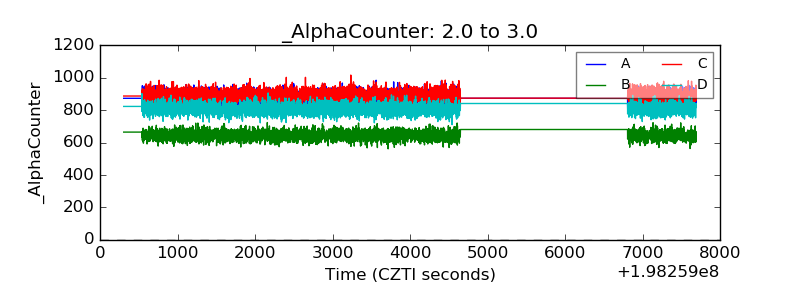 |
| _CPM_Rate | 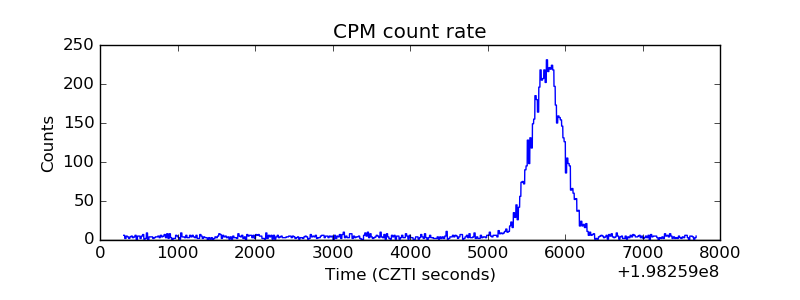 |
| CZT Counter | 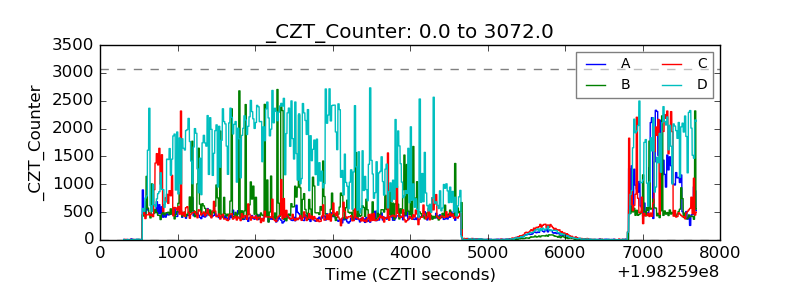 |
| +2.5 Volts monitor |  |
| +5 Volts monitor |  |
| Veto Counter | 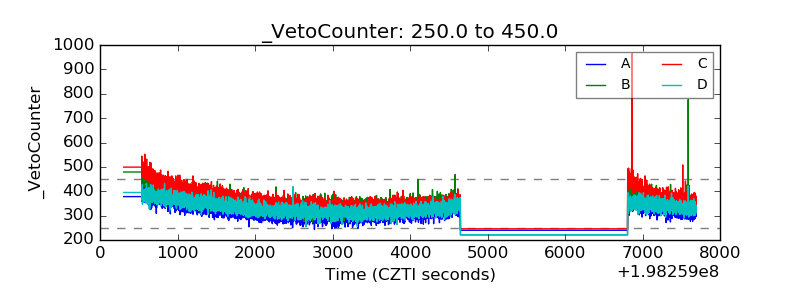 |