| Param | Original file | Final file |
|---|---|---|
| Filename | modeM0/AS1P01_999T99_9000000414_02941cztM0_level2.evt | modeM0/AS1P01_999T99_9000000414_02941cztM0_level2_quad_clean.evt |
| Size (bytes) | 564,076,800 | 38,946,240 |
| Size | 537.9 MB | 37.1 MB |
| Events in quadrant A | 2,887,670 | 217,022 |
| Events in quadrant B | 2,785,160 | 220,398 |
| Events in quadrant C | 3,371,098 | 208,170 |
| Events in quadrant D | 7,699,319 | 180,779 |
| Mode M0 | |||
|---|---|---|---|
| Quadrant | BADHDUFLAG | Total packets | Discarded packets |
| A | 0 | 12267 | 3 |
| B | 0 | 11739 | 2 |
| C | 0 | 13459 | 2 |
| D | 0 | 26401 | 2 |
| Mode M9 | |||
|---|---|---|---|
| Quadrant | BADHDUFLAG | Total packets | Discarded packets |
| A | 0 | 27 | 0 |
| B | 0 | 27 | 0 |
| C | 0 | 27 | 0 |
| D | 0 | 28 | 0 |
| Mode SS | |||
|---|---|---|---|
| Quadrant | BADHDUFLAG | Total packets | Discarded packets |
| A | 0 | 102 | 0 |
| B | 0 | 102 | 0 |
| C | 0 | 102 | 0 |
| D | 0 | 102 | 0 |
| Quadrant | Total seconds | Saturated seconds | Saturation percentage |
|---|---|---|---|
| A | 5018 | 68 | 1.355122% |
| B | 5018 | 63 | 1.255480% |
| C | 5018 | 453 | 9.027501% |
| D | 5018 | 1868 | 37.225986% |
Noise dominated data is calculated using 1-second bins in cleaned event files. If a bin has >2000 counts, and if more than 50% of those come from <1% of pixels, then it is considered to be noise-dominated and hence unusable.
| Quadrant | # 1 sec bins | Bins with >0 counts | Bins with >2000 counts | High rate bins dominated by noise | Noise dominated (total time) | Noise dominated (detector-on time) | Marked lightcurve |
|---|---|---|---|---|---|---|---|
| A | 7173 | 5019 | 60 | 60 | 0.84% | 1.20% | 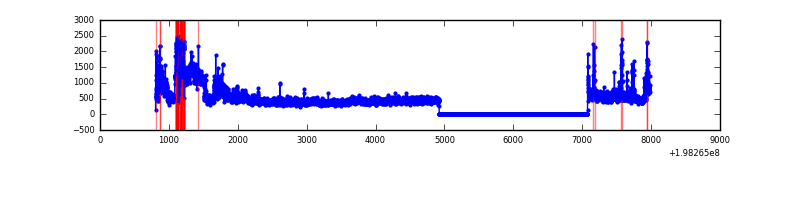 |
| B | 7173 | 5019 | 56 | 56 | 0.78% | 1.12% | 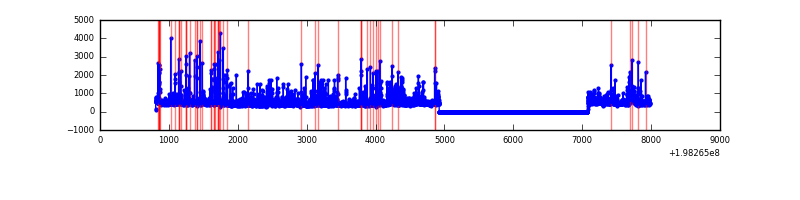 |
| C | 7173 | 5019 | 234 | 234 | 3.26% | 4.66% | 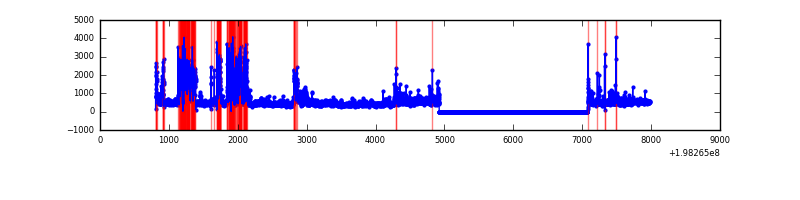 |
| D | 7173 | 5019 | 1332 | 1332 | 18.57% | 26.54% | 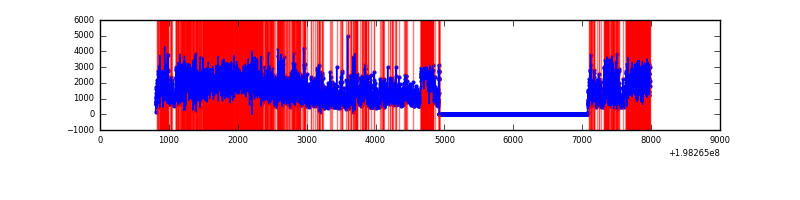 |
Top three noisy pixels from each quadrant. If the there are fewer than three noisy pixels in the level2.evt file, extra rows are filled as -1
| Pixel properties | Quadrant properties | ||||||
|---|---|---|---|---|---|---|---|
| Quadrant | DetID | PixID | Counts | Sigma | Mean | Median | Sigma |
| A | 14 | 63 | 522678 | 4948.04 | 509 | 498 | 105.5 |
| A | 8 | 15 | 179194 | 1693.28 | 509 | 498 | 105.5 |
| A | 0 | 31 | 58806 | 552.51 | 509 | 498 | 105.5 |
| B | 3 | 27 | 411889 | 4050.94 | 519 | 508 | 101.6 |
| B | 8 | 3 | 123917 | 1215.23 | 519 | 508 | 101.6 |
| B | 0 | 219 | 92338 | 904.27 | 519 | 508 | 101.6 |
| C | 0 | 219 | 1059222 | 9335.25 | 480 | 482 | 113.4 |
| C | 9 | 204 | 111148 | 975.78 | 480 | 482 | 113.4 |
| C | 6 | 80 | 89323 | 783.34 | 480 | 482 | 113.4 |
| D | 15 | 50 | 2003150 | 18720.08 | 417 | 408 | 107.0 |
| D | 15 | 194 | 1298716 | 12135.58 | 417 | 408 | 107.0 |
| D | 1 | 31 | 850460 | 7945.63 | 417 | 408 | 107.0 |
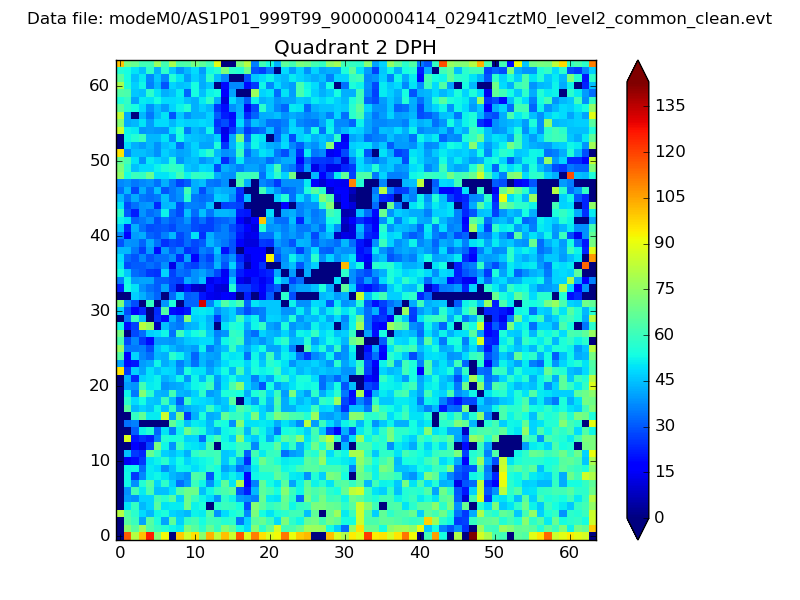
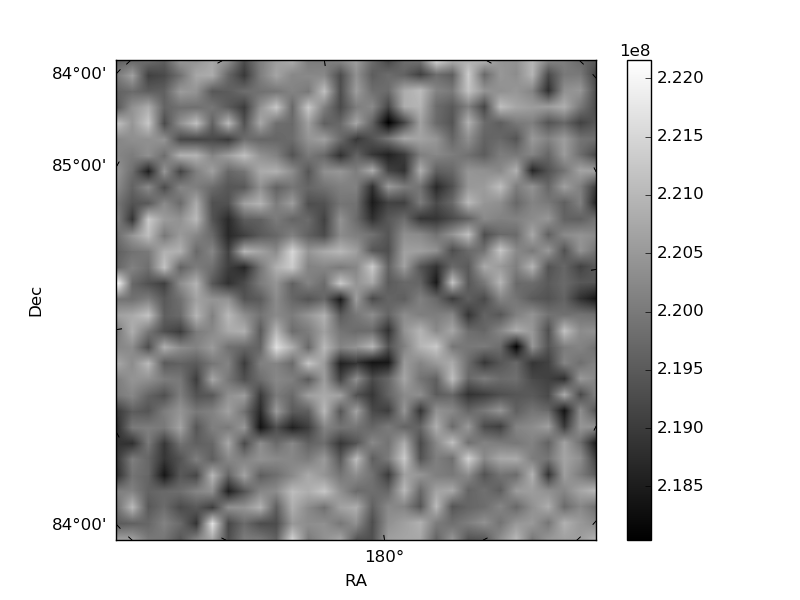
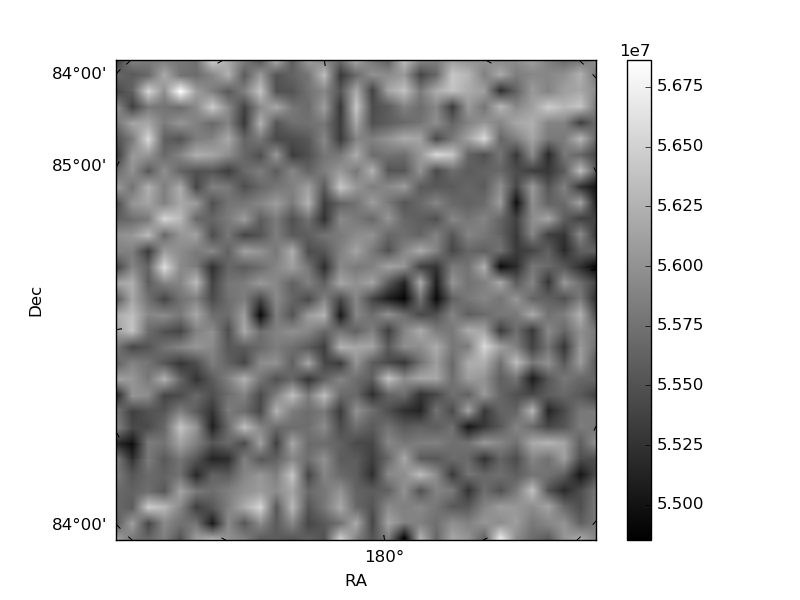
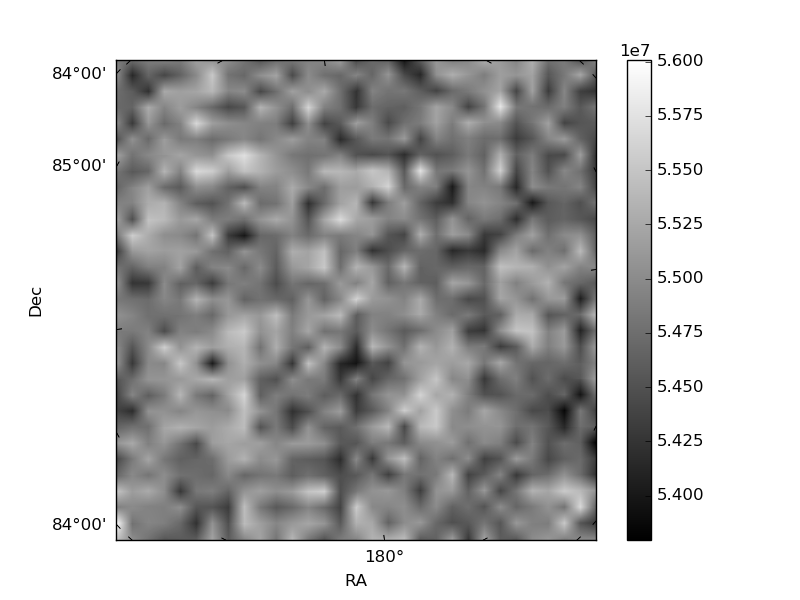
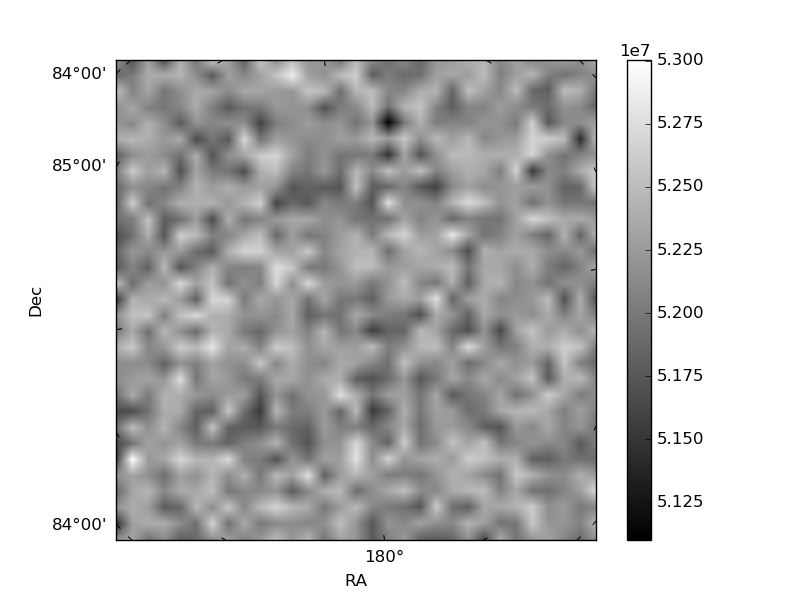
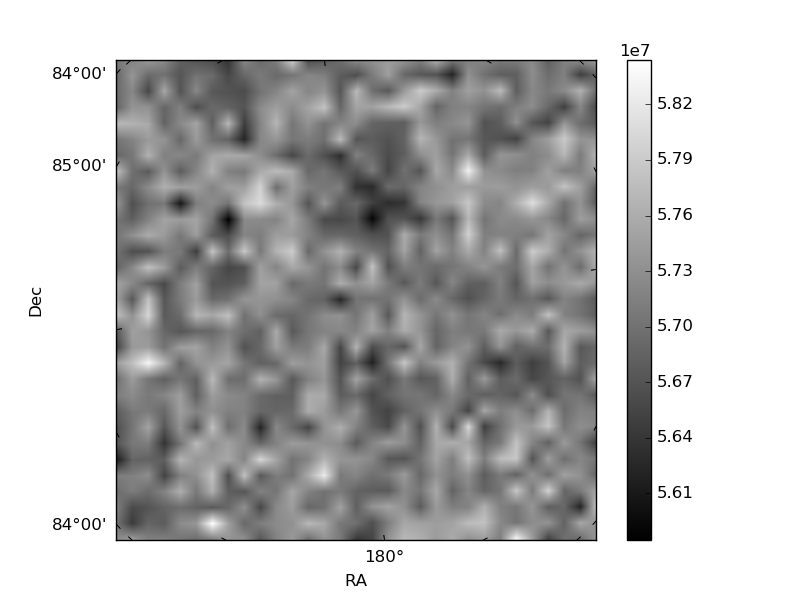
Histogram calculated using DETX and DETY for each event in the final _common_clean file
| Quadrant A | 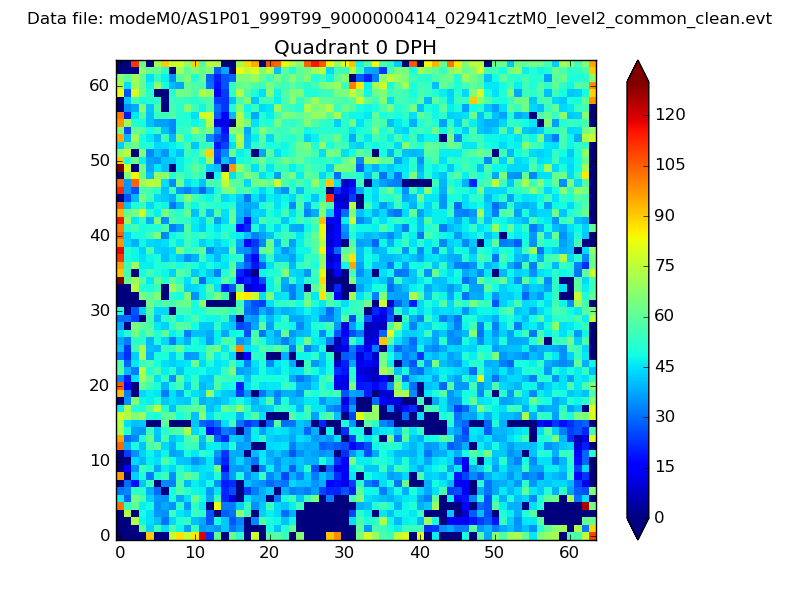 |
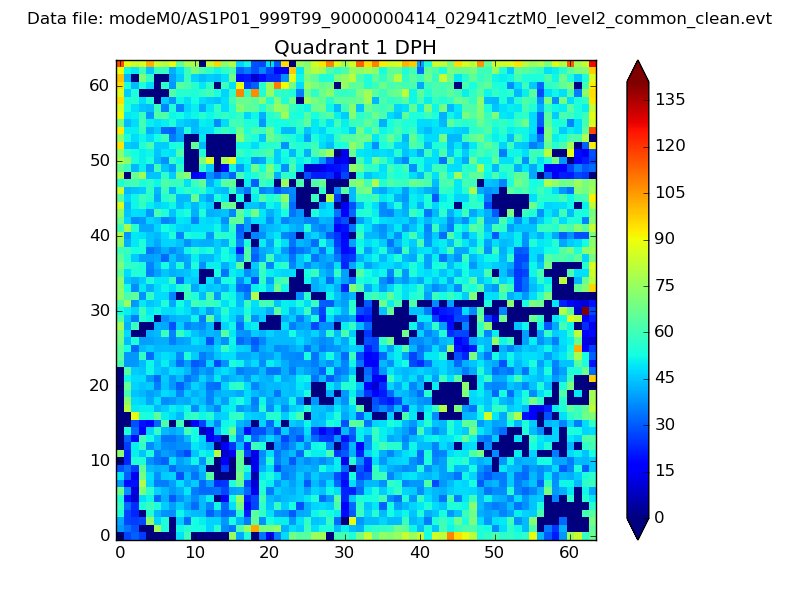 |
Quadrant B |
|---|---|---|---|
| Quadrant D | 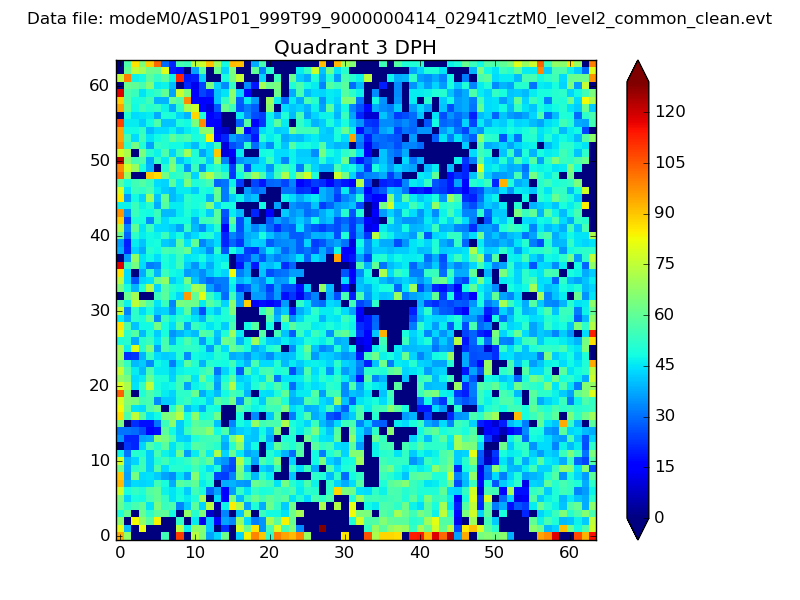 |
 |
Quadrant C |
| Plot type | Count rate plots | Images |
|---|---|---|
| Comparison with Poisson distribution Blue bars denote a histogram of data divided into 1 sec bins. Red curve is a Poisson curve with rate = median count rate of data. |
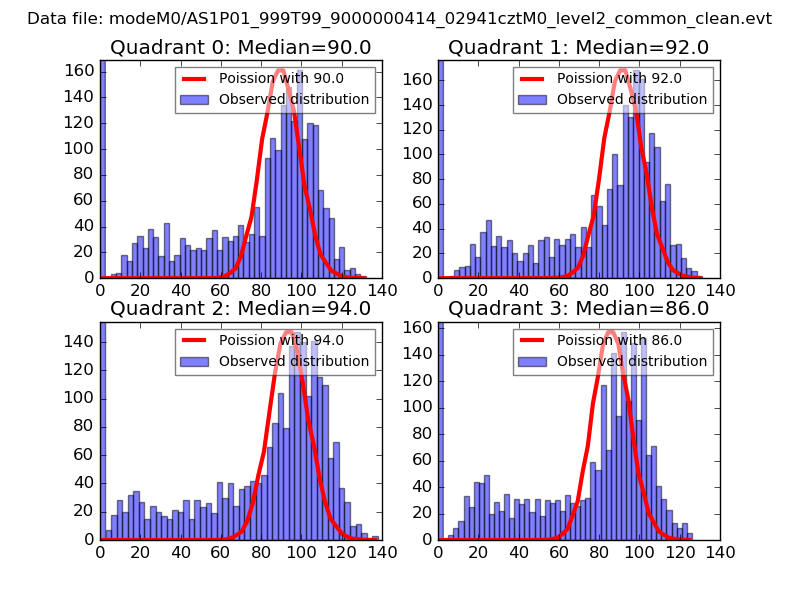 |
 |
| Quadrant-wise count rates Data is divided into 100 sec bins |
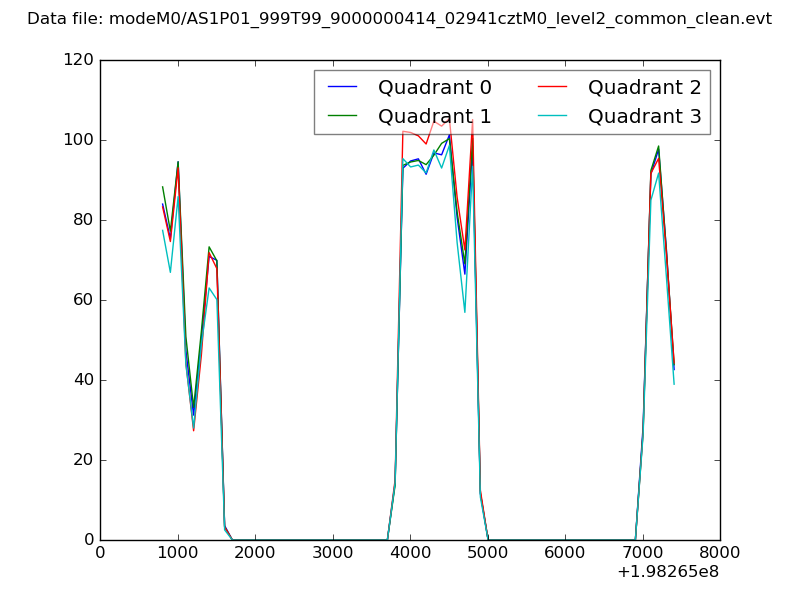 |
|
| Module-wise count rates for Quadrant A Data is divided into 100 sec bins |
 |
 |
| Module-wise count rates for Quadrant B Data is divided into 100 sec bins |
 |
 |
| Module-wise count rates for Quadrant C Data is divided into 100 sec bins |
 |
 |
| Module-wise count rates for Quadrant D Data is divided into 100 sec bins |
 |
 |
| Parameter | Plot |
|---|---|
| CZT HV Monitor |  |
| D_VDD | 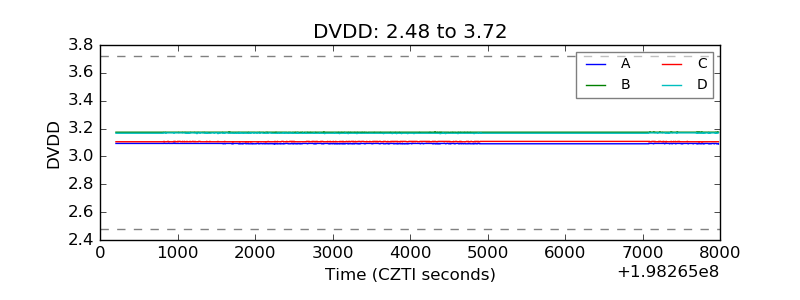 |
| Temperature 1 | 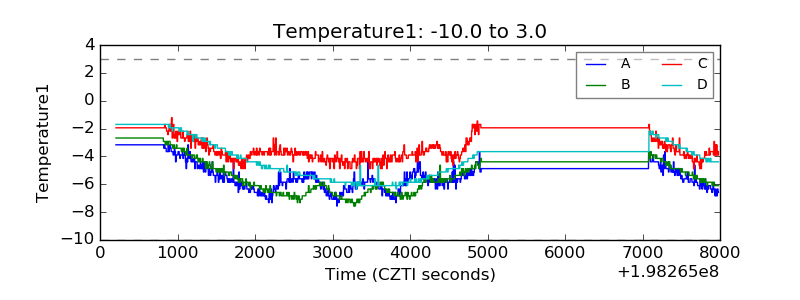 |
| Veto HV Monitor | 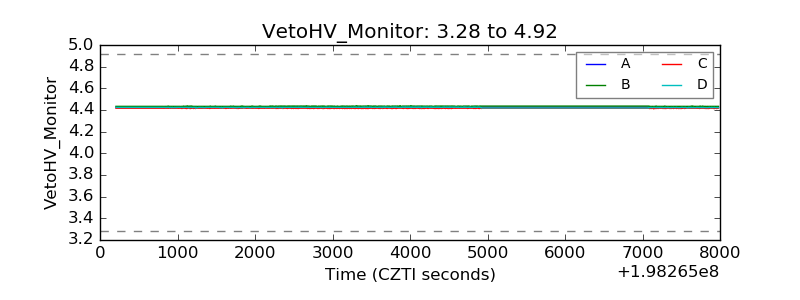 |
| Veto LLD | 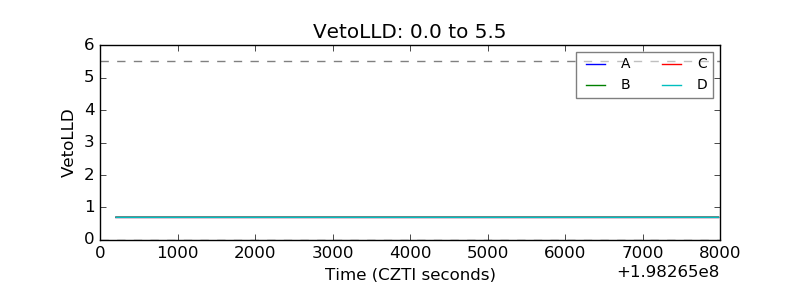 |
| Alpha Counter | 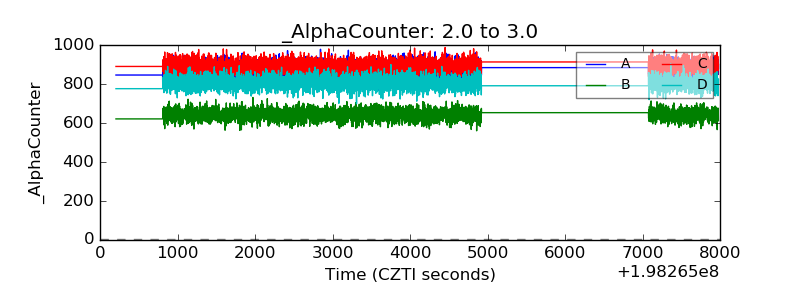 |
| _CPM_Rate | 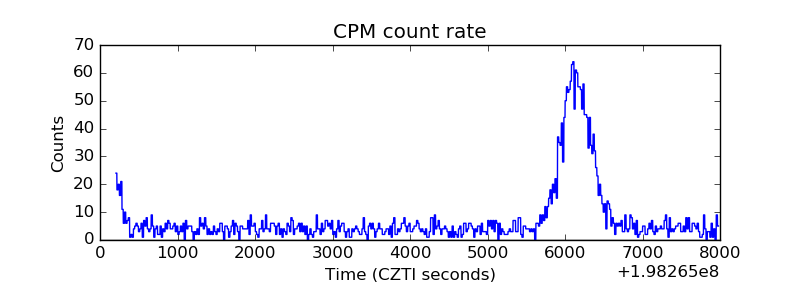 |
| CZT Counter | 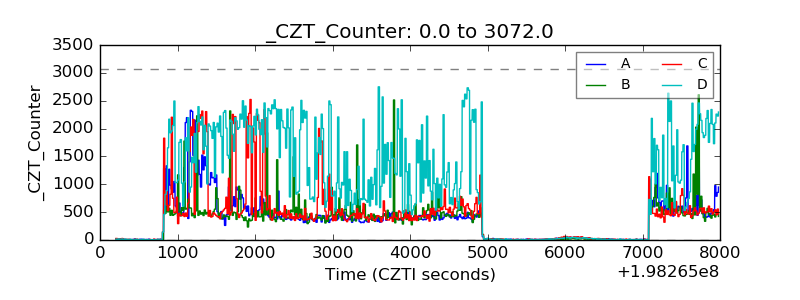 |
| +2.5 Volts monitor |  |
| +5 Volts monitor | 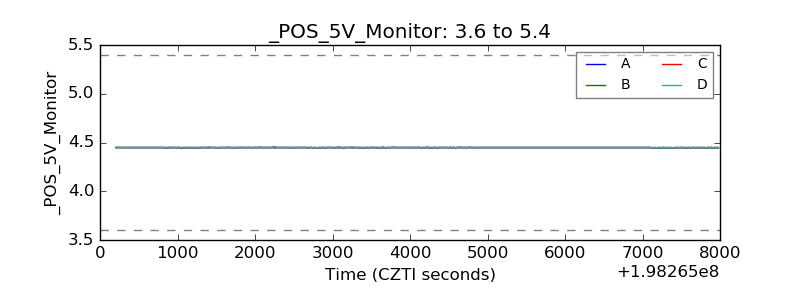 |
| Veto Counter |  |