| Param | Original file | Final file |
|---|---|---|
| Filename | modeM0/AS1P01_999T99_9000000414_02943cztM0_level2.evt | modeM0/AS1P01_999T99_9000000414_02943cztM0_level2_quad_clean.evt |
| Size (bytes) | 518,641,920 | 35,498,880 |
| Size | 494.6 MB | 33.9 MB |
| Events in quadrant A | 2,466,835 | 178,129 |
| Events in quadrant B | 2,636,521 | 179,852 |
| Events in quadrant C | 2,373,019 | 191,074 |
| Events in quadrant D | 7,883,467 | 166,247 |
| Mode M0 | |||
|---|---|---|---|
| Quadrant | BADHDUFLAG | Total packets | Discarded packets |
| A | 0 | 11083 | 3 |
| B | 0 | 11528 | 2 |
| C | 0 | 10924 | 2 |
| D | 0 | 27003 | 2 |
| Mode M9 | |||
|---|---|---|---|
| Quadrant | BADHDUFLAG | Total packets | Discarded packets |
| A | 0 | 27 | 0 |
| B | 0 | 27 | 0 |
| C | 0 | 27 | 0 |
| D | 0 | 28 | 0 |
| Mode SS | |||
|---|---|---|---|
| Quadrant | BADHDUFLAG | Total packets | Discarded packets |
| A | 0 | 104 | 0 |
| B | 0 | 104 | 0 |
| C | 0 | 104 | 0 |
| D | 0 | 104 | 0 |
| Quadrant | Total seconds | Saturated seconds | Saturation percentage |
|---|---|---|---|
| A | 5118 | 6 | 0.117233% |
| B | 5118 | 49 | 0.957405% |
| C | 5118 | 64 | 1.250488% |
| D | 5118 | 1858 | 36.303243% |
Noise dominated data is calculated using 1-second bins in cleaned event files. If a bin has >2000 counts, and if more than 50% of those come from <1% of pixels, then it is considered to be noise-dominated and hence unusable.
| Quadrant | # 1 sec bins | Bins with >0 counts | Bins with >2000 counts | High rate bins dominated by noise | Noise dominated (total time) | Noise dominated (detector-on time) | Marked lightcurve |
|---|---|---|---|---|---|---|---|
| A | 7272 | 5119 | 2 | 2 | 0.03% | 0.04% |  |
| B | 7272 | 5119 | 40 | 40 | 0.55% | 0.78% | 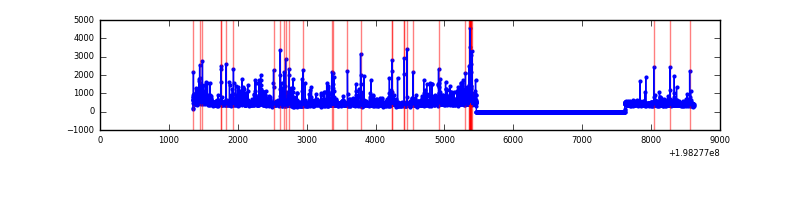 |
| C | 7272 | 5119 | 16 | 16 | 0.22% | 0.31% | 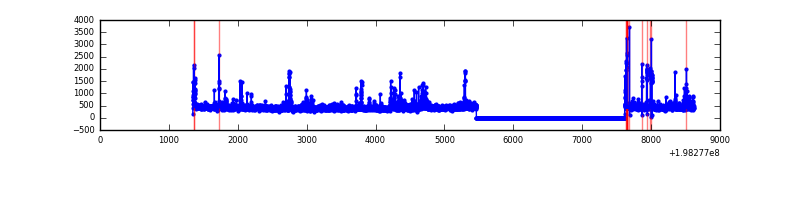 |
| D | 7272 | 5119 | 1515 | 1515 | 20.83% | 29.60% | 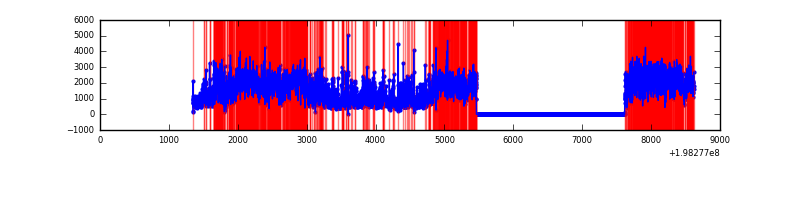 |
Top three noisy pixels from each quadrant. If the there are fewer than three noisy pixels in the level2.evt file, extra rows are filled as -1
| Pixel properties | Quadrant properties | ||||||
|---|---|---|---|---|---|---|---|
| Quadrant | DetID | PixID | Counts | Sigma | Mean | Median | Sigma |
| A | 8 | 15 | 381764 | 3591.09 | 513 | 502 | 106.2 |
| A | 12 | 133 | 50376 | 469.76 | 513 | 502 | 106.2 |
| A | 13 | 251 | 15977 | 145.76 | 513 | 502 | 106.2 |
| B | 3 | 27 | 224245 | 2171.0 | 523 | 511 | 103.1 |
| B | 3 | 175 | 182979 | 1770.57 | 523 | 511 | 103.1 |
| B | 8 | 3 | 73966 | 712.77 | 523 | 511 | 103.1 |
| C | 9 | 204 | 123766 | 1013.64 | 509 | 512 | 121.6 |
| C | 8 | 161 | 109069 | 892.78 | 509 | 512 | 121.6 |
| C | 6 | 80 | 44512 | 361.86 | 509 | 512 | 121.6 |
| D | 15 | 50 | 2027400 | 18376.93 | 437 | 428 | 110.3 |
| D | 15 | 194 | 1287751 | 11671.12 | 437 | 428 | 110.3 |
| D | 14 | 97 | 1109330 | 10053.52 | 437 | 428 | 110.3 |
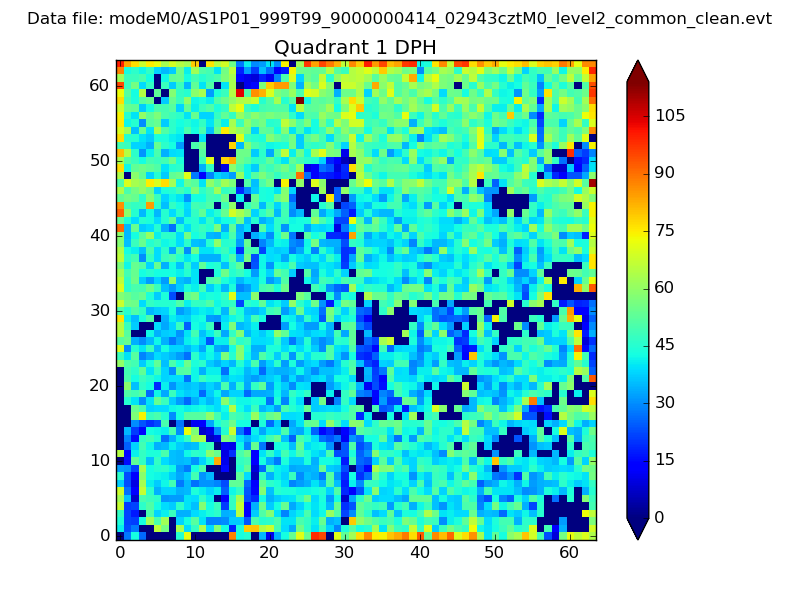
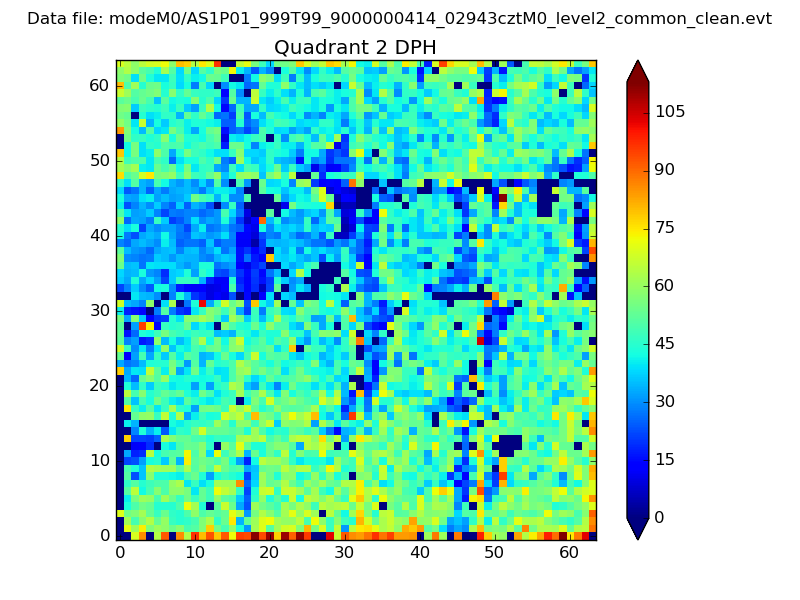
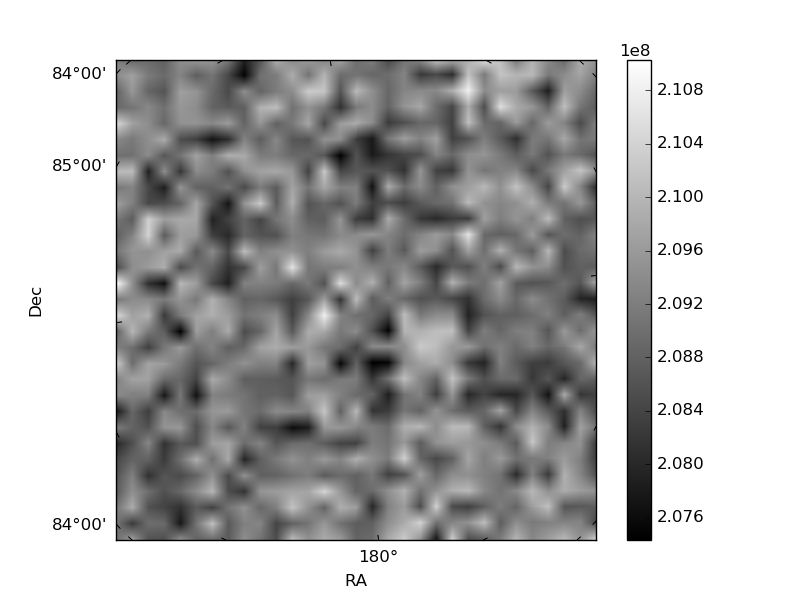
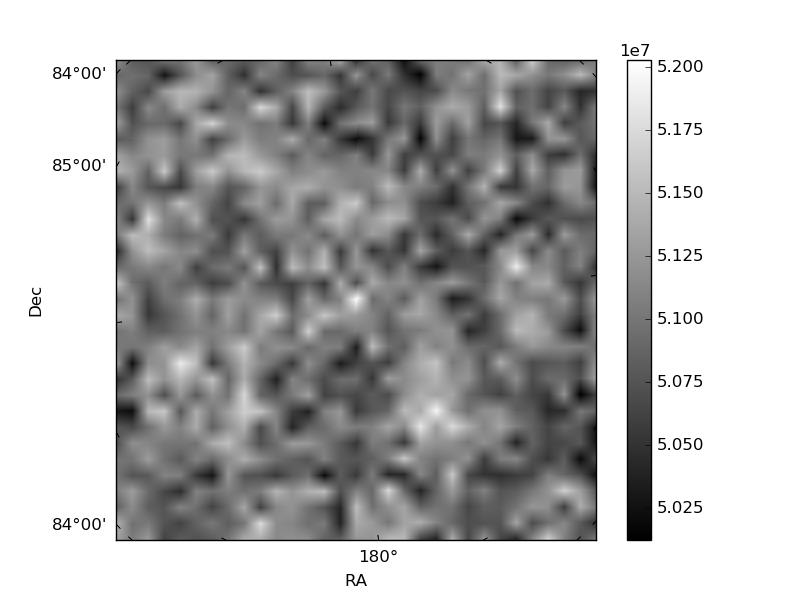
Histogram calculated using DETX and DETY for each event in the final _common_clean file
| Quadrant A | 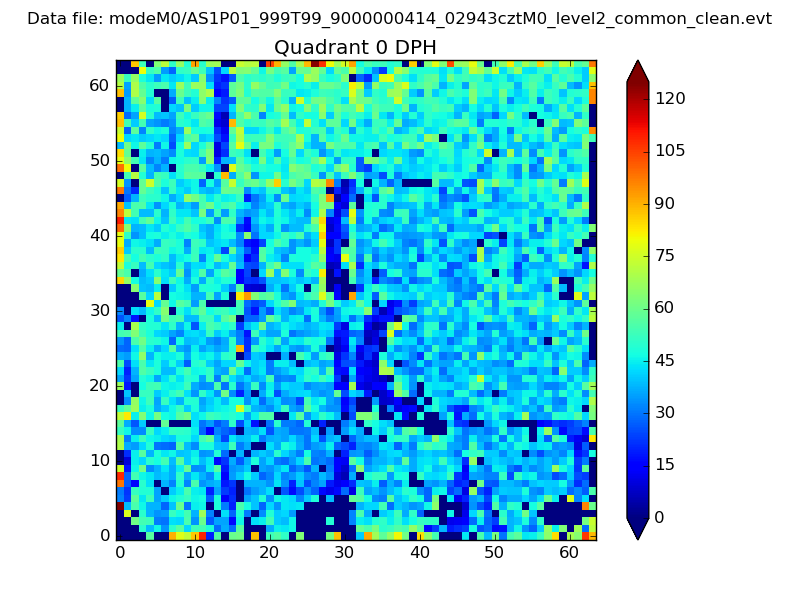 |
 |
Quadrant B |
|---|---|---|---|
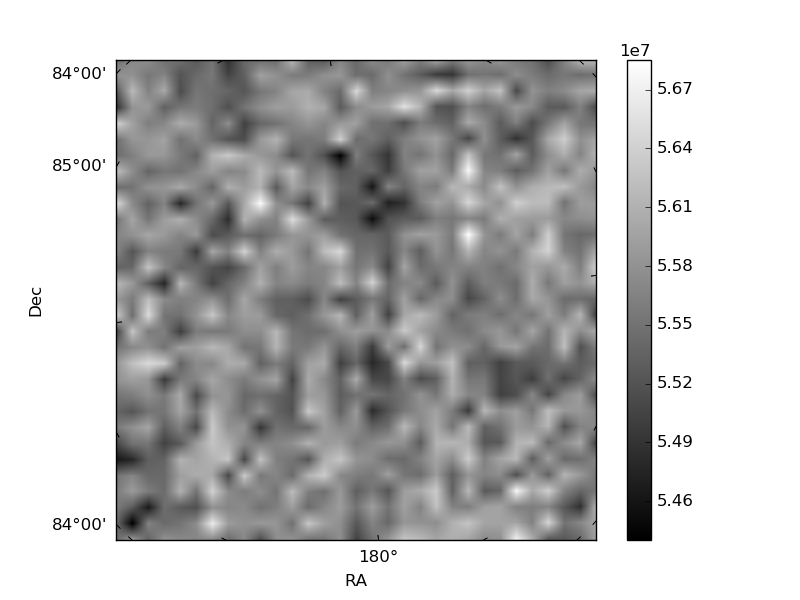
| Quadrant D | 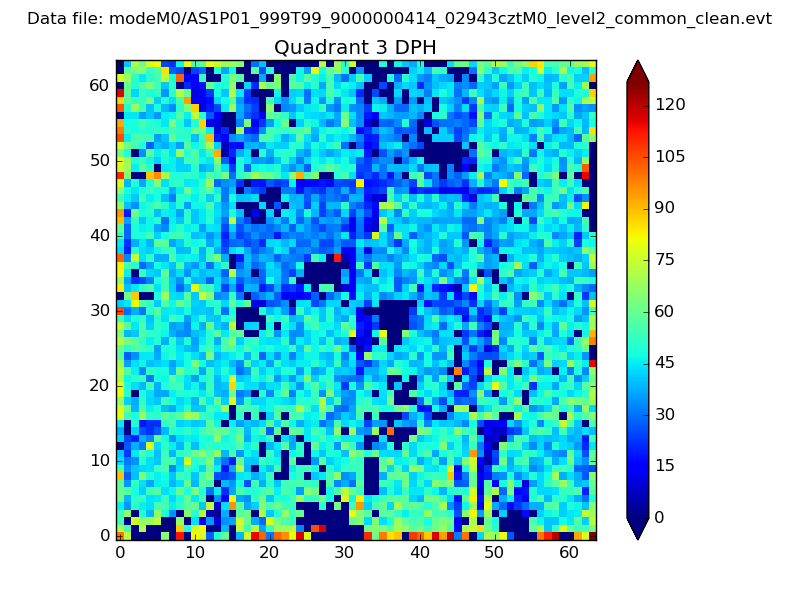 |
 |
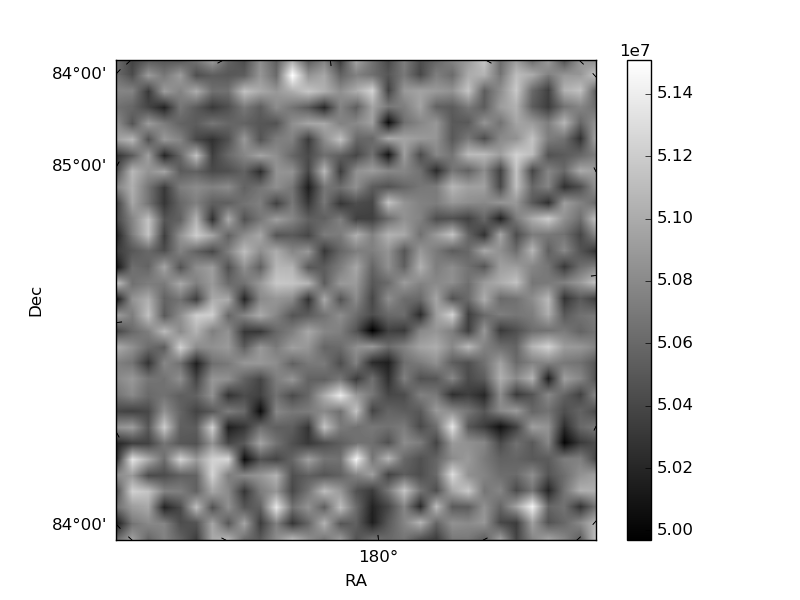
Quadrant C |
| Plot type | Count rate plots | Images |
|---|---|---|
| Comparison with Poisson distribution Blue bars denote a histogram of data divided into 1 sec bins. Red curve is a Poisson curve with rate = median count rate of data. |
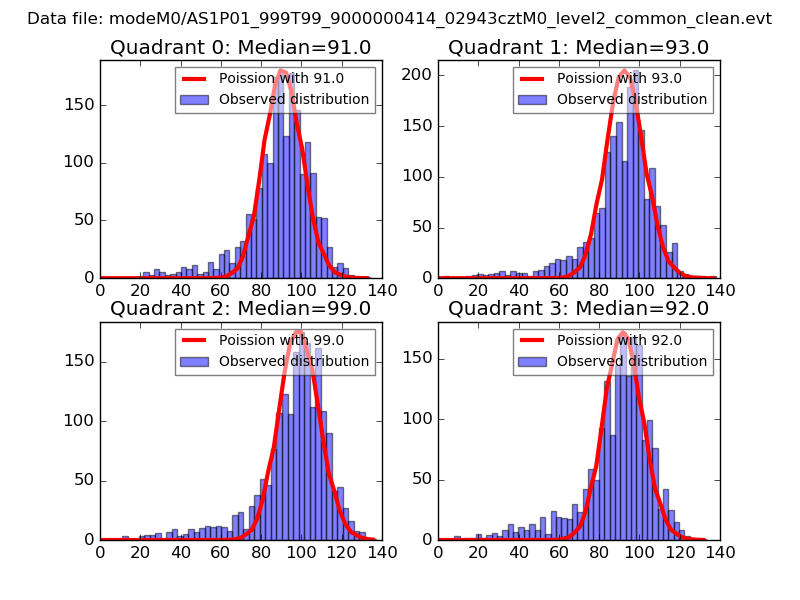 |
 |
| Quadrant-wise count rates Data is divided into 100 sec bins |
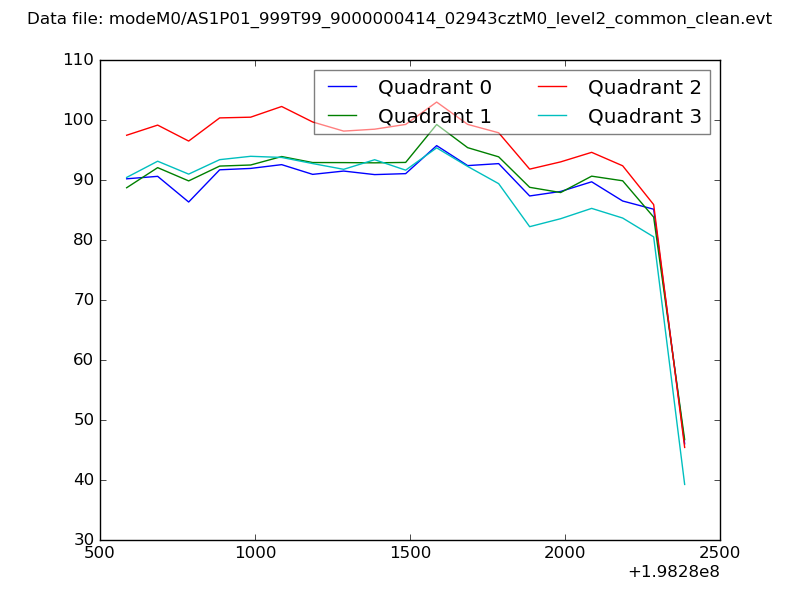 |
|
| Module-wise count rates for Quadrant A Data is divided into 100 sec bins |
 |
 |
| Module-wise count rates for Quadrant B Data is divided into 100 sec bins |
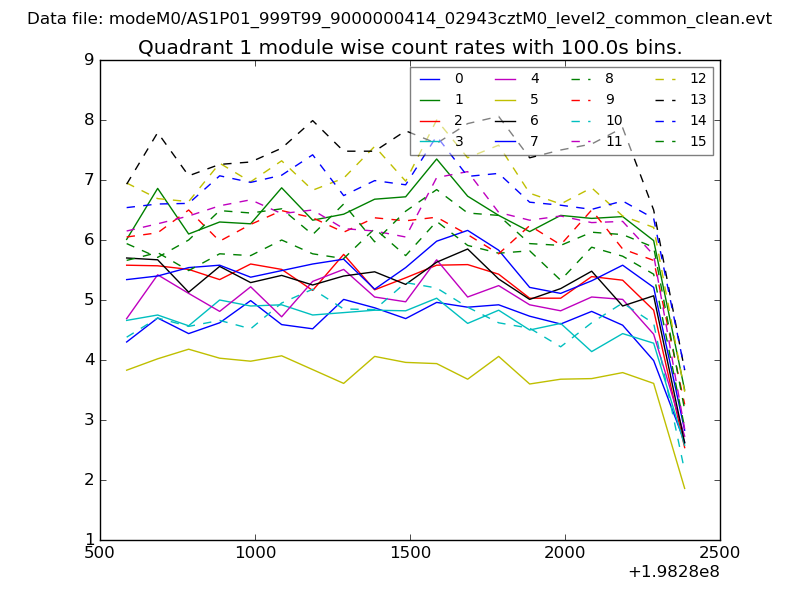 |
 |
| Module-wise count rates for Quadrant C Data is divided into 100 sec bins |
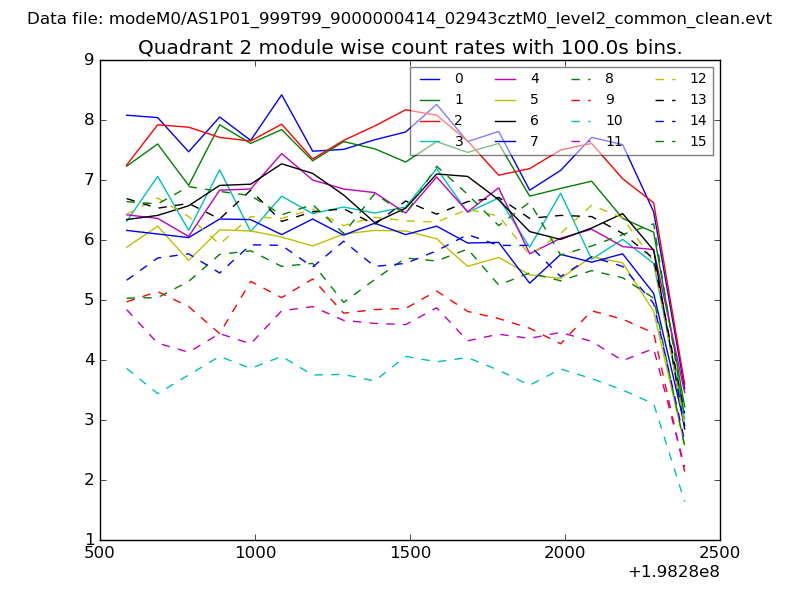 |
 |
| Module-wise count rates for Quadrant D Data is divided into 100 sec bins |
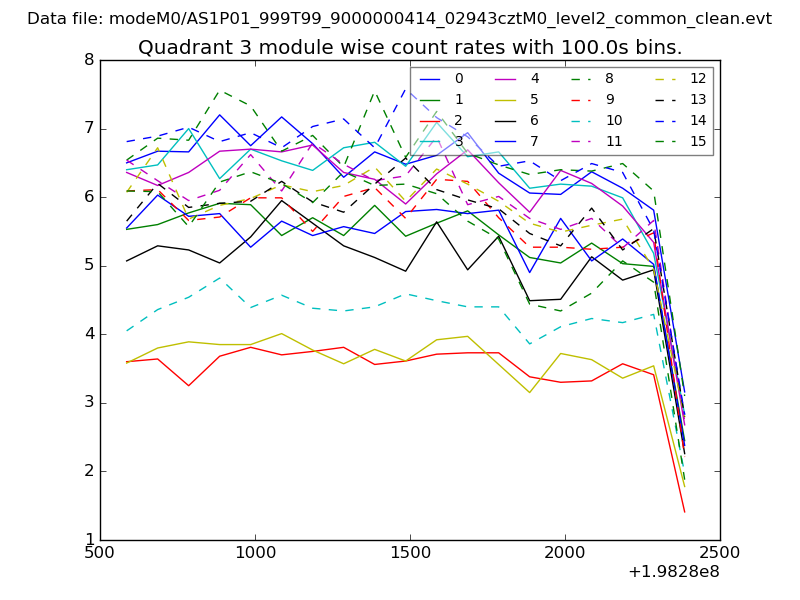 |
 |
| Parameter | Plot |
|---|---|
| CZT HV Monitor | 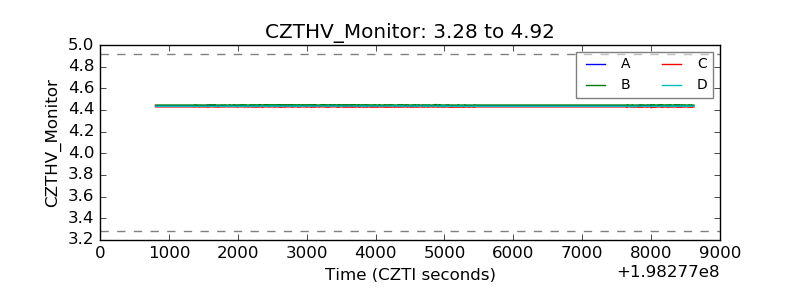 |
| D_VDD | 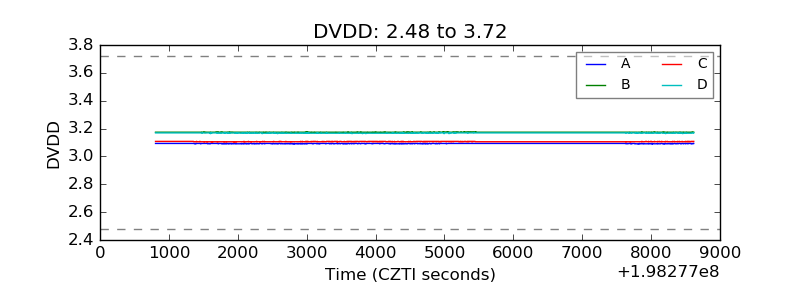 |
| Temperature 1 | 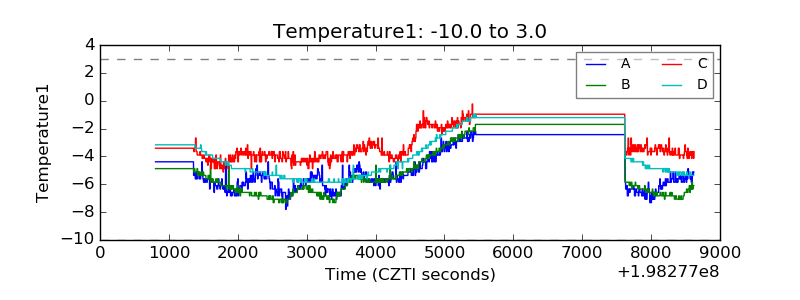 |
| Veto HV Monitor | 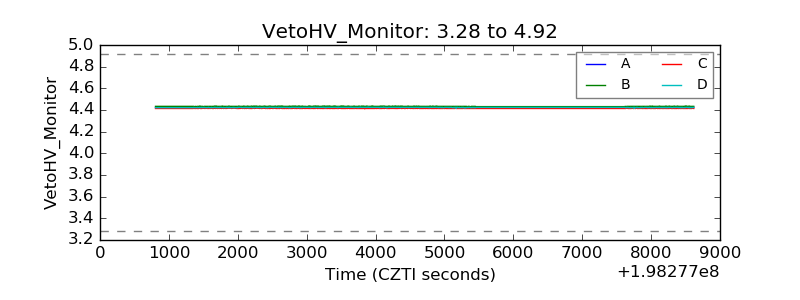 |
| Veto LLD | 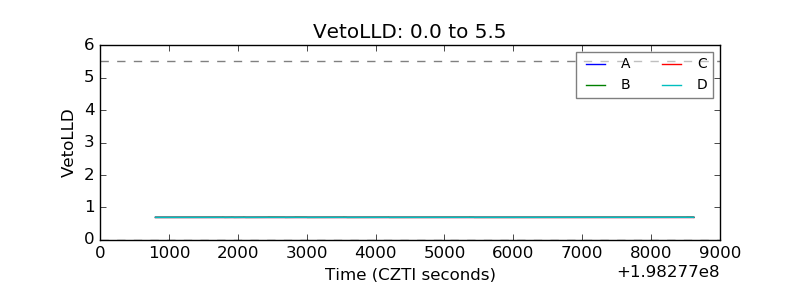 |
| Alpha Counter | 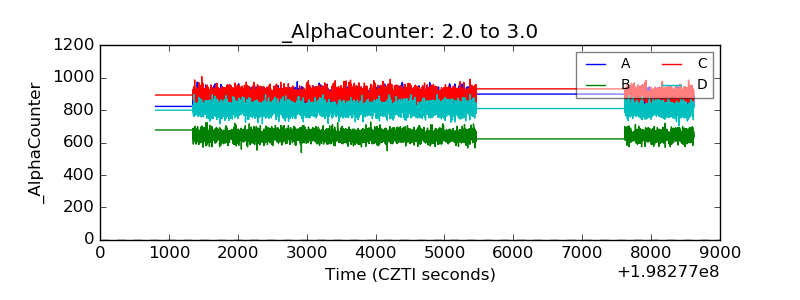 |
| _CPM_Rate | 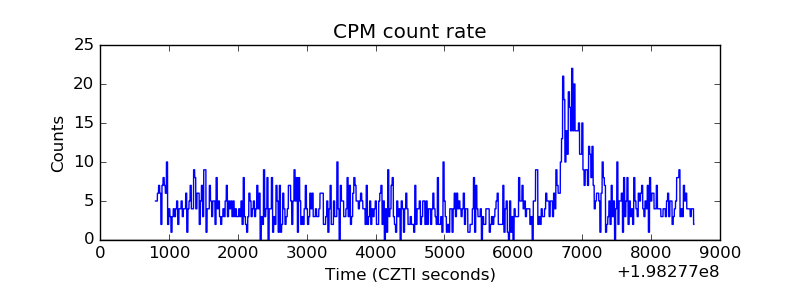 |
| CZT Counter | 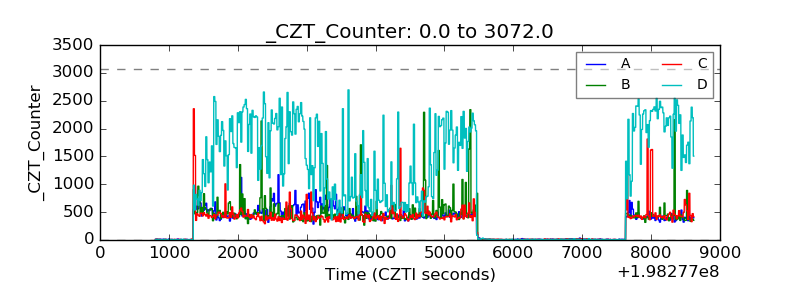 |
| +2.5 Volts monitor |  |
| +5 Volts monitor |  |
| Veto Counter | 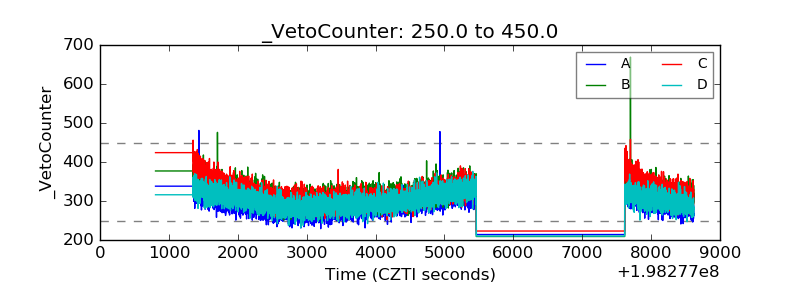 |