| Param | Original file | Final file |
|---|---|---|
| Filename | modeM0/AS1P01_999T99_9000000414_02944cztM0_level2.evt | modeM0/AS1P01_999T99_9000000414_02944cztM0_level2_quad_clean.evt |
| Size (bytes) | 270,066,240 | 20,632,320 |
| Size | 257.6 MB | 19.7 MB |
| Events in quadrant A | 1,152,509 | 101,829 |
| Events in quadrant B | 1,361,724 | 102,150 |
| Events in quadrant C | 1,407,392 | 111,255 |
| Events in quadrant D | 4,056,921 | 100,142 |
| Mode M0 | |||
|---|---|---|---|
| Quadrant | BADHDUFLAG | Total packets | Discarded packets |
| A | 0 | 5876 | 2 |
| B | 0 | 6341 | 1 |
| C | 0 | 6422 | 1 |
| D | 0 | 14067 | 1 |
| Mode M9 | |||
|---|---|---|---|
| Quadrant | BADHDUFLAG | Total packets | Discarded packets |
| A | 0 | 9 | 0 |
| B | 0 | 9 | 0 |
| C | 0 | 9 | 0 |
| D | 0 | 10 | 0 |
| Mode SS | |||
|---|---|---|---|
| Quadrant | BADHDUFLAG | Total packets | Discarded packets |
| A | 0 | 58 | 0 |
| B | 0 | 58 | 0 |
| C | 0 | 58 | 0 |
| D | 0 | 58 | 0 |
| Quadrant | Total seconds | Saturated seconds | Saturation percentage |
|---|---|---|---|
| A | 2925 | 4 | 0.136752% |
| B | 2925 | 33 | 1.128205% |
| C | 2925 | 62 | 2.119658% |
| D | 2925 | 872 | 29.811966% |
Noise dominated data is calculated using 1-second bins in cleaned event files. If a bin has >2000 counts, and if more than 50% of those come from <1% of pixels, then it is considered to be noise-dominated and hence unusable.
| Quadrant | # 1 sec bins | Bins with >0 counts | Bins with >2000 counts | High rate bins dominated by noise | Noise dominated (total time) | Noise dominated (detector-on time) | Marked lightcurve |
|---|---|---|---|---|---|---|---|
| A | 2925 | 2925 | 0 | 0 | 0.00% | 0.00% | 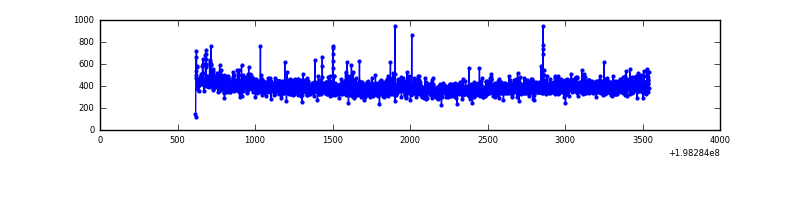 |
| B | 2925 | 2925 | 33 | 33 | 1.13% | 1.13% | 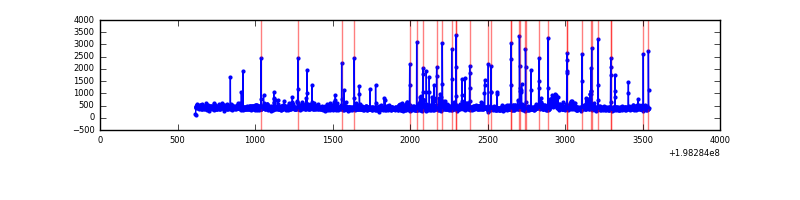 |
| C | 2925 | 2925 | 20 | 20 | 0.68% | 0.68% | 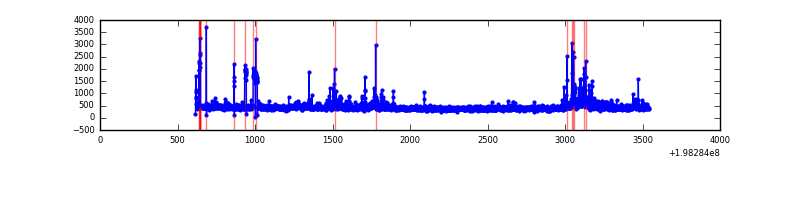 |
| D | 2925 | 2925 | 703 | 703 | 24.03% | 24.03% | 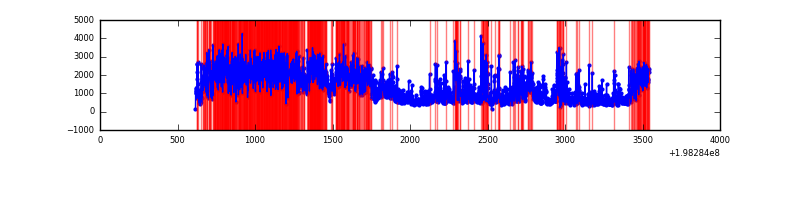 |
Top three noisy pixels from each quadrant. If the there are fewer than three noisy pixels in the level2.evt file, extra rows are filled as -1
| Pixel properties | Quadrant properties | ||||||
|---|---|---|---|---|---|---|---|
| Quadrant | DetID | PixID | Counts | Sigma | Mean | Median | Sigma |
| A | 13 | 251 | 15158 | 246.9 | 285 | 278 | 60.3 |
| A | 14 | 63 | 10907 | 176.37 | 285 | 278 | 60.3 |
| A | 12 | 133 | 9325 | 150.12 | 285 | 278 | 60.3 |
| B | 3 | 27 | 171770 | 2915.95 | 291 | 284 | 58.8 |
| B | 0 | 228 | 15921 | 265.89 | 291 | 284 | 58.8 |
| B | 8 | 3 | 11310 | 187.49 | 291 | 284 | 58.8 |
| C | 9 | 204 | 112555 | 1670.3 | 280 | 281 | 67.2 |
| C | 8 | 161 | 83739 | 1241.61 | 280 | 281 | 67.2 |
| C | 9 | 185 | 44009 | 650.54 | 280 | 281 | 67.2 |
| D | 14 | 97 | 1008834 | 16070.5 | 244 | 240 | 62.8 |
| D | 15 | 50 | 933896 | 14876.47 | 244 | 240 | 62.8 |
| D | 15 | 194 | 595371 | 9482.56 | 244 | 240 | 62.8 |
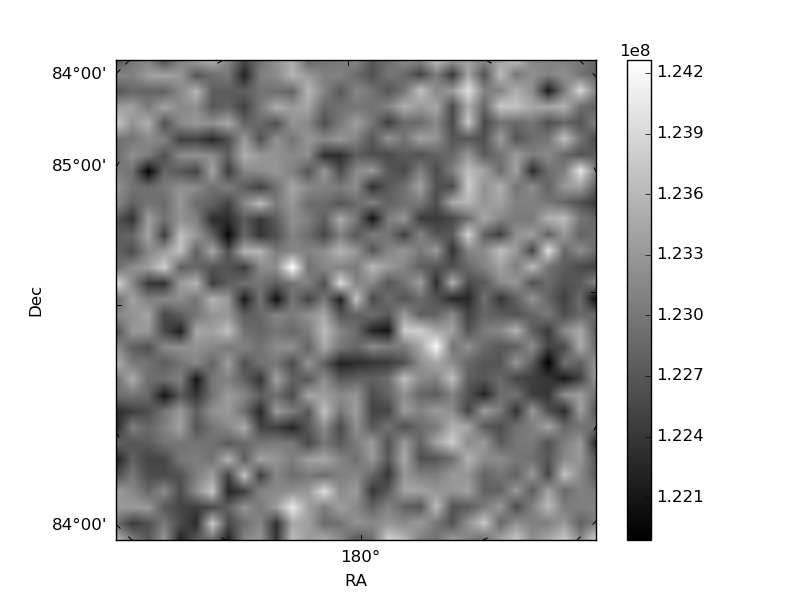
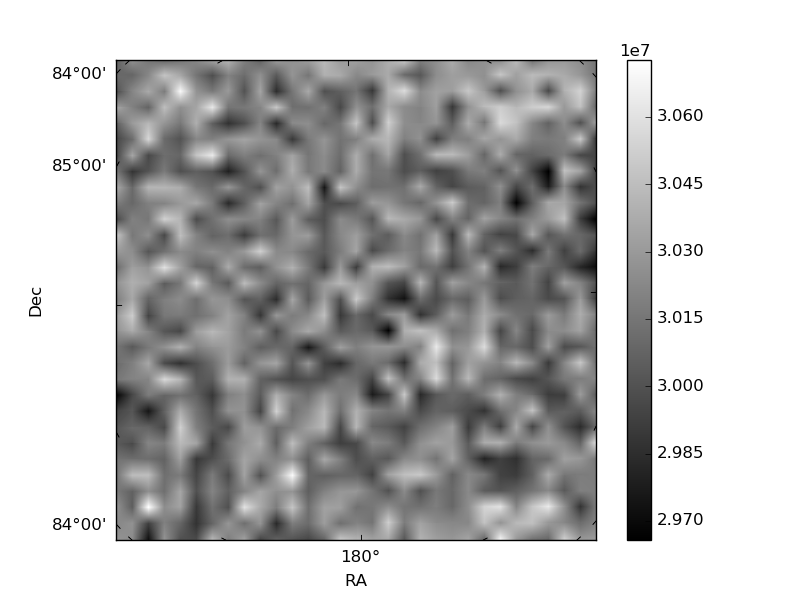
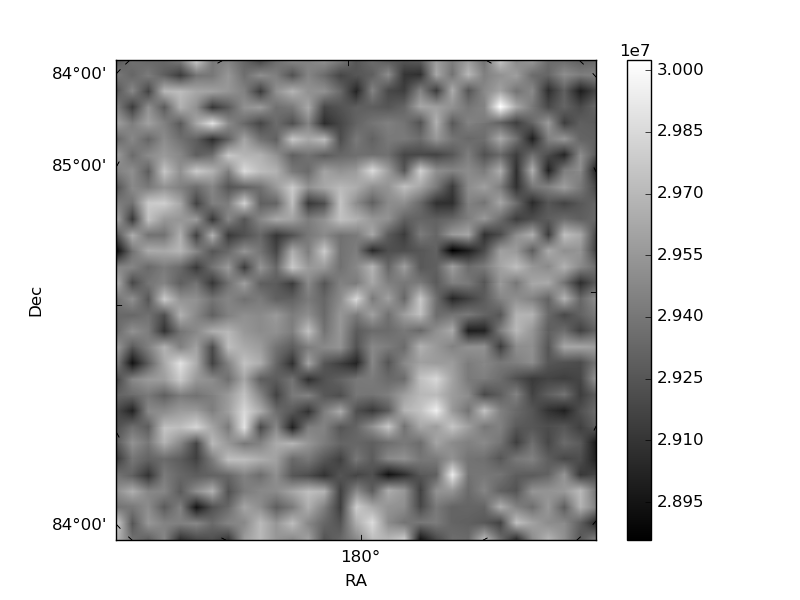
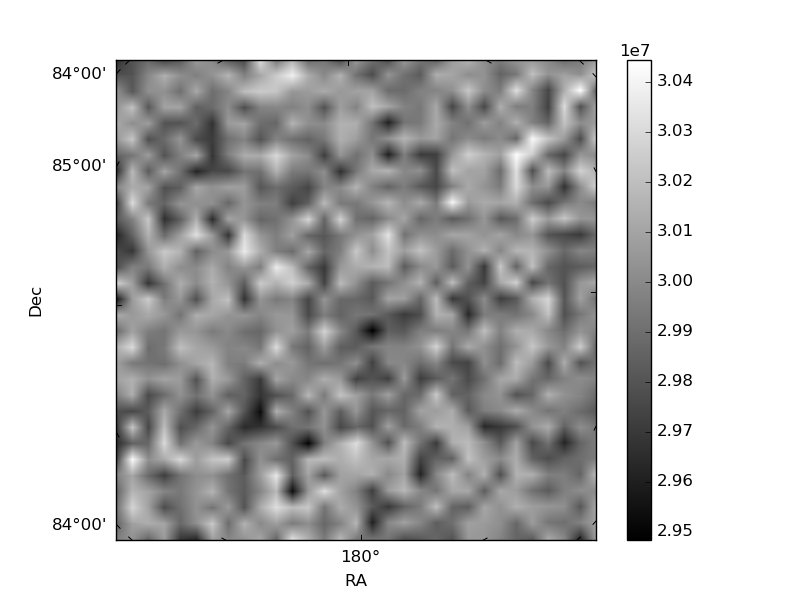
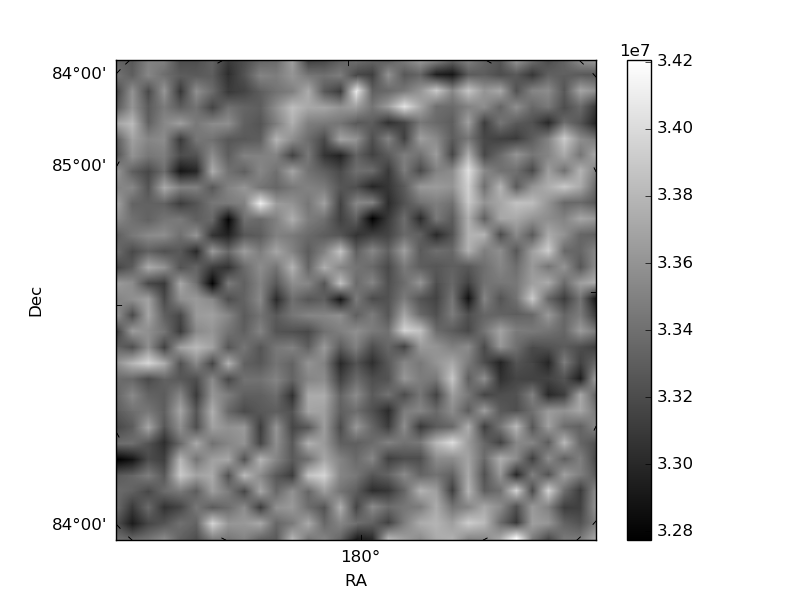
Histogram calculated using DETX and DETY for each event in the final _common_clean file
| Quadrant A | 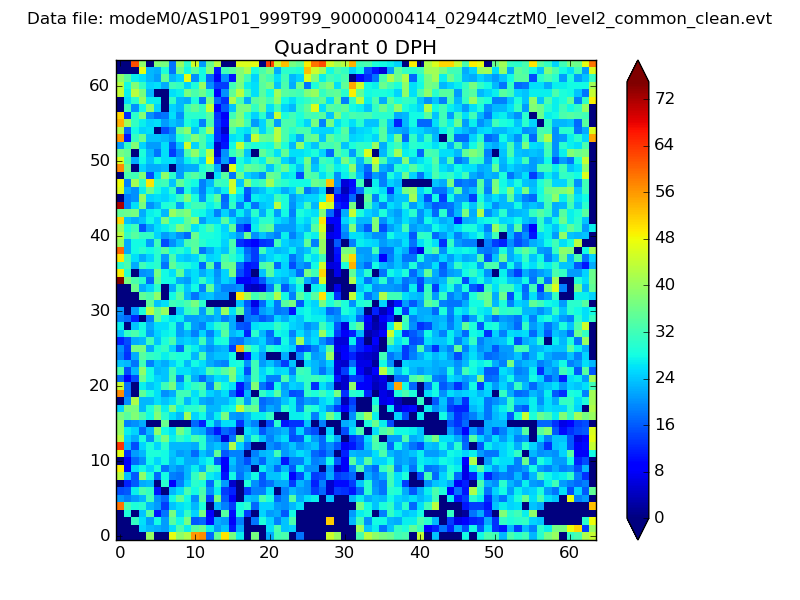 |
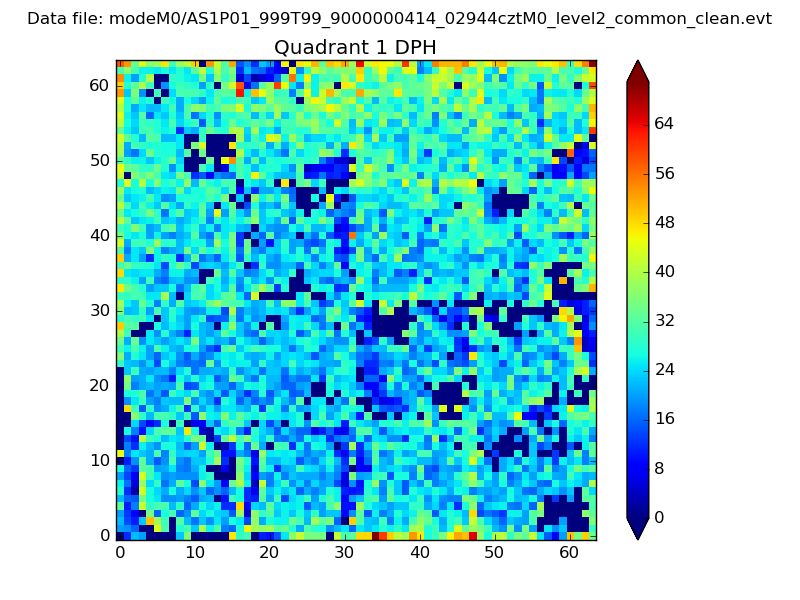 |
Quadrant B |
|---|---|---|---|
| Quadrant D | 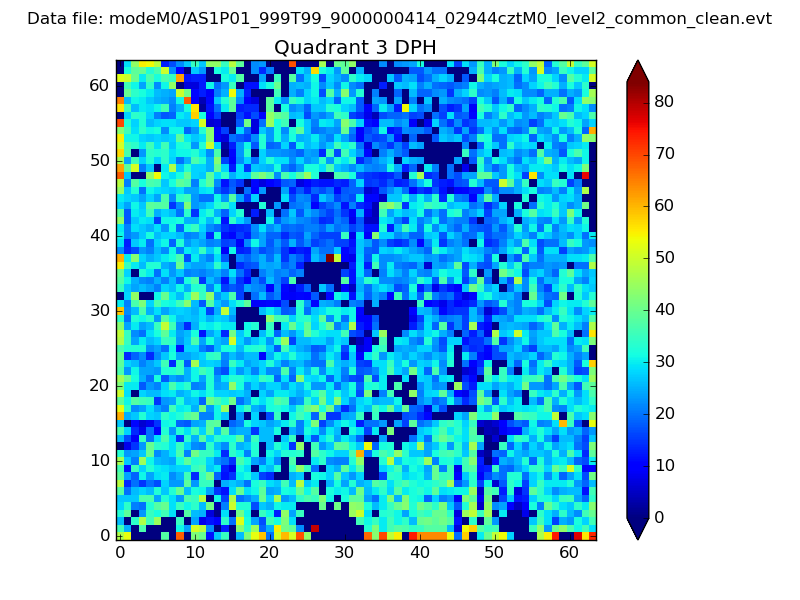 |
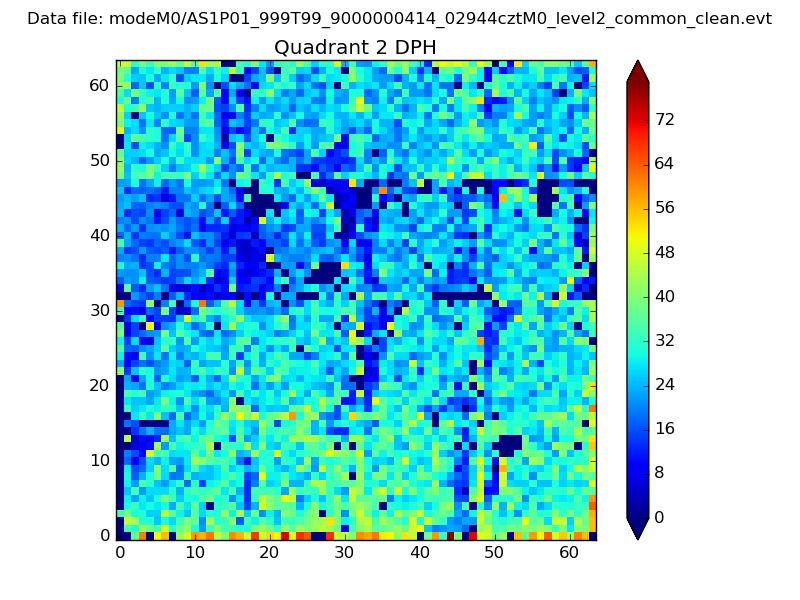 |
Quadrant C |
| Plot type | Count rate plots | Images |
|---|---|---|
| Comparison with Poisson distribution Blue bars denote a histogram of data divided into 1 sec bins. Red curve is a Poisson curve with rate = median count rate of data. |
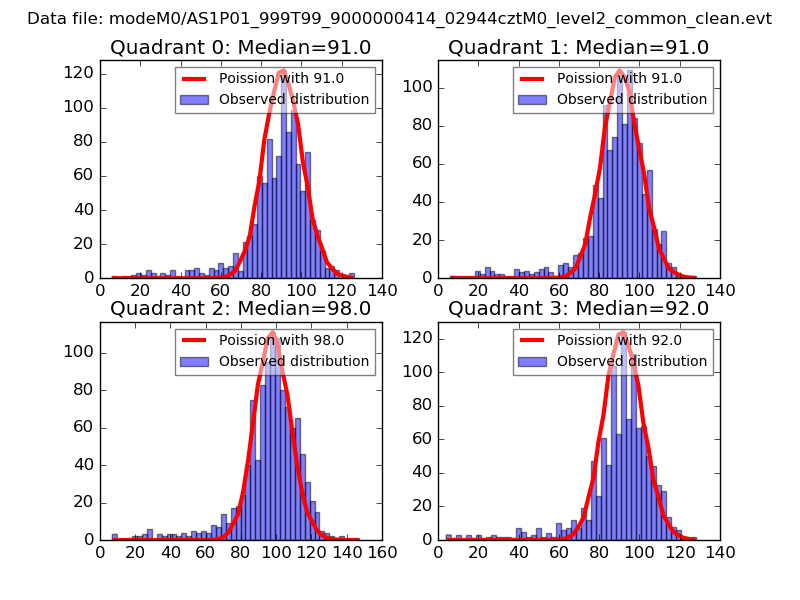 |
 |
| Quadrant-wise count rates Data is divided into 100 sec bins |
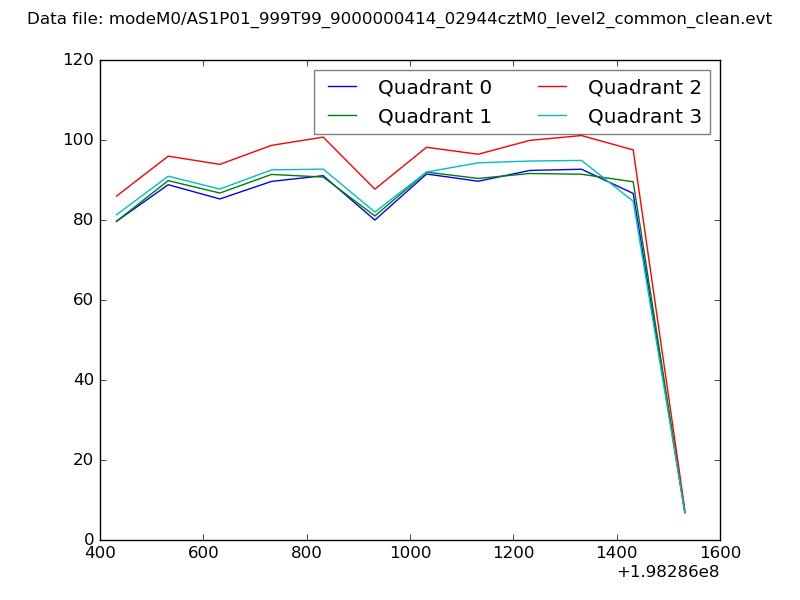 |
|
| Module-wise count rates for Quadrant A Data is divided into 100 sec bins |
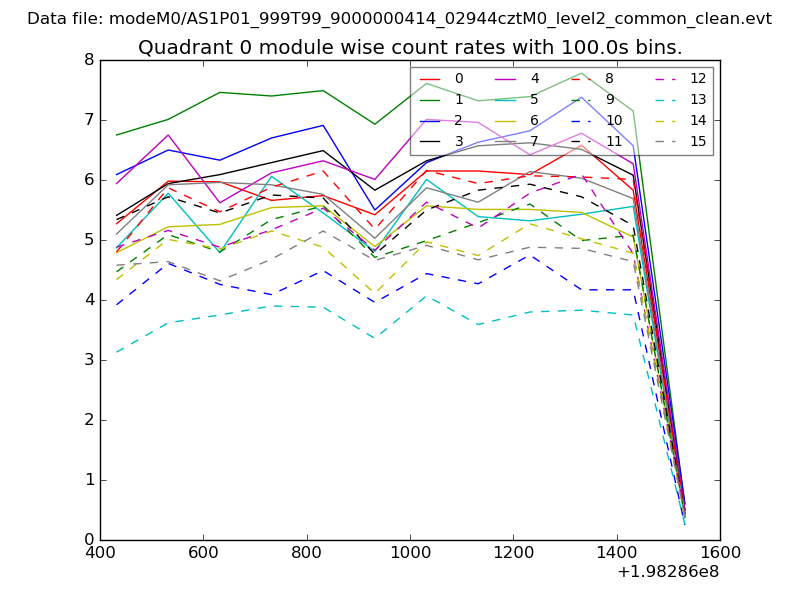 |
 |
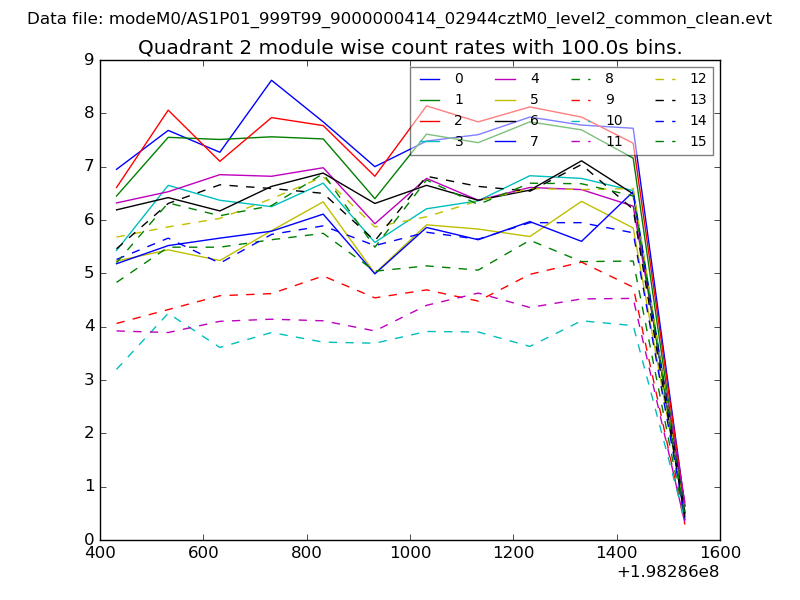
| Module-wise count rates for Quadrant B Data is divided into 100 sec bins |
 |
 |
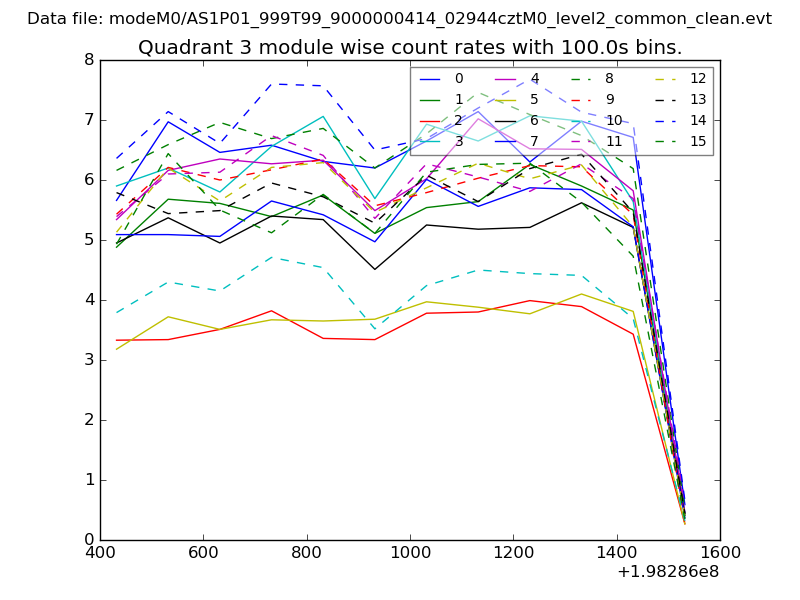
| Module-wise count rates for Quadrant C Data is divided into 100 sec bins |
 |
 |
| Module-wise count rates for Quadrant D Data is divided into 100 sec bins |
 |
 |
| Parameter | Plot |
|---|---|
| CZT HV Monitor | 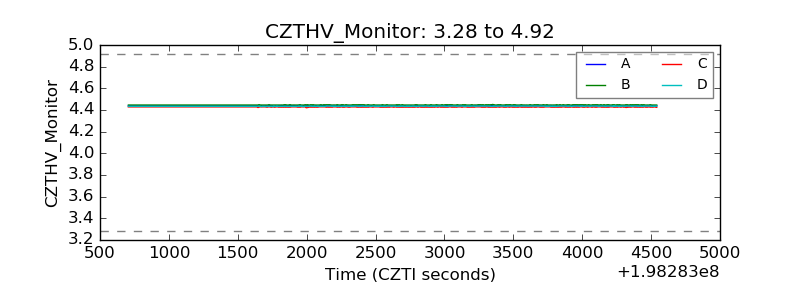 |
| D_VDD | 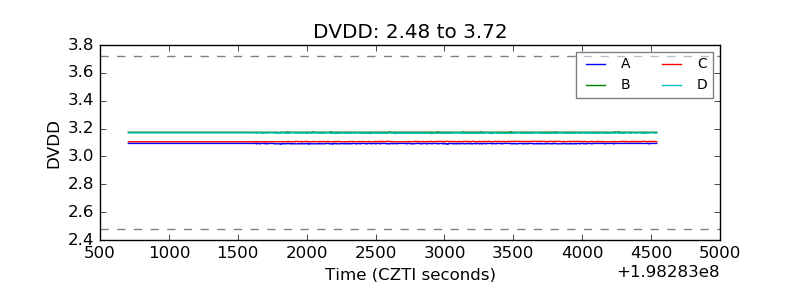 |
| Temperature 1 |  |
| Veto HV Monitor | 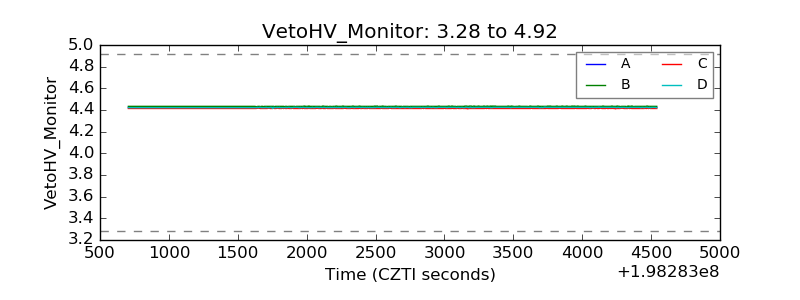 |
| Veto LLD | 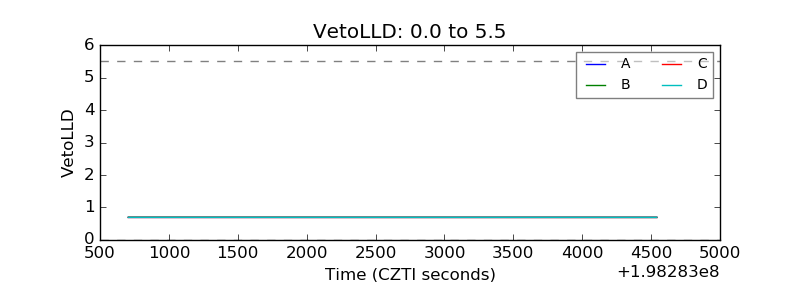 |
| Alpha Counter | 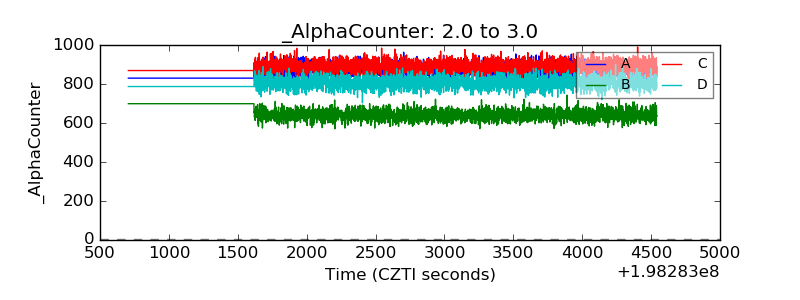 |
| _CPM_Rate | 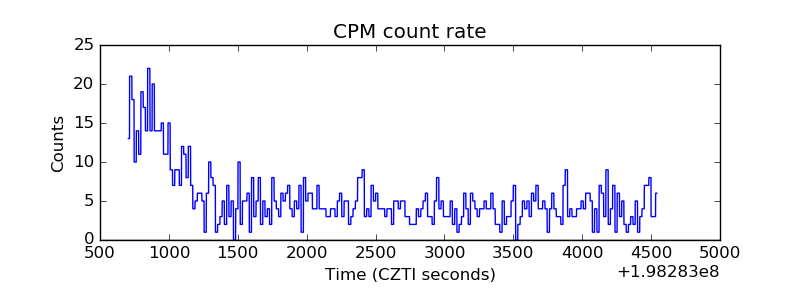 |
| CZT Counter | 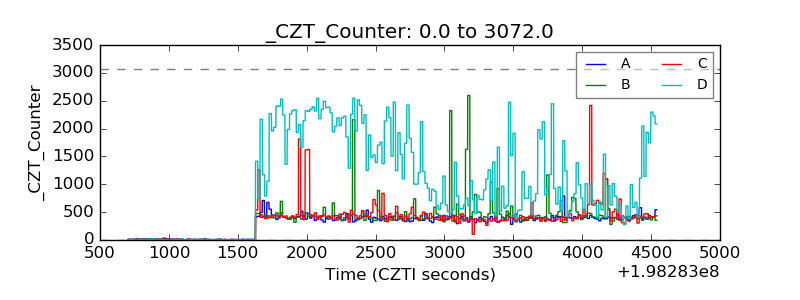 |
| +2.5 Volts monitor |  |
| +5 Volts monitor |  |
| Veto Counter | 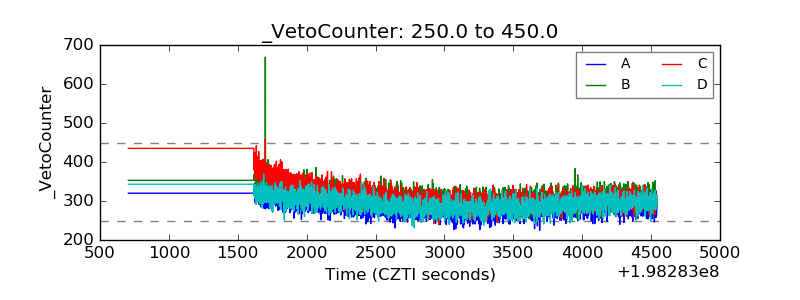 |